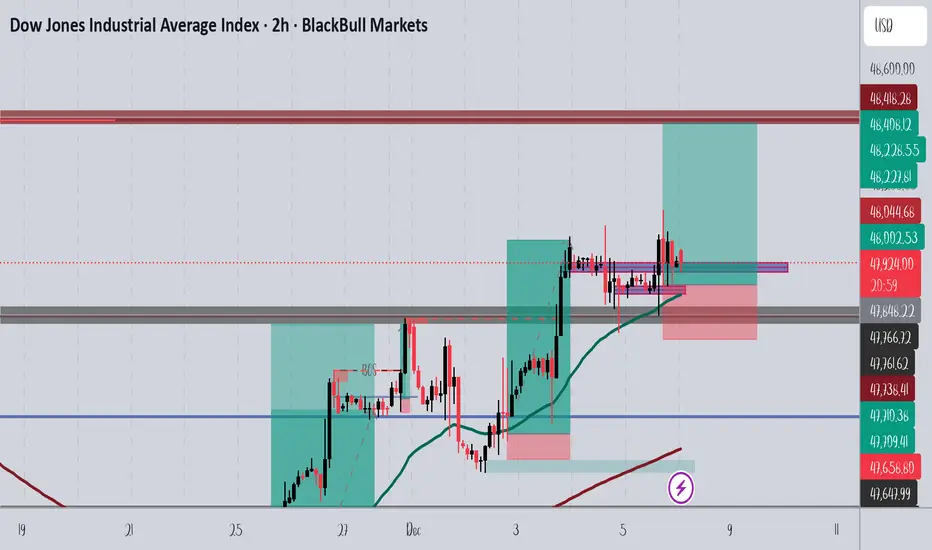
US30 Dow Jones Weekly Open Retest Strategy’m watching US30 (Dow Jones) closely right now, and it’s been in a strong bullish trend over the last two weeks. 📈🔥 We’ve seen two powerful drives to the upside, and there’s a good chance we could get that classic third drive completing a three-drive pattern before the week ends.
As price pushed higher, it’s already dipped back down into sell-side liquidity, clearing out those resting lows. That kind of move often sets the stage for another leg higher, so it’s definitely possible we see US30 continue north from the current levels. ⬆️💰
At the same time, it wouldn’t surprise me to see price pull back a bit more, possibly dipping below the weekly open to rebalance before making its next move.
Either way, my focus is on the weekly open. I want to see price break through it, come back, retest it, and show me that the level is now acting as support. That retest is the zone where I’d be interested in looking for long opportunities. 🟩📊
Stay patient and wait for clean structure.
Not financial advice.
Market insights

US30 -2HR SetupPrice is holding above the demand zone after a clean break of structure. As long as this level is maintained, bullish continuation toward the next resistance remains in play.
US30 Trade Set Up Dec 5 2025Price has shifted to bearish structure failing to close higher and now making LL/LH with SSL and Daily FVGs below to target so first i want to see internal 5m-15m bearish structure to continue lower

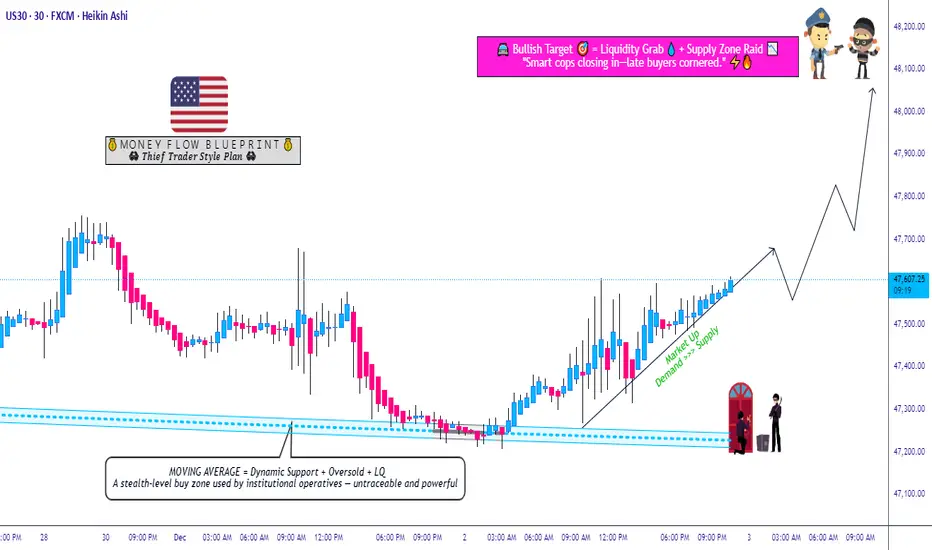
US30 Bullish Plan! Layered Entries + Clean Targets Mapped🔥 DOW JONES (US30) BULLISH PULLBACK - THIEF STRATEGY LAYER ENTRY! 🔥
📈 Asset: CAPITALCOM:US30 (Dow Jones Industrial Average CFD)
🎯 Bias: BULLISH - Strong Uptrend, MA Pullback Play
⏰ Timeframe: Day Trade / Swing
🛡️ Strategy: "THIEF LAYERING" - Multi-Level Limit Order Entry for Optimal Risk/Entry
📋 TRADE PLAN: THIEF'S LAYERED BULLISH PULLBACK
✅ CONDITION:
Bullish structure intact ✅
Price pulling back towards key Moving Average support ✅
This is a "Buy the Dip" setup for continuation.
🎯 ENTRY STRATEGY (THIEF LAYER METHOD):
Use MULTIPLE BUY LIMIT ORDERS to scale into the trade.
Suggested Layers (Adjust based on your capital):
➡️ Layer 1: 47,300
➡️ Layer 2: 47,400
➡️ Layer 3: 47,500
You can increase or decrease layers based on your own analysis.
⛔ STOP LOSS (THIEF OG's NOTE):
Initial SL: 47,200 (below key structure)
⚠️ IMPORTANT: Adjust your SL based on YOUR OWN RISK & STRATEGY. I am not responsible for your SL. Trade at your own risk.
🎯 TAKE PROFIT (ESCAPE THE POLICE BARRICADE!):
Primary Target: 48,100
This zone acts as strong resistance + overbought + potential trap.
Escape with profits before the "police" (sellers) arrive!
⚠️ NOTE: You can take partial profits earlier. This is YOUR choice - manage your own trade!
📊 RELATED PAIRS TO WATCH:
TVC:DXY (US Dollar Index): ⚠️ INVERSE CORRELATION
Strong TVC:DXY = Pressure on CAPITALCOM:US30 (typically).
Watch for DXY weakness to confirm bullish CAPITALCOM:US30 momentum.
SP:SPX (S&P 500) / NASDAQ:NDX (Nasdaq 100): ✅ POSITIVE CORRELATION
If SPX/NDX are strong, likely supports CAPITALCOM:US30 rally.
Weakness here may limit CAPITALCOM:US30 upside.
TVC:VIX (Volatility Index): ⚠️ FEAR GAUGE
Rising TVC:VIX = Risk-off mood, may cap equity gains.
Stable/Low TVC:VIX supports bullish move.
EUR/USD & GBP/USD: ⚠️ DOLLAR SENSITIVITY
USD pairs can signal broad USD strength/weakness, impacting PURPLETRADING:US30.
📌 KEY NOTES FOR THIEF OG's:
This is a LAYERED ENTRY strategy - patience is key.
Adjust ALL levels based on your account size & risk tolerance.
Watch related markets for confirmation or warning signs.
YOU are responsible for your trades - manage them actively!
👍 LIKE & FOLLOW if you find this useful!
🔔 TURN ON NOTIFICATIONS for more THIEF STRATEGY setups!
💬 COMMENT below with your adjustments or questions!
#TradingView #US30 #DowJones #TradingStrategy #DayTrade #Bullish #Pullback #StockMarket #TradingIdeas #CFD #IndexTrading #ThiefStrategy #LayerTrading
DowJones Bullish above support at 47530 Key Support and Resistance Levels
Resistance Level 1: 48132
Resistance Level 2: 48276
Resistance Level 3: 48420
Support Level 1: 47530
Support Level 2: 47366
Support Level 3: 47185
This communication is for informational purposes only and should not be viewed as any form of recommendation as to a particular course of action or as investment advice. It is not intended as an offer or solicitation for the purchase or sale of any financial instrument or as an official confirmation of any transaction. Opinions, estimates and assumptions expressed herein are made as of the date of this communication and are subject to change without notice. This communication has been prepared based upon information, including market prices, data and other information, believed to be reliable; however, Trade Nation does not warrant its completeness or accuracy. All market prices and market data contained in or attached to this communication are indicative and subject to change without notice.

Dow Jones (US30) a break of 47,759 will confirm downside momentu
The rally was sold in the dip was bought, resulting in a doji-style candle being posted at the high. This highlights investor indecision at current levels.
Big Picture analysis suggests we are currently trading within the BC leg of a Butterfly formation. This pattern will be invalidated on a move through the previous swing high of 48,460. Formation will be completed on a move to 43,946.
The trend of higher highs and the previous change of structure is located at 47,759.
It should be noted that the US2000 has just hit a 261.8% extension level
Conclusion: the value trade is to the downside. A break of 47,759 will confirm downside momentum. (edited)Friday, 5 December 2025 06:45

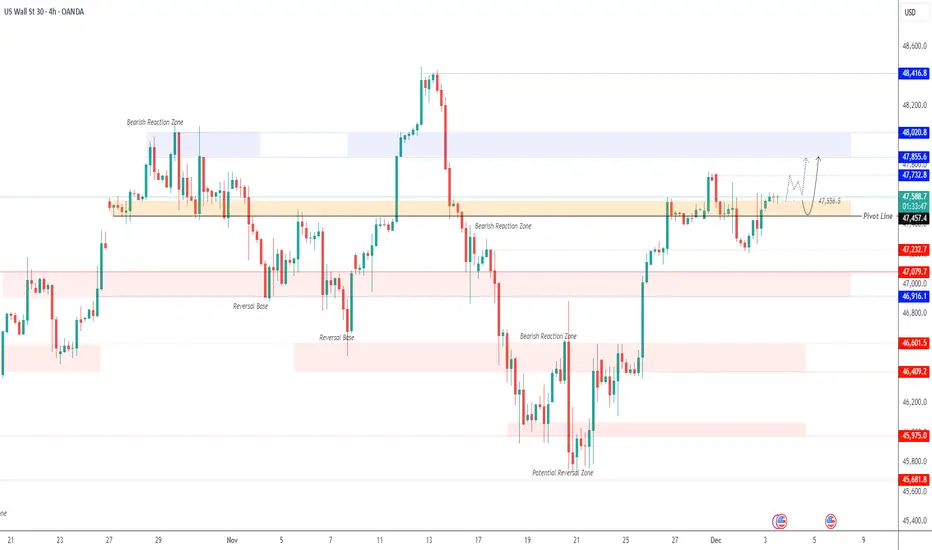
US30 – MARKET OUTLOOK | December Optimism Meets Key Data RisksUS30 (Dow Jones) – Technical Overview
The Dow Jones posted a modest gain on Tuesday, rising 185 points, as traders embraced a bit of December optimism. Even small upticks count in a holiday month—especially with markets looking for positive momentum amid mixed macro signals.
Volatility is expected to increase ahead of today’s ADP employment data, which may influence risk sentiment across equities.
Technical Analysis
US30 maintains bullish momentum while trading above 47560, with upside targets at 47720 and 47855.
A breakout above these resistance zones may extend the move toward 48020.
However, a 1H or 4H close below 47460 will shift momentum into a bearish correction, opening the way toward 47230 and 47100.
Pivot Line: 47560
Resistance: 47710 · 47860 · 48020
Support: 47460 · 47230 · 47100
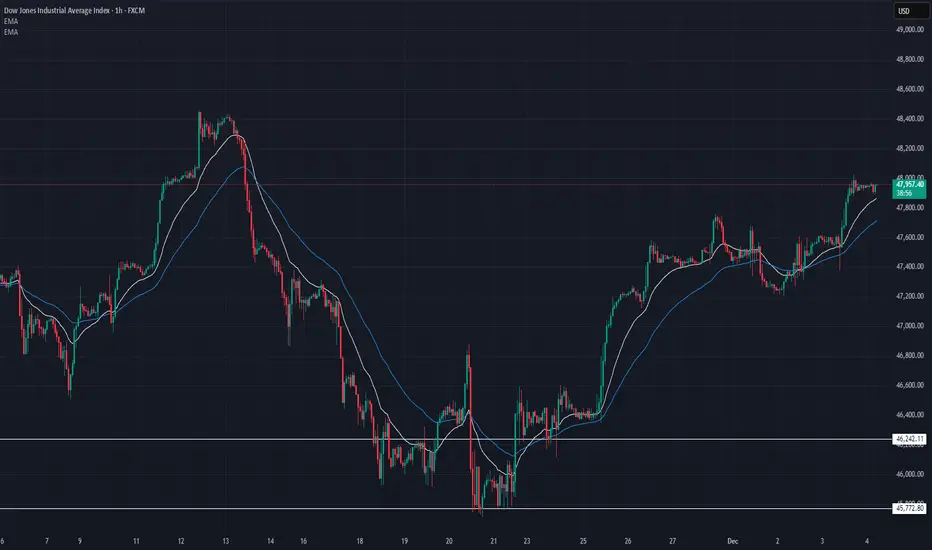
US30 Technical Breakdown – 12/04/2025📍 US30 Technical Breakdown – 12/04/2025
US30 pushed back into the 47,950–48,000 resistance zone after a clean trend continuation, with price now stalling near the highs. Bulls remain firmly in control as EMAs continue to slope upward, but momentum is slowing as we approach a major supply area 🔍📈.
📊 Market Behavior:
🔹 Strong push into 48,000 → buyers testing major resistance
🔹 EMAs wide + rising → bullish momentum still intact
🔹 Small consolidation forming → early signs of exhaustion
🔹 Higher lows consistently defended → bulls still holding structure
📌 Key Levels:
🔹 Resistance:
48,000 → major psychological level + current rejection
47,955 → intraday supply (current stall zone)
47,780 → key prior breakout level
🔹 Support:
47,720 → immediate intraday support
47,560 → secondary support / EMA zone
46,960 → deeper demand if trend breaks
🧠 Bias:
Bullish while above 47,720 📈
📈 Break & hold above 48,000 → continuation toward 48,200 → 48,350
📉 Break below 47,720 → opens path to 47,560 → 47,300
US30 - DOW Hits Major Supply Reversal coming on Dow as it hits a major supply zone. This is part of a bigger cross-asset move that I am anticipating across global equities. I see a synchronised sell off in global equities coming this month.

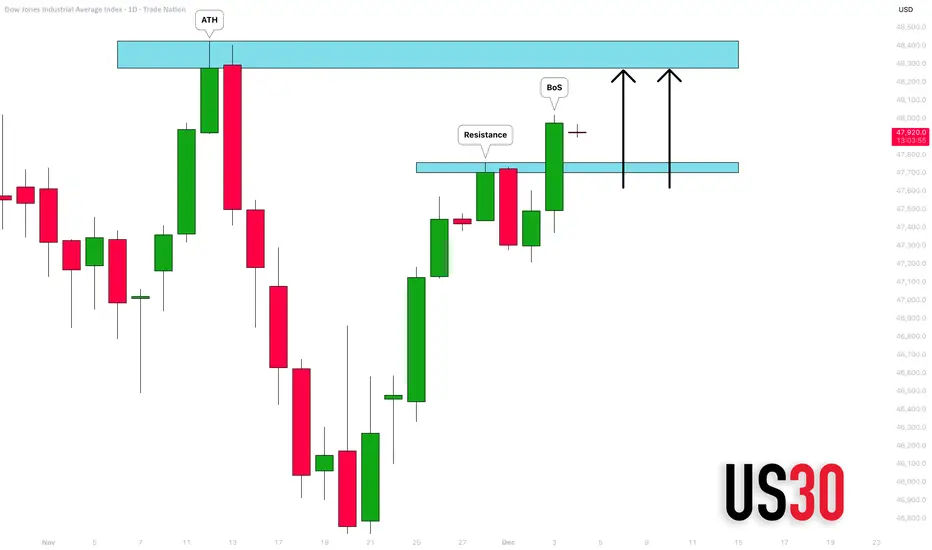
DOW JONES INDEX (US30): Confirmed BoS
With the yesterday's fundamental US news releases and
Trump's speech, US30 bounced strongly.
The market violated a significant daily resistance cluster
and closed above that.
It opens a potential for more growth to a resistance based
on a current All-Time High.
❤️Please, support my work with like, thank you!❤️
I am part of Trade Nation's Influencer program and receive a monthly fee for using their TradingView charts in my analysis.
US30 We see price rejecting and at the sametime confirming continuation to the bullish side to being bullish after the newly formed demand zone price failed to break below it. Which indicate the is is a strong demand zone.


US30 Trade Set Up Dec 3 2025Price failed to make a HH on the 1h, swept PDH and has reversed so i will look for internal 5m-15m bearish structure to target PDL

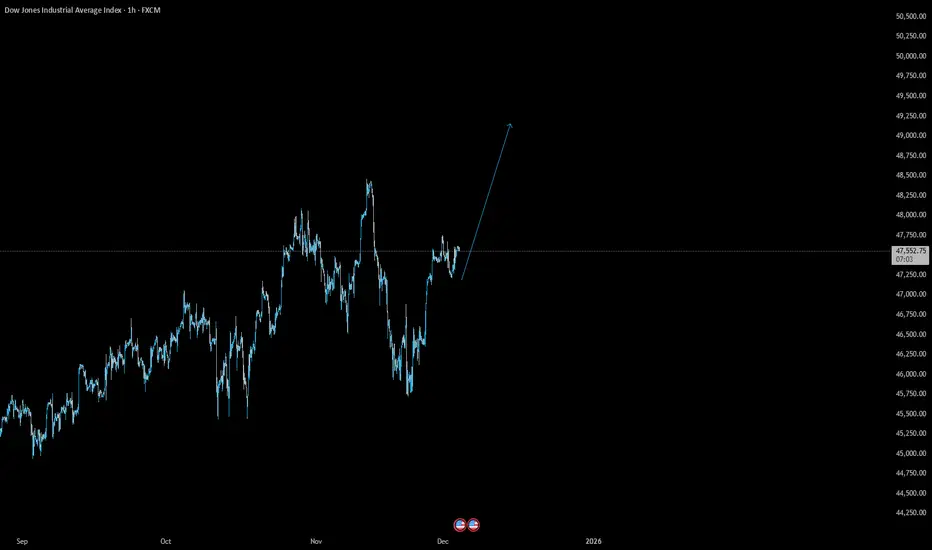
US30 about to make a new all time highWith FED officially ending the QT, US30 about to make a new all time high
US30 Sell AnalysisUS30 looks like it will be selling this week, I'm still looking for another entry for sell.

US30 Trade Set Up Dec 16 2025Price has respected a daily FVG multiple times and failed to sweep PDL followed by inverting a 1h FVG to then sweep Asia highs and fill a 1h bearish FVG so now i will want to see internal 1m-5m bullish structure to continue its uptrend to PDH

US30 Technical Breakdown – 12/16/2025📍 US30 Technical Breakdown – 12/16/2025
US30 aggressively rejected the 48,800–48,850 supply zone after a strong breakout rally, triggering a sharp pullback into the 48,300 area. While the higher-timeframe trend remains bullish, short-term momentum has shifted bearish as price slips below fast EMAs and sellers step in from premium levels 🔍📉.
📊 Market Behavior:
🔹 Strong rejection from 48,840 — clear sell-side response at HTF resistance
🔹 Sharp impulsive selloff → indicates distribution, not healthy pullback
🔹 EMAs rolling over → momentum cooling fast
🔹 Price consolidating below broken intraday structure
📌 Key Levels:
🔹 Resistance:
48,600 → intraday supply / EMA resistance
48,840 → major HTF rejection zone
49,000 → psychological + liquidity target if reclaimed
🔹 Support:
48,300 → immediate support (currently holding)
48,000 → psychological + demand zone
47,500 → major structural support from prior range
🧠 Bias:
Neutral-to-bearish below 48,600 📉
📉 Continued rejection under EMAs → rotation toward 48,000 → 47,500
📈 Reclaim & hold above 48,600 → bullish continuation toward 48,850–49,000

Big move down incoming this week I am looking red week becareful with longs 47452 next station
Good luck and safe trade


MARKET OPEN SELL IDEA US30 CAPITAL.COM CHARTMarket closed with a sell momentum. i would like to trade in that direction

Dow Jones Scenario Two: Holding 48,208 Opens the Path HigherAs mentioned in my previous post, in scenario two, the 48,208 level remains critical.
If this level holds and is not broken, the market should work its way toward the 50,000 area.
From a fundamental perspective, this scenario also appears more aligned with current conditions.
I’ll continue monitoring price behavior around this zone and update the structure as it develops.
We’re with you step by step, because the market is dynamic — and I’m not a magician.
I need to observe price behavior in real time to make accurate projections.

US30: Expecting Bearish Movement! Here is Why:
Balance of buyers and sellers on the US30 pair, that is best felt when all the timeframes are analyzed properly is shifting in favor of the sellers, therefore is it only natural that we go short on the pair.
Disclosure: I am part of Trade Nation's Influencer program and receive a monthly fee for using their TradingView charts in my analysis.
❤️ Please, support our work with like & comment! ❤️

US30 Will Move Lower! Short!
Please, check our technical outlook for US30.
Time Frame: 9h
Current Trend: Bearish
Sentiment: Overbought (based on 7-period RSI)
Forecast: Bearish
The price is testing a key resistance 48,497.6.
Taking into consideration the current market trend & overbought RSI, chances will be high to see a bearish movement to the downside at least to 47,110.8 level.
P.S
The term oversold refers to a condition where an asset has traded lower in price and has the potential for a price bounce.
Overbought refers to market scenarios where the instrument is traded considerably higher than its fair value. Overvaluation is caused by market sentiments when there is positive news.
Like and subscribe and comment my ideas if you enjoy them!
