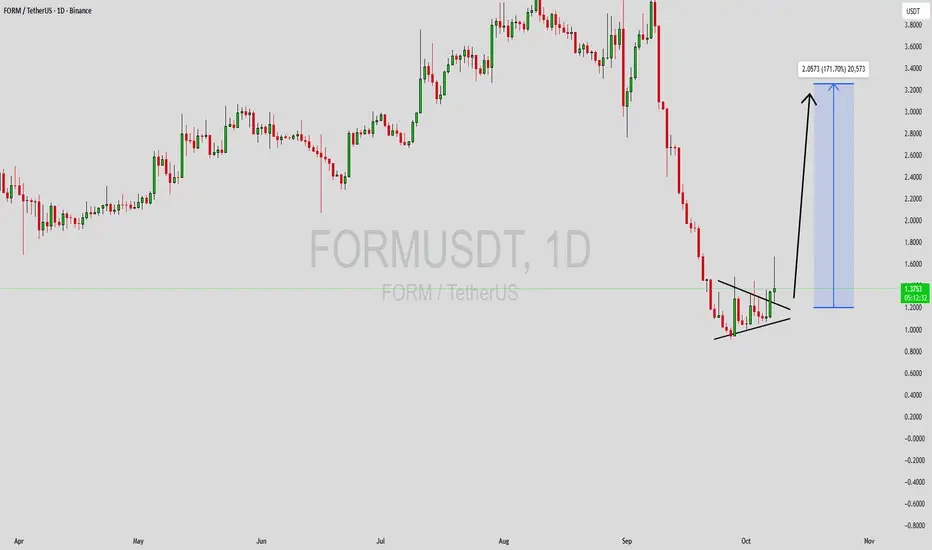
FORMUSDT Forming Falling WedgeFORMUSDT is displaying a powerful **falling wedge pattern**, a formation often recognized as one of the most reliable bullish reversal indicators in technical analysis. After a period of consolidation and gradual price compression, the pair seems ready to break out from this structure with increasin
FORMUSDT Forming Bullish PennantFORMUSDT is displaying a strong bullish pennant pattern on the chart — a continuation setup that typically forms after a significant upward move, followed by a brief consolidation before another potential rally. The current structure suggests that bulls are maintaining control while the price takes

FORM looks interesting after the dropThe FORM token has pulled back quite a bit but seems to be holding strong above the $0.90 level.
I believe it has potential to make a move up to around $3, though I’ll be satisfied closing the position once it reaches that target.
As always — everyone trades at their own risk.
I share my trades
FORMUSDT UPDATE#FORM
UPDATE
FORM Technical Setup
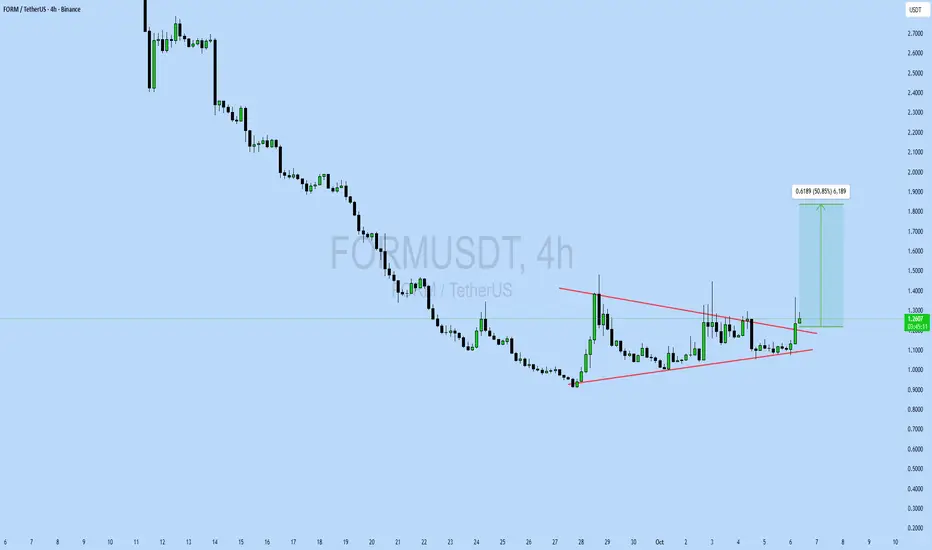
Pattern: Bullish falling wedge pattern
Current Price: $1.23
Target Price: $1.85
Target % Gain: 50.85%
NASDAQ:FORM is breaking out of a falling wedge pattern on the 4H timeframe. Current price is $1.23 with a target near $1.85, showing about 50% potential upside
FORM Market Update📊 NASDAQ:FORM Market Update
NASDAQ:FORM is testing the red resistance zone 🔴. If breakout occurs with confirmation, the first target will be the 🔵 blue line level 🎯.
Time for FORMUSDT. 55% potential profit, 2.60 $ targetOn the 4-hour chart, the FORM/USDT pair remains in a clear downtrend. Successive lower highs and lower lows indicate sustained selling pressure, and the price continues to trade below key moving averages. Both short- and long-term moving averages are sloping downward, reinforcing the bearish outlook

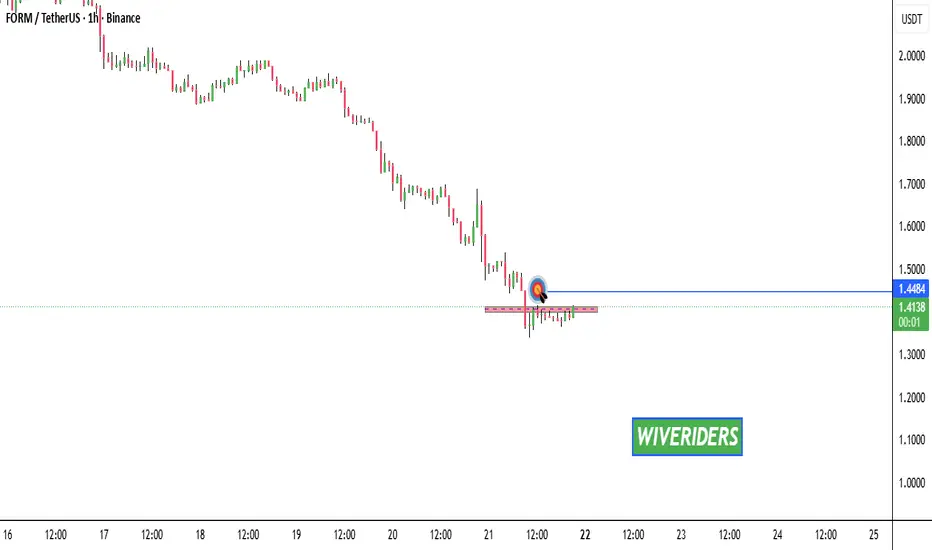
FORMUSDT.PLets see the MOVE at our price level. We need a strong volume and candle pattern confirmation to enter in the trade.
Lets wait and watch.
Please keep following me need your support.
Check my previous analysis too.

$FORM: Charge Into the Bull Run!BINANCE:FORMUSDT
NASDAQ:FORM : Charge Into the Bull Run!
Indicator Analysis: RSI
The Relative Strength Index (RSI, period likely 14 based on standard settings) is plotted below the price chart in blue. It measures momentum on a scale of 0-100, with levels above 70 indicating overbought conditio
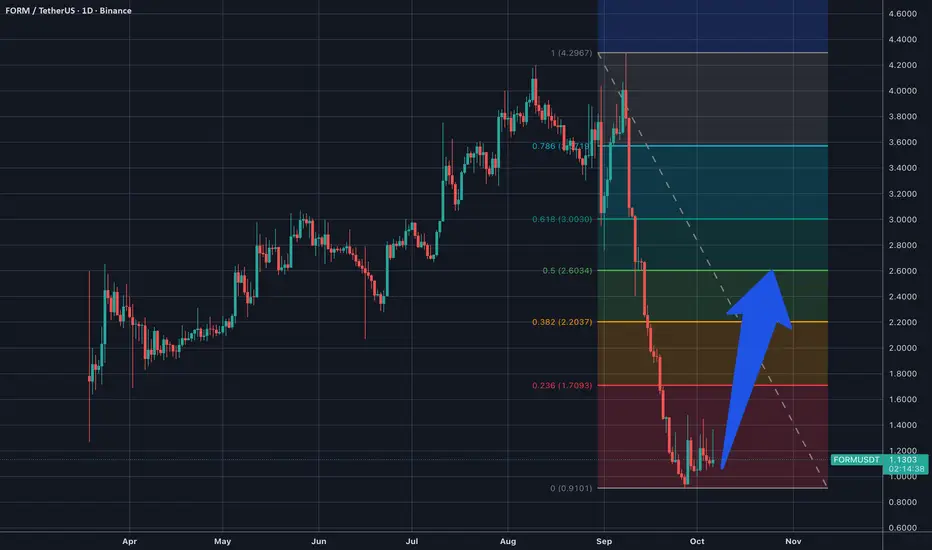
Technical and Fundamental Analysis of Form/USDT: Projected GrowtExecutive Summary
Formation FI (FORM) is positioned for significant near-term growth, with strong technical and fundamental indicators suggesting a potential price increase from the current $3 level to $5.5. This represents a potential gain of approximately 83% based on current market conditions an

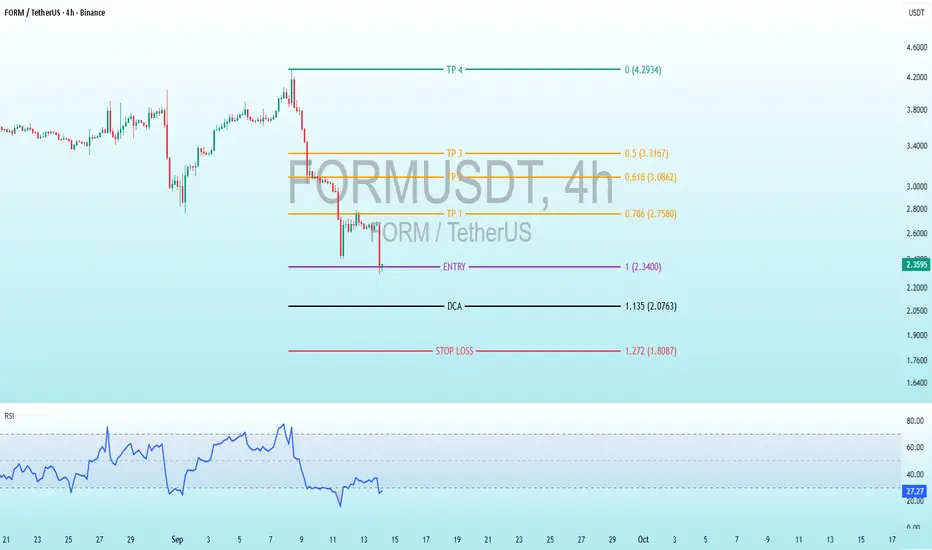
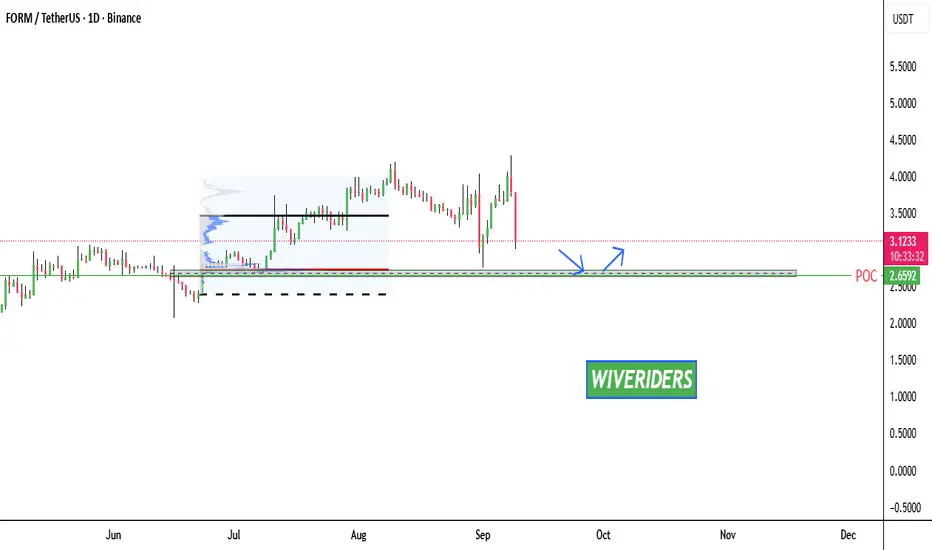
$FORM Trading UpdateNASDAQ:FORM Trading Update
NASDAQ:FORM is approaching the green support zone around 2.6592, which lines up with the POC and strong volume accumulation. This area has previously shown strong buyer interest, and a bounce from here is possible.
If bulls step in, price could push higher again — but
See all ideas
Summarizing what the indicators are suggesting.
Oscillators
Neutral
SellBuy
Strong sellStrong buy
Strong sellSellNeutralBuyStrong buy
Oscillators
Neutral
SellBuy
Strong sellStrong buy
Strong sellSellNeutralBuyStrong buy
Summary
Neutral
SellBuy
Strong sellStrong buy
Strong sellSellNeutralBuyStrong buy
Summary
Neutral
SellBuy
Strong sellStrong buy
Strong sellSellNeutralBuyStrong buy
Summary
Neutral
SellBuy
Strong sellStrong buy
Strong sellSellNeutralBuyStrong buy
Moving Averages
Neutral
SellBuy
Strong sellStrong buy
Strong sellSellNeutralBuyStrong buy
Moving Averages
Neutral
SellBuy
Strong sellStrong buy
Strong sellSellNeutralBuyStrong buy