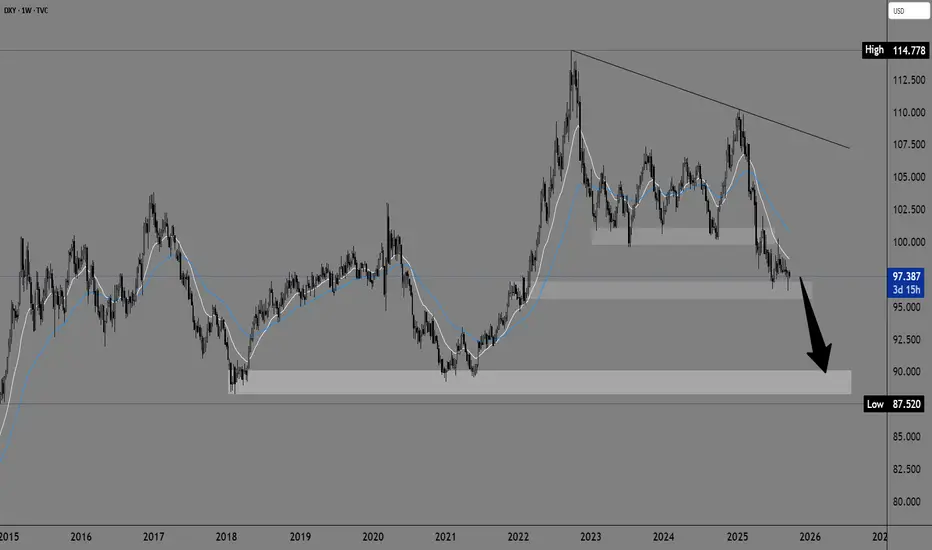
Dollar index on the bearish sideCould the dollar index slip below 95.00? The chances of such a thing are increasing. The pressure is slowly moving into that zone, we just need a stronger bearish impulse to start the process. A large support zone at the 90.00 level.
USDX trade ideas
DXY ANALYSIS 1H , Trade Idea (For Study Purposes Only)
Sell Zone: 97.45 – 97.60
Target: 97.05 – 97.00
Stop Loss: Above 97.65
RR: ~1:2
---

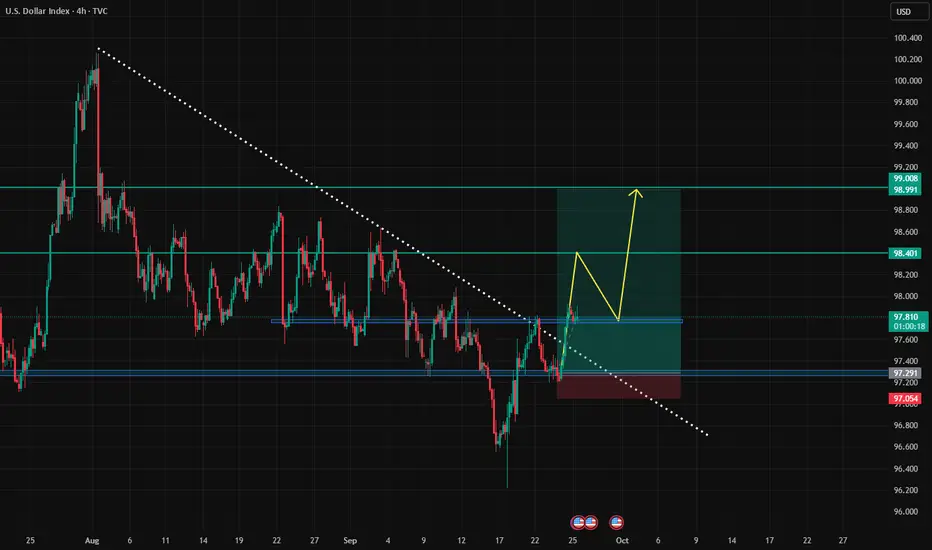
head and shoulder the dxy form the reverse head ans shoulder,its possible the dxy make low and continue to grow up.the fondamental analysis push in this direction.

DXY Dollar Heist: Can You Escape @100?🔥 DXY Dollar Index Bank Heist Plan (Swing Trade) 🔥
Asset: DXY Dollar Index 💵Plan: Bullish 📈Thief Trading Style: Layered Limit Order Strategy 🕵️♂️
🏦 The Heist Plan 🏦
Dear Thief OG's, Ladies & Gentlemen, get ready to pull off the ultimate DXY heist! 💰 We're using the Thief Layering Strategy to stack multiple limit orders and maximize our loot. Follow the plan, adjust to your risk, and let’s escape with the cash! 🚨
📈 Entry: The Break-In
Strategy: Deploy multiple buy limit orders to layer your entries like a master thief 🕴️. Suggested levels:
98.00 💸
98.20 💸
98.40 💸
98.60 💸
Flexibility: Add more layers based on your risk appetite or market conditions 📊.
Pro Tip: Set an alert on TradingView to catch the breakout or pullback at these levels 🚨.
🛑 Stop Loss: The Escape Route
Thief SL: Set at 97.50 to protect your stash 🛡️.
Risk Management: Adjust SL based on your lot size, risk tolerance, and number of layered entries ⚖️.
Warning: Don’t get caught! This is a high-stakes heist—stick to your risk plan 🔥.
🎯 Target: The Getaway
Police Barricade: Resistance at 100.30 🚓—watch out!
Our Target: Take profits at 100.00 to escape with the loot before the market traps you 🏃♂️💨.
🧠 Why This Heist?
The DXY is showing bullish momentum based on real-time market data 📡:
Macro Factors: Strong USD demand driven by economic indicators (check COT reports, geopolitics, and intermarket analysis) 🌍.
Technical Setup: Layered entries align with swing trade pullbacks and key support zones 📉.
Scalpers 👀: Stick to quick long-side trades with trailing SL to lock in profits 💰.
⚠️ Trading Alerts: Stay Sharp!
News Releases: Avoid new trades during high-impact news to dodge volatility traps 🚫.
Position Management: Use trailing stop-loss to secure your profits and stay safe 🛡️.
💪 Boost the Heist!
Hit the Boost Button to power up our Thief Trading Style! 🚀 Every like and view strengthens our crew, helping us rob the market with precision. Let’s make money and vanish like pros! 🤑
Stay tuned for the next heist plan, Thief OG’s! 🕵️♂️🎉

DXYDXY is in correction and can give us some more sideways before any push up.
Disclosure: We are part of Trade Nation's Influencer program and receive a monthly fee for using their TradingView charts in our analysis.

DXY | Boxed In Between 96.60 & 97.20 – Powell Holds the KeyThe dollar softened in line with expectations, shrugging off hawkish Fed remarks. With DXY caught between 96.60 support and 97.20 resistance, Powell’s speech tonight could set the tone—further downside if dovish, or consolidation if steady.

Bearish drop off?The US Dollar Index (DXY) has rejected off the pivot and could drop to the 1st support.
Pivot: 97.85
1st Support: 96.61
1st Resistance: 98.70
Disclaimer:
The above opinions given constitute general market commentary, and do not constitute the opinion or advice of IC Markets or any form of personal or investment advice.
Any opinions, news, research, analyses, prices, other information, or links to third-party sites contained on this website are provided on an "as-is" basis, are intended only to be informative, is not an advice nor a recommendation, nor research, or a record of our trading prices, or an offer of, or solicitation for a transaction in any financial instrument and thus should not be treated as such. The information provided does not involve any specific investment objectives, financial situation and needs of any specific person who may receive it. Please be aware, that past performance is not a reliable indicator of future performance and/or results. Past Performance or Forward-looking scenarios based upon the reasonable beliefs of the third-party provider are not a guarantee of future performance. Actual results may differ materially from those anticipated in forward-looking or past performance statements. IC Markets makes no representation or warranty and assumes no liability as to the accuracy or completeness of the information provided, nor any loss arising from any investment based on a recommendation, forecast or any information supplied by any third-party.


DXY: The Market Is Looking Down! Short!
My dear friends,
Today we will analyse DXY together☺️
The recent price action suggests a shift in mid-term momentum. A break below the current local range around 97.434 will confirm the new direction downwards with the target being the next key level of 97.299 and a reconvened placement of a stop-loss beyond the range.
❤️Sending you lots of Love and Hugs❤️

Dollar Headed Higher?Looking at the price of the dollar from a daily perspective, we can see that price accumulated for about 3 full trading weeks. Manipulation took place soon after, followed by 3 strong bullish candles.
Now that bulls have entered the market after the manipulation, I fully expect the distribution to take place after retesting the bullish FVG.
Since this is the dollar we're talking about, this price movement will most likely affect the price of other assets including Gold and dollar pairs.
Targeting the daily POI/Medium BSL.

DxyI want to see dxy to drop in price till mid of this week, in order to activate sell bias in most of Usd major pair and some cryptos

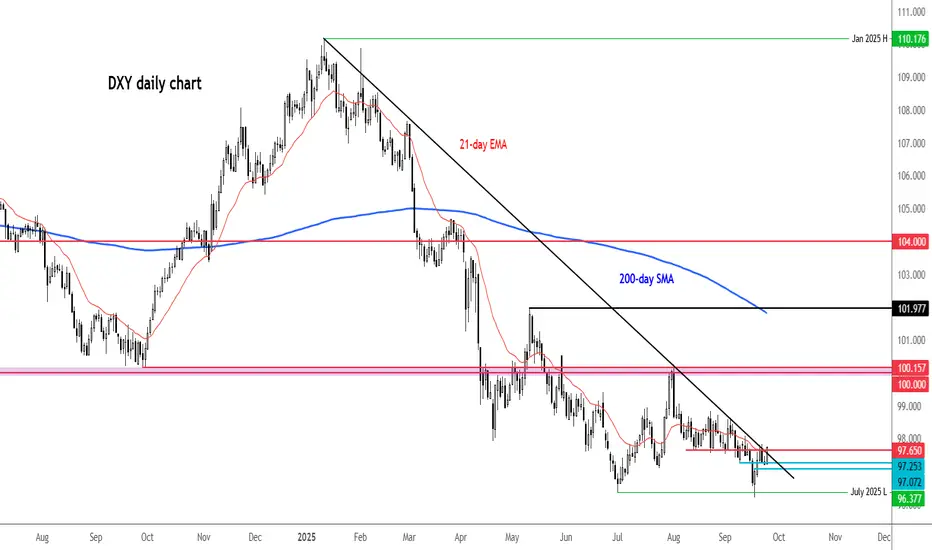
DXY testing trend resistance after Powell comments
The dollar clawed back some ground after Jerome Powell’s latest remarks, but I’m not convinced this bounce has legs. With the Fed now leaning dovish, the bias still favours more downside unless we see consistent cracks in the jobs market to justify the two cuts priced in for 2025.
Powell reiterated on Tuesday that inflation risks are skewed higher while employment risks are tilted lower, adding: “Two-sided risks mean there is no risk-free path.” Translation: he’s keeping his options open ahead of the October meeting. Fed chatter will remain front and centre, with Mary Daly up later today, jobless claims tomorrow, and the key PCE inflation reading on Friday.
The dollar index is now testing resistance around 97.60–97.80 area — a confluence of the 21-day EMA, broken support, and a trendline. Until this area breaks, it’s hard to get bullish. The broader picture of lower highs and lows still screams corrective.
By Fawad Razaqzada, market analyst with FOREX.com
DXY(Dollar Index Currency)We looking for a bullish momentum to the upside as the market has created a continuation to the upside resulting buying opportunities| 4H Timeframe

Dollar Faces Major Golden Ratio CorrectionRecent GDP data puts the dollar into uptrend(rise from 3.3% to 3.8% ) reaching around 98.7 and hit a Major Fibonacci 0.618 Correction and Multi-month highs.
The Dollar can be expected to correct at the 0.5 ratio (around 97 ) of the recent trend along with the trendline. If the dollar sentiment is to follow the rate cuts, we will see the dollar to the downside and stocks, crypto and commodities to the upside.
The Fed has recently announce a possibility of two more rate cuts happening this year Q4 of 2025. The cut is stays at 25 bps rather than the expected 50 bps . Some investors say it is not enough to bring positivity to the market.
Traders, what are your thoughts?

DXY SELL PROJECTIONDXY (Daily Outlook) – Sell Projection
The U.S. Dollar Index (DXY) has been showing signs of exhaustion after its recent upward move, and price action suggests that a potential correction could be on the horizon. I am closely watching the 98.000 supply zone, which stands out as a critical resistance level on the daily timeframe.
Should price retrace into this zone and show signs of rejection — such as bearish candlestick patterns or a shift in market structure — it would present a strong case for sellers to regain control. A sell from this region could set the stage for renewed downside momentum in the coming sessions.
For traders, this projection carries important cross-market implications: if the dollar weakens from the 98.000 level, we can expect XXX/USD pairs to gain more buying power, particularly around the midweek trading period. This would likely support bullish opportunities in major USD counterparts such as EURUSD, GBPUSD, and potentially gold (XAUUSD).
In short, patience and confirmation are key — waiting for DXY to tap into the supply zone and react will provide higher probability setups across USD-related pairs.

DXY - FROM THE WEEKLY CHART TO THE H4 CHART - WHAT TO EXPECTThe DXY Index has been going up since Jerome Powell speech after FOMC on 17 September 2025 and has continued its bullish trend since then, looking at the weekly chart this may be headind to an important resistance in the 101.395 area if the index succesfully breaks the 100.040 level of resistance, data will dictate its next move
I expect the index to test the 97.700 - 97.500 level of support early in the week and raise gradually to 100.040
Once there we have the following options:
- Poor usd data = selloff of the index on the way to the previous lows
- Strong usd data = break of the 100.040 level of resistance and the index reaching the weekly resistance 101.395
BE REACTIVE AND NOT PREDICTIVE

WEEKLY MARKET ANALYSIS-DXY, BTC,ETH, NAS100,SPX,XAU,XAGThis weekend's analysis will cover the Dollar Index, Bitcoin, Ethereum, NAS100, SPX500, Gold and Silver.
The DXY has found a strong support on both the monthly and daily charts. DXY has officially also broken it's weekly closing resistance level and I think a shift in momentum will propel DXY up higher in the next week towards a target zone of 99 to 99.600.
Bitcoin is still in a correction and currently paused on the weekly 21 EMA, I think it's consolidating sideways and will continue selling to the intended target of $102k in the coming week.
ETH nicely came to the previous resistance and seems to find some buyers there but there is no momentum or RSI strength to support an upward move, so I am bearish on ETH and think the price will fall some more into the target zone below $3,823.
NAS100 and SPX500 are also looking quite over stretch on it's Bollinger Bands and KC channels on the weekly charts, with weekly bearish candles suggesting a pullback in the equities is very likely in the next coming week.
Gold and Silver are in a strong uptrend and the uptrend will continue but I see profit taking on the charts. I expect some sideways consolidation and a minor pullback before the bullish continuation.
I thank you for listening to my publications and I wish you a great trading week. Cheers everybody!!

DXY Breakout Trade Setup – Bullish Channel & High R:R OpportunitChart Overview:
Instrument: U.S. Dollar Currency Index (DXY)
Timeframe: 1 Hour (1H)
Current Price: 98.371
Analysis Date: September 26, 2025
🔍 Technical Structure:
1. Bullish Channel:
A clear ascending channel is drawn, indicating a strong short-term uptrend.
Price action has been respecting the channel well, moving between the upper and lower trendlines.
A bullish breakout is either anticipated or just confirmed above the channel.
🟦 Trade Setup (Long Position):
✅ Entry Point:
Price: 98.267 (blue horizontal line labeled "Entry Point")
This is slightly below the current price (98.371), suggesting an entry on a slight pullback after breakout.
🛑 Stop Loss:
Price: 97.986 (also marked 97.982 on the lower blue line)
Located below a recent support zone and below the breakout structure.
This gives a safety buffer if the breakout fails.
🎯 Target Point (Take Profit):
Price: 99.676
This is based on the measured move from the height of the channel, projected upward from the breakout point.
📐 Risk-to-Reward Ratio (RRR):
Very favorable; visually it appears to be around 4:1 or higher.
Small stop loss area (red box) relative to the large target area (green box).
High RRR makes this setup attractive for risk-managed traders.
🔎 Additional Observations:
Trend: Strong bullish momentum leading into the breakout.
Volume / Confirmation: Not shown on the chart, but ideally you’d want volume confirmation for the breakout.
Timing: Entry and confirmation should align with break and retest of the channel top.
✅ Summary of the Trade Plan:
Component Value
Entry 98.267
Stop Loss 97.986
Take Profit 99.676
Risk-Reward ~4:1
Trade Type Long (Buy)
Strategy Breakout + Retest
⚠️ Important Notes:
Wait for confirmation (like a bullish candle close above the channel or successful retest).
Be aware of macroeconomic news that can affect DXY (e.g., Fed announcements, interest rate decisions, inflation data).
Use position sizing appropriate to your risk tolerance.

USD INDEX (DXY) BiasAm externally bullish on this guy, But price have just approached 4hr OB and resistance area
Am anticipating for a short term sells at arrowed levels before having a potential bullish PA

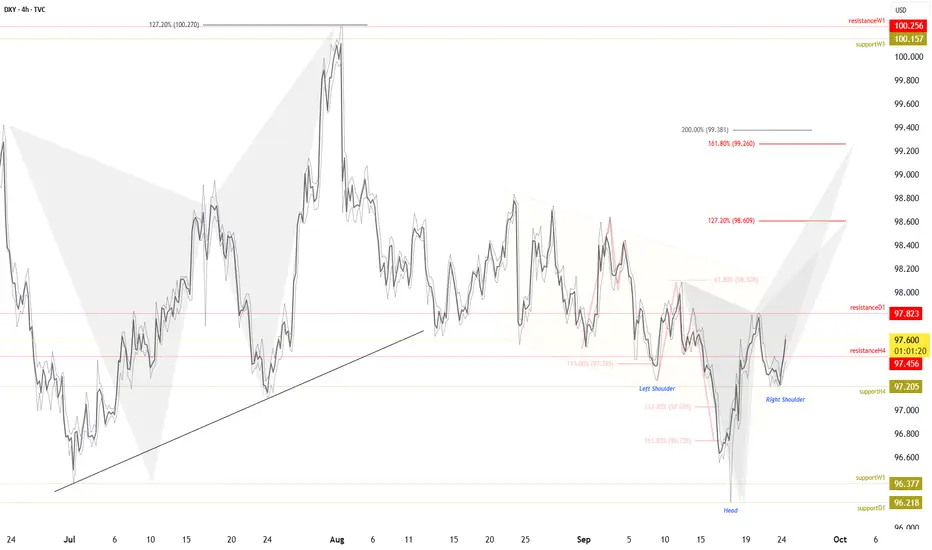
DXY – Potential Inverted Head & Shoulders FormationTVC:DXY
The DXY is currently consolidating in a way that suggests the development of an inverted head and shoulders pattern. We have support distributed between $96.37 and $96.21 , creating a potential base for this pattern. On the upside, the recent breakout through $97.45 highlights bullish intent, with the next critical level being the daily fractal resistance at $97.82 , which acts as the neckline .
Breakout Implications
A confirmed break and close above $97.82 would validate the pattern and shift momentum toward higher targets. If this scenario plays out, extension levels become the next logical zones of interest:
127% Fibonacci extension: $98.60 - bearish butterfly pattern
161.8% Fibonacci extension: $99.26 - bearish crab pattern
200% Fibonacci extension: $99.38 - H&S default target
Risk Factors & Harmonic Patterns
While the bullish case is clear above $97.82 , caution is warranted. Harmonic patterns may begin to take shape around $98.60 and $99.26 , which often serve as areas of exhaustion or reversal. These zones could lead to temporary pullbacks, and in a broader context, may even reassert the prevailing downtrend seen in recent months.
Key Takeaway
The confirmation or rejection of the $97.82 neckline will be pivotal in defining the next directional phase for the DXY. We should monitor price behavior carefully at each Fibonacci extension, balancing the potential for continuation against the risk of harmonic-driven reversals.
Safe Trades,
André Cardoso
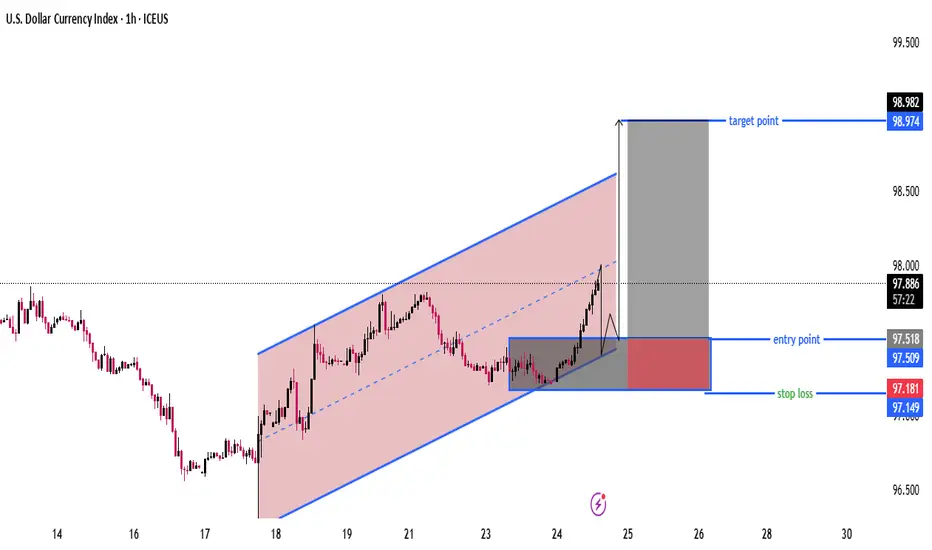
DXY Bullish Channel Setup with 1:4.5 RRR (Entry 97.50 → Target 9Chart Analysis
Trend:
Price is moving inside a rising parallel channel (marked in red with blue borders).
Currently near the mid-to-upper side of the channel.
Setup Highlighted:
Entry Point: Around 97.50 – 97.52 (support zone).
Stop Loss: Around 97.15 – 97.18 (below support and channel bottom).
Target Point: Around 98.97 – 98.98 (near channel top).
Risk-to-Reward Ratio (RRR):
Risk: ~0.33 points (97.50 → 97.18).
Reward: ~1.46 points (97.50 → 98.98).
RRR ≈ 1:4.5, which is a strong setup.
Price Action:
The chart suggests a retest of support (97.50 area) before a bullish continuation.
If buyers hold this level, upward momentum could push toward the 98.90–99.00 zone.
Invalidation:
A breakdown below 97.15 would invalidate the long setup and may push price toward 96.80 – 96.50 support levels.
📌 Summary
Bias: Bullish (as long as price holds above 97.15).
Plan: Wait for a pullback to the entry zone (97.50) for confirmation.
Target: 98.90 – 99.00.
Stop Loss: Below 97.15.
Strong RRR trade idea within the bullish channel.
Bearish drop?The US Dollar Index (DXY) is reacting off the pivot which aligns with the 61.8% Fibonacci retracement and could drop to the 1st support which acts as a multi-swing low support.
Pivot: 98.63
1st Support: 96.61
1st Resistance: 100.19
Disclaimer:
The above opinions given constitute general market commentary, and do not constitute the opinion or advice of IC Markets or any form of personal or investment advice.
Any opinions, news, research, analyses, prices, other information, or links to third-party sites contained on this website are provided on an "as-is" basis, are intended only to be informative, is not an advice nor a recommendation, nor research, or a record of our trading prices, or an offer of, or solicitation for a transaction in any financial instrument and thus should not be treated as such. The information provided does not involve any specific investment objectives, financial situation and needs of any specific person who may receive it. Please be aware, that past performance is not a reliable indicator of future performance and/or results. Past Performance or Forward-looking scenarios based upon the reasonable beliefs of the third-party provider are not a guarantee of future performance. Actual results may differ materially from those anticipated in forward-looking or past performance statements. IC Markets makes no representation or warranty and assumes no liability as to the accuracy or completeness of the information provided, nor any loss arising from any investment based on a recommendation, forecast or any information supplied by any third-party.

Dollar Finds Support Ahead of U.S. Data and GDP; SNB Leaves RateDollar Finds Support Ahead of U.S. Data and GDP; SNB Leaves Rates Unchanged
The U.S. dollar stayed strong this week as traders waited for important U.S. jobless claims and GDP numbers that could guide the Federal Reserve’s next decision.
On Thursday morning, the Dollar Index traded near 97.55 after touching a two-week high on Wednesday. The move came after Fed Chair Jerome Powell said the central bank faces a “challenging situation” as it tries to balance high inflation with a weak job market.
Key U.S. Data in Focus
Jobless claims due later today are expected to show around 230k, suggesting the labor market is still strong.
GDP figures and PCE inflation data later this week will give more signals about economic strength.
Several Fed officials are also speaking this week, which could move markets.
Analysts say if jobless claims remain low, the dollar could get stronger because it means the Fed may delay more rate cuts.
Europe and Switzerland
In Europe, EUR/USD stayed flat near 1.1738. Analysts warn a fall below 1.1725 could push the pair down toward 1.1660.
The Swiss National Bank (SNB) kept its interest rate at zero, stopping a series of seven straight cuts. After the news, USD/CHF edged up to 0.7958.
Asia Updates
USD/JPY slipped 0.1% to 148.69 after strong gains the previous day.
BoJ minutes showed some members want to consider raising rates in the future.
AUD/USD rose 0.2% to 0.6592 after Australian inflation came in higher than expected.
Outlook
The dollar remains supported as traders balance U.S. economic strength with Fed policy expectations. For now, the focus is on today’s jobless claims and GDP data, which could set the next move for the dollar.
✍️ By Md Golam Rabbani