DXY - Busy Week Ahead!Monday 20th: 3 Gold Folders
Tuesday 21st: 5 Gold Folders, 4 Red
Wednesday 22nd: 5 Gold, 5 Red
Thursday 23rd: 3 Gold, 9 Red
Friday 24th: 6 Gold, 2 Red
Many will cry themselves to sleep as stops get triggered on both sides as this week is a HECTIC week!
USDX trade ideas

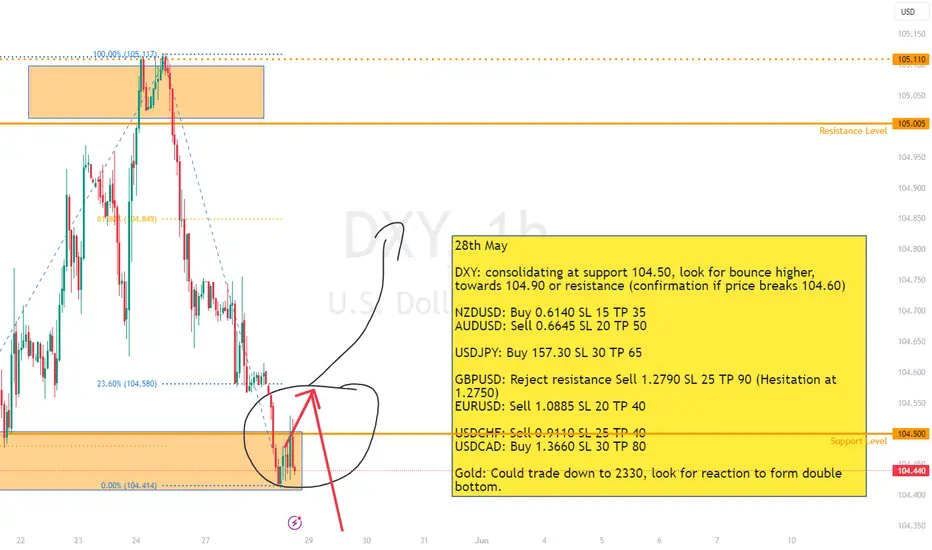
Levels discussed during livestream 28th May28th May
DXY: consolidating at support 104.50, look for bounce higher, towards 104.90 or resistance (confirmation if price breaks 104.60)
NZDUSD: Buy 0.6140 SL 15 TP 35
AUDUSD: Sell 0.6645 SL 20 TP 50
USDJPY: Buy 157.30 SL 30 TP 65
GBPUSD: Reject resistance Sell 1.2790 SL 25 TP 90 (Hesitation at 1.2750)
EURUSD: Sell 1.0885 SL 20 TP 40
USDCHF: Sell 0.9110 SL 25 TP 40
USDCAD: Buy 1.3660 SL 30 TP 80
Gold: Could trade down to 2330, look for reaction to form double bottom.
DXY - Are You Ready?📈Hello TradingView Family / Fellow Traders. This is Richard, also known as theSignalyst.
📉 DXY has been overall bullish trading within the rising channel marked in red.
Currently, it is undergoing a correction phase, and approaching the lower bound of the channel.
Moreover, it is retesting a strong demand zone highlighted in orange.
🏹 Thus, the highlighted blue circle is a strong area to look for buy setups as it is the intersection of the orange demand and lower red trendline.
📚 As per my trading style:
As #DXY is hovering around the blue circle zone, I will be looking for bullish reversal setups (like a double bottom pattern, trendline break , and so on...)
📚 Always follow your trading plan regarding entry, risk management, and trade management.
Good luck!
All Strategies Are Good; If Managed Properly!
~Rich

Fascinating junction for DXYWe can see DXY has again rejected off the falling daily trendline (green), last week we formed a bear candle and have broken out below, currently printing a third bear candle in a row (daily).
Even though US Data and narrative suggest higher for longer (and maybe even a hike, although I doubt that) the USD has not responded in kind.
We're approaching a couple of critical areas:
1. 104.3 - intersection of the rising weekly trendline (red)
2. 104.1 - supply zone
With the local trend bearish, more positivity coming out of Europe I think we could see DXY break through these barriers and ultimately retest the longer running monthly falling trendline (white).
We have a negative MACD and not yet oversold (Daily).
Of course, the US Economy is looking strong and the FED thinks they can afford to keep rates higher for longer, so any kind of a push up from here will see the daily fall line (green) broken and a new HH.
Will this be allowed to happen?
As always, I never trade DXY but it is critical to watch as dictates so many of the crosses next moves.


Dollar Index (DXY): Bearish Pressure Remains 💵
Looks like Dollar Index completed the correctional movement
and ready to go down again.
I see a bearish flag pattern with a confirmed violation of its support on 4H.
The market may reach 104.2 soon.
❤️Please, support my work with like, thank you!❤️

DOLLAR INDEX - BEARISH SCENARIO 📉Hello Traders !
On Wednesday 22 May, The Dollar Index reached a resistance level (105.123 - 104.915) and failed to break it!
Let's expect the bearish scenario:
If the price breaks and closes below the higher low
We will see a bearish move📉
-------------
TARGET: 104.210🎯

DXY will go down BTC pump expected ALL trading ideas have entry point + stop loss + take profit + Risk level.
hello Traders, here is the full analysis for this pair, let me know in the comment section below if you have any questions, the entry will be taken only if all rules of the strategies will be satisfied. I suggest you keep this pair on your watchlist and see if the rules of your strategy are satisfied. Please also refer to the Important Risk Notice linked below.
Disclaimer

DXY Will Go Down! Short!
Please, check our technical outlook for DXY.
Time Frame: 9h
Current Trend: Bearish
Sentiment: Overbought (based on 7-period RSI)
Forecast: Bearish
The market is approaching a significant resistance area 104.719.
Due to the fact that we see a positive bearish reaction from the underlined area, I strongly believe that sellers will manage to push the price all the way down to 104.038 level.
P.S
The term oversold refers to a condition where an asset has traded lower in price and has the potential for a price bounce.
Overbought refers to market scenarios where the instrument is traded considerably higher than its fair value. Overvaluation is caused by market sentiments when there is positive news.
Like and subscribe and comment my ideas if you enjoy them!

DXY bearish, has SHS patternDXY will bearish, has SHS pattern dan already retest.
Lets See
Happy Trading
Disclaimer On

Dollar Index: Price Action Favouring Bears The US dollar is poised to end the month lower against a basket of six major currencies. According to the US Dollar Index, the greenback is down -1.5% in May and on track to snap a four-month winning streak.
Technically speaking, the monthly timeframe presents little to work with this week (well, anything within touching distance that is). The 107.35 October 2023 peak remains a possible resistance, shadowed closely by another resistance level at 109.33 and a 100% projection ratio at 108.48. Below, support is at 99.67, accompanied by a 50-month simple moving average (SMA) at 99.53 and a moderate Fibonacci cluster from 98.72.
200-Day SMA Offers Logical Downside Target
Meanwhile, on the daily timeframe, Friday finished considerably lower after bumping heads with resistance at 105.04 and the 50-day SMA at 104.98. With the scope to explore deeper waters from here on the monthly scale, the 200-day SMA calls for attention as a logical downside support target of around 104.39. A break south of here unearths 103.62 support. Further supporting bearish flow is the inability of the Relative Strength Index (RSI) to find acceptance north of the 50.00 centreline last week (though it is worth bearing in mind that the RSI has maintained a position above the 50.00 centreline since 2022 on the monthly chart).
Looking ahead, the daily chart shows early signs of a downtrend (series of lower lows and lower highs), with Friday's reaction to the underside of resistance suggesting that dollar bears may maintain control, at least until the 200-day SMA. This dynamic value will be a crucial test for bears, considering the previous reaction observed in mid-May.
Short-term action on the H1 chart concluded the week sandwiched between ascending support, extended from the low of 104.39, and trendline support-turned potential resistance, drawn from the low of 104.08. Overhead, resistance calls for attention at 104.84 and 105.04 (daily resistance); lower, eyes might be drawn toward a moderate Fibonacci cluster from 104.47, plotted just north of the 200-day SMA.
This Week’s Direction?
Coupled with the monthly chart displaying limited support and Friday acknowledging daily resistance around 105.04 (accompanied by the current downtrend and the RSI shaking hands with the lower side of 50.00), this is a sellers’ market for the time being and price action on the H1 timeframe could defend the underside of the breached trendline support and push through H1 ascending support in the direction of the Fibonacci cluster at 104.47. However, were current trendline resistance to cede ground, H1 resistance at 104.80 could be the next port of call for sellers this week.

DXYThe dollar price looks bullish on the daily timeframe, moving within a symmetrical triangle and ascending channel, and following the Elliott Wave 12345 pattern. Currently, the price is at a resistance-turned-support level; waiting for a bullish rejection here could signal an upward move. This would positively impact XXXUSD pairs and negatively affect USDXXX pairs.

DXY STRUCTUREUsing correlation analysis DXY has a negative correlation with EURUSD, this is the inverse of EURUSD and we will sit on our hands and wait for this to play out before we can commit to the market, allow the market to commit to you before you commit to the market.

Dollar Loses Shine as US Economy Shows Signs of CoolingThe tide may be turning for the US dollar. After a period of strength, investors are growing less optimistic about the greenback as recent economic data suggests a slowdown in the US economy. This shift in sentiment is reflected in positioning data from the Commodity Futures Trading Commission (CFTC), which shows a net short position on the dollar for the first time in six weeks.
Signs of a Cooling US Economy
Several factors are contributing to the cooling sentiment on the dollar. Recent economic reports have indicated a potential slowdown in the US. Growth may be decelerating after a strong 2023, with factors like inflation and rising interest rates potentially impacting consumer spending and business investment.
The Federal Open Market Committee (FOMC) has embarked on a series of interest rate hikes to combat inflation. While these hikes are intended to curb inflation, they can also have a dampening effect on economic activity. Businesses may be hesitant to borrow and invest, and consumers may tighten their belts as borrowing costs rise.
CFTC Data Reveals Shift in Investor Positioning
The CFTC data provides valuable insights into investor sentiment on the foreign exchange market. The data tracks the net long or short positions held by leveraged funds, which include hedge funds and other large speculators, and asset managers.
According to the latest CFTC data, leveraged funds still held some net long positions on the dollar last week. However, this bullishness was outweighed by a significant increase in net short positions held by asset managers. This shift in positioning resulted in a combined net short position of $5.36 billion as of May 21st, compared to a net long position of $2.02 billion just a week earlier.
Market Implications of the Dollar's Decline
A weaker dollar can have several implications for the global economy. It can make US exports more competitive, as they become cheaper for foreign buyers. Conversely, imports into the US become more expensive. This can potentially lead to higher inflation in the US as the cost of imported goods increases.
A weaker dollar can also impact other currencies. If investors lose confidence in the US economy, they may seek refuge in other safe-haven assets, such as the Japanese yen or the Swiss franc. This could lead to a strengthening of these currencies relative to the dollar.
The Road Ahead: Volatility and Data Dependence
Analysts expect currency positioning to remain volatile in the near term. The direction of the dollar will likely hinge on incoming US economic data. Strong economic data could reignite bullish sentiment on the dollar, while further signs of a slowdown could exacerbate the recent decline.
The FOMC's monetary policy decisions will also be closely watched. If the Fed signals a more aggressive pace of rate hikes to combat inflation, the dollar could find support. However, if the Fed slows down the pace of hikes or even starts cutting rates in the future, as some analysts predict, the dollar could weaken further.
Conclusion
The recent decline in bullish sentiment on the dollar reflects growing concerns about the health of the US economy. The CFTC data highlights a shift in investor positioning, with a net short position emerging for the first time in six weeks. The future direction of the dollar remains uncertain and will depend on the trajectory of the US economy and the Fed's monetary policy decisions.

Have DXY gone bearish?Dxy have been going down hill in recent days, what look like a retracement now shaping up to be a continuation. I be looking for any 4 hr or 1 hr bearish fvg to trade off. That's means any US currency pair will be bullish.

Price can easily drop to the previous weeks lowsAlthough I was bullish in the last two weeks. But by re-analyzing COT data and price action. I think it will go lower now. Which is bullish for the XXXUSD pairs.
Always follow these rules
- Accumulation / Manipulation / Distribution
- No liquidity raid = No trade
- Never buy high and never sell low
“Adapt what is useful, reject what is useless, and add what is specifically your own.”
Dave FX Hunter ⚔

Which Fed speaker moves the market the most? We have another eventful week ahead with numerous Federal Reserve officials scheduled to speak publicly. Anecdotally, I seem to recall Mester and Kashkari are two of the most impactful speakers, and this week provides an excellent opportunity to see if this holds true. Kashkari recently left The Federal Open Market Committee (FOMC), so his impact might be lessened these days though.
Here is the lineup of Fed speakers for the week, in order of appearance:
Tuesday:
Loretta J. Mester
Neel Kashkari
Lisa D. Cook
Wednesday:
John C. Williams
Dr. Raphael W. Bostic
Thursday:
John C. Williams (second appearance)
Lorie K. Logan
Friday:
Dr. Raphael W. Bostic (second appearance)
Their speeches might offer valuable insights into the Fed's future actions and the overall economic outlook. It seems that these speeches can occasionally be more impactful than major Fed decision days. It's almost as if the market perceives these talks as a glimpse behind the curtain, potentially providing an insider perspective that may be less tightly controlled than those of Fed Chair Jerome Powell.

Viper Memorial Day Weekly update Our weekly market breakdown holiday special! We break down why holiday weekends it's good to turn the markets off and enjoy your long weekend. Then we break down the upcoming week. We cover DXy, US30, Gold and of course our gold idea GBPJPY enjoy!!!

USD INDEX (DXY) Weekly Forex Forecast... BEARISH!Bias is Bearish.
Looking for price to close below 104.00, forming -FVGs along the way.

Is King Dollar poised for a flush ?Possible H&S formation on the DXY.
These formations do not always work out....
But interesting to watch since it would have profound implications on Crypto Assets and Prescious Metals Mining companies....
I am bullish on all the above, especially on PM since the Gold / Silver ratio recently had a major break down.

Bearish DXYMonthly:
1. Direction:
Bearish
2. Reasons:
1. price is respecting OB.
2. A good Displacement
Weekly:
1. Direction:
Bearish
2. Reasons:
1. Price disrespected Bullish FVG
2. BOS with massive displacement
3. price is moving from ERL to IRL
Daily:
1. Direction:
Bearish
2. Reasons:
1. bearish orderflow
2. Respected the daily FVG
3. Good displacement
4H:
1. Direction:
Bearish
2. Reasons:
1. MMSM formation
2. FVG formations
3. BOS with displacement

DOLLAR BULLISH???!!!!! Dollar retested from the Day Trendline1.According to my view dollar reached its Target and retested from Day Trendline Liquidity and the Support Zone.
2.If its broke the Resistance and upper Trendline then it'll reach the major resistance zone.
3.If Dollar broke the current support zone then it'll reach the next support around 103.000.
4.Day 200 EMA retested well.

Dxy is ready to dump!DXY is bearish.
●On HTF weekly FVG/BISI disrespected and now become an Invesion Fvg which should act as resistance.
●On Daily timeframe DXY got a rejection from The Daily +OB.
●In 4h Dcy created FVG which should bring Dxy down.
●Downside targets for DXY are 104.080 and 103.880 for now.
●Dxy should stay bearishso that other markets like stock, Crypto and Forex should see higher prices.
