3rd August 2025 Daily Analysis For DxyDAILY DXY ANALYSIS FOR 3RD AUGUST 2025. Looking to see this setup play out completely on DXY . Will be focused on selling Gu and EU when the DXY setup start playing out
USDX trade ideas

DXY Analysis todayHello traders, this is a complete multiple timeframe analysis of this pair. We see could find significant trading opportunities as per analysis upon price action confirmation we may take this trade. Smash the like button if you find value in this analysis and drop a comment if you have any questions or let me know which pair to cover in my next analysis.

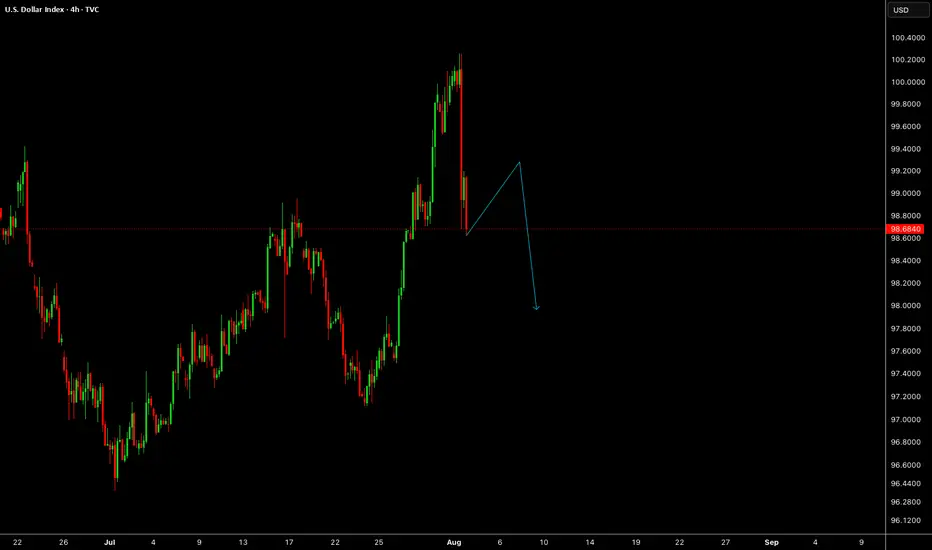
DXYDXY has given us a drop last week, lets wait for a correction to trade another drop.
Disclosure: We are part of Trade Nation's Influencer program and receive a monthly fee for using their TradingView charts in our analysis.
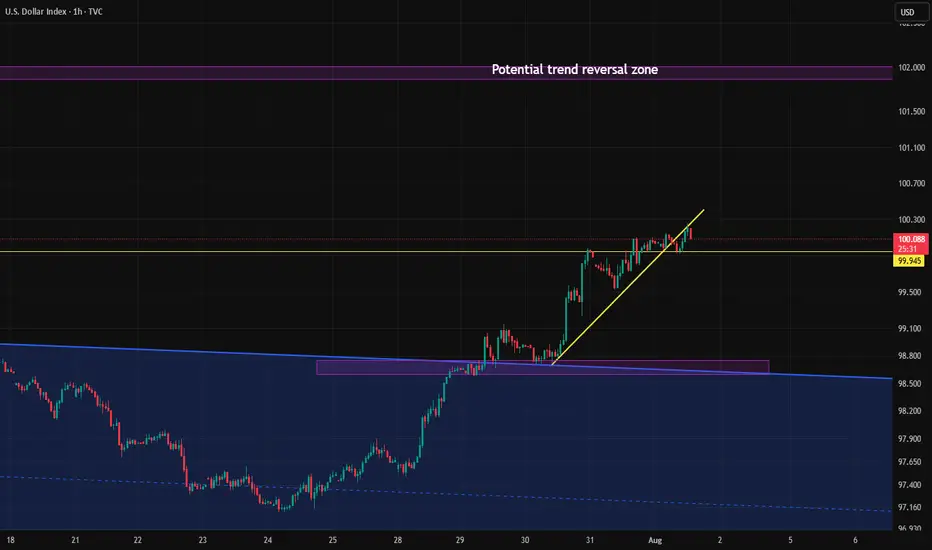
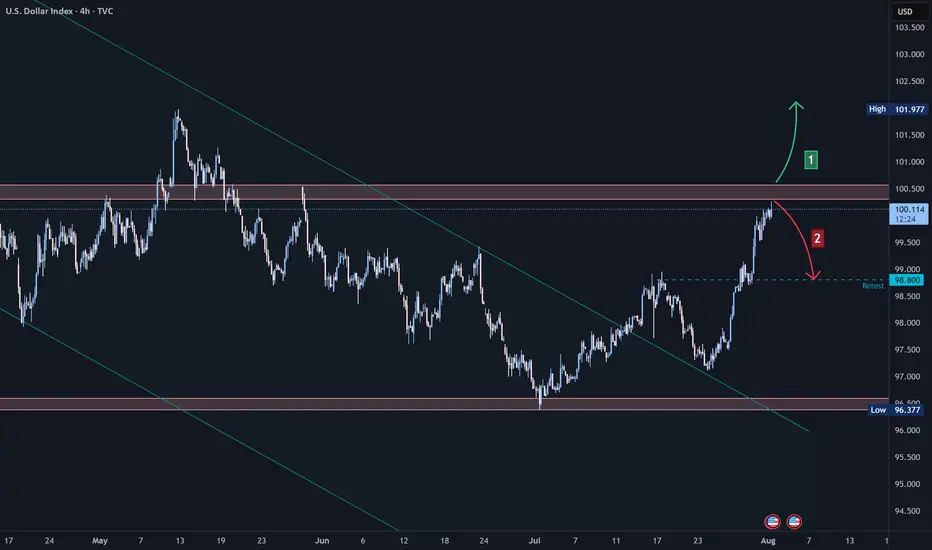
DXY for this week Technical Analysis – Inverse Head & Shoulders with Neckline Retest
Current Market Situation
The chart shows an Inverse Head & Shoulders pattern, which is a bullish reversal pattern.
The neckline has been broken to the upside, providing a strong signal for potential continued bullish momentum.
The price is currently in the neckline retest phase, a critical area to confirm the bullish trend before further upward movement.
Key Zones
Retest Zone (Pullback): 98.300 – 98.700, an important support area.
Demand Zone: If price dips further, an additional support zone lies between 97.500 – 97.000.
Monthly Trendline: Offers long-term structural support, reinforcing the bullish outlook.
Potential Scenarios
✅ Bullish Scenario (Preferred):
If the price holds above the retest zone and neckline:
Target 1: 101.000
Target 2: 102.500 – 103.500
⚠ Bearish Scenario (Invalidation):
A break below 97.000 invalidates the bullish scenario and opens the door for deeper downside movement.
Conclusion
The market shows strong bullish potential after confirming the neckline retest.
97.000 is the key invalidation level for the bullish setup.
Price action around the retest zone and demand area should be monitored closely before entering trades.
⚠️ Trade at your own risk – We are not responsible for any losses.

DOLLAR INDEX DXYThe U.S. Dollar Index (DXY) is a measure of the value of the United States dollar (USD) relative to a basket of six major foreign currencies. It reflects how strong or weak the dollar is compared to these currencies collectively. The index was created by the Federal Reserve in 1973
The six currencies included in the basket and their approximate weightings are:
Euro (EUR): 57.6%
Japanese Yen (JPY): 13.6%
British Pound Sterling (GBP): 11.9%
Canadian Dollar (CAD): 9.1%
Swedish Krona (SEK): 4.2%
Swiss Franc (CHF): 3.6%
The DXY is calculated as a weighted geometric average of the dollar's exchange rates against these currencies. When the dollar strengthens against this basket, the index rises; when it weakens, the index falls.
The index is widely used by traders, investors, and economists to gauge the overall strength of the U.S. dollar in global currency markets and to inform trading and economic decisions.
In essence, the Dollar Index provides a standardized barometer of the U.S. dollar's value against its major international trading partners' currencies.
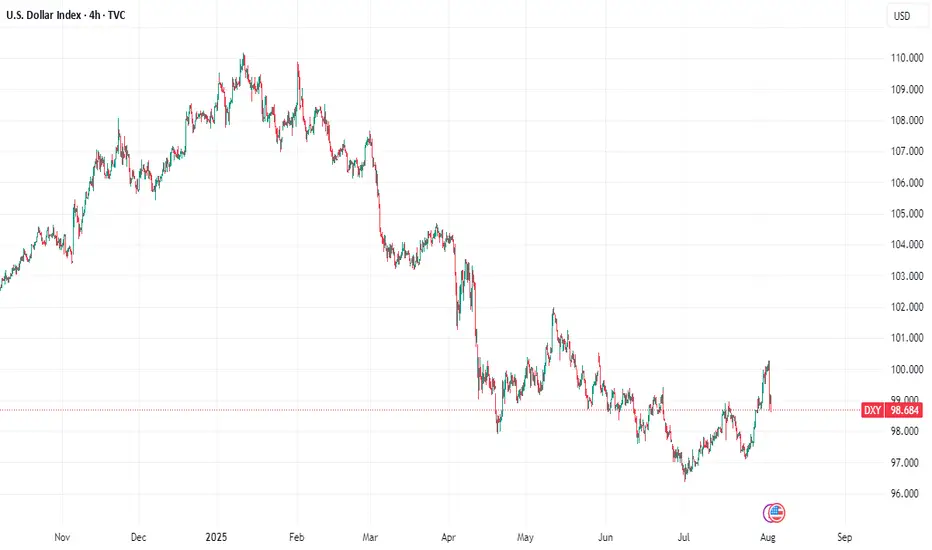
The U.S. Dollar Index (DXY) is trading near 98.684 of August 1, Friday market close.
July saw the DXY record its first monthly gain in 2025 (rising nearly 1%) as a a result of the demand floor on ascending trendline acting as dynamic support .but selling has resumed at the start of August on ADP data report, the current supply roof presents resistance to upswing capping gains on economic outlook and immigration enforcement concern.
Key Fundamental Drivers (August 2025):
Fed Policy & Inflation: The Federal Reserve kept rates steady at 4.25–4.50% in July, but persistent inflation (core PCE up to 2.8% YoY in June) and the impact of new U.S. tariffs are keeping rate cuts on hold for now.
Tariffs & Trade Policy: Fresh, globally-applied U.S. tariffs announced at the end of July have heightened risk aversion, helped the dollar find support, and stirred inflation concerns—as import price increases feed into core inflation data.
Interest Rate Differentials: While the Fed holds rates high, other central banks (especially the ECB and BOE) are signaling further easing. The resulting policy divergence still gives the dollar some support, but large inflows into alternative markets (e.g., eurozone equities, gold, yen) have also pressured the greenback.
Safe-Haven Flows: Risk-off sentiment amid trade tension and global policy uncertainty continues to prompt investors to seek the relative safety of the dollar, limiting its downside.
Composition: The DXY measures the value of USD relative to a basket of currencies: euro (57.6%), yen (13.6%), pound (11.9%), Canadian dollar (9.1%), Swedish krona (4.2%), and Swiss franc (3.6%).
The path ahead depends on upcoming U.S. inflation prints, additional Fed commentary, and how global markets react to ongoing trade disputes and central bank moves.
Longer term,
The DXY remains under pressure at the start of August 2025 but is showing tentative signs of stabilization just below the key 100 mark. The trend will hinge on Fed policy, global inflation data, and the impact of new tariffs on both inflation and global risk appetite. If buying breaks and close above weekly resistance roof then 104-103 can be reclaimed.
trading is 100% probability ,manage your risk and know that any key level can fail.
#dollar #dxy #money #eurusd #gbpusd #audusd #usdjpy

DXY POTENTIAL SCENARIO two possible scenarios for DXY in next coming weeks , watch the support and wait for confirmation before buying Dollar ,

Technical Analysis | DXY | U.S. Dollar Index4-Hour Timeframe🔍 Technical Analysis | DXY | U.S. Dollar Index
4-Hour Timeframe
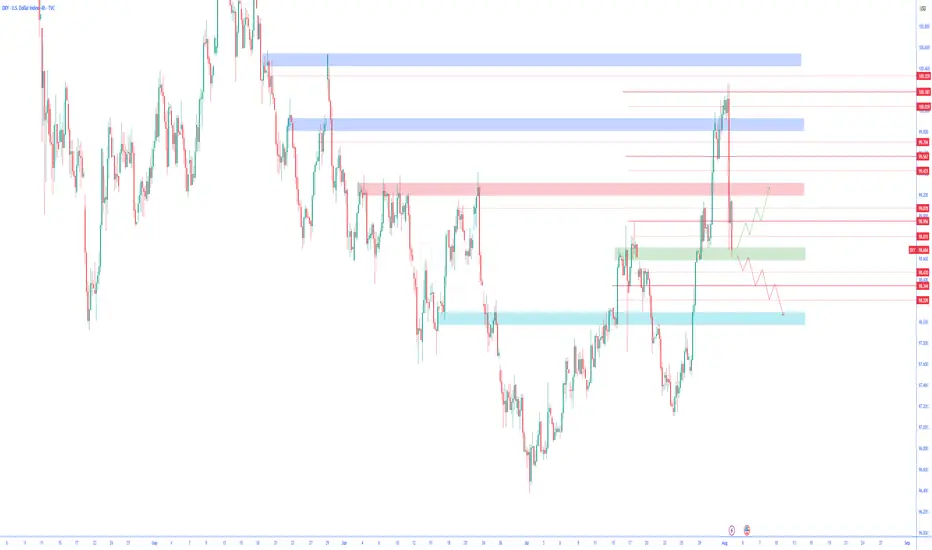
After hitting a strong supply zone marked in blue at the top of the chart, the price faced selling pressure and entered a bearish phase. Currently, the price is trading within a decision zone between buyers and sellers, where both bullish and bearish scenarios are possible.
🔼 Bullish Scenario:
If the price finds support at the mid-level support zone marked in green, and signs of a bullish reversal appear—such as proper candlestick formation or a renewed breakout of minor resistances (creating higher highs)—then the index is expected to move toward higher resistance levels.
🔽 Bearish Scenario:
Considering the market structure, if the mid-level support is lost and the price settles below this zone, the downtrend may accelerate. The dollar index could then move toward the lower support zone, marked in blue, which previously acted as a strong barrier and reversal area. This level may again serve as a key point to watch for market reactions.
✅ Conclusion
The U.S. Dollar Index is currently in a corrective phase, oscillating within a sensitive range. The price reaction to the current support zone will likely determine the next directional move. Therefore, it is recommended to wait for a confirmed breakout or bounce from this area before entering any trades.
DXY continued downside, next stop 90Perfect parallel channel + Fib 2.618 intersection
Gl
Not financial advice

US Dollar Index: Was Friday the Start of a Pullback Or Reversal?Welcome back to the Weekly Forex Forecast for the week of Aug 4 - 8th.
In this video, we will analyze the following FX market:
USD Index
The DXY had a strong week, but turned bearish Friday on weak jobs numbers. Was this just a retracement from the impulsive move up? Will price now find support for another bullish leg?
It all comes down to the +FVG, whether it holds or folds.
Look for price to continue down to discount prices early in the week... and then find it's footing on support.
Enjoy!
May profits be upon you.
Leave any questions or comments in the comment section.
I appreciate any feedback from my viewers!
Disclaimer:
I do not provide personal investment advice and I am not a qualified licensed investment advisor.
All information found here, including any ideas, opinions, views, predictions, forecasts, commentaries, suggestions, expressed or implied herein, are for informational, entertainment or educational purposes only and should not be construed as personal investment advice. While the information provided is believed to be accurate, it may include errors or inaccuracies.
I will not and cannot be held liable for any actions you take as a result of anything you read here.
Conduct your own due diligence, or consult a licensed financial advisor or broker before making any and all investment decisions. Any investments, trades, speculations, or decisions made on the basis of any information found on this channel, expressed or implied herein, are committed at your own risk, financial or otherwise.

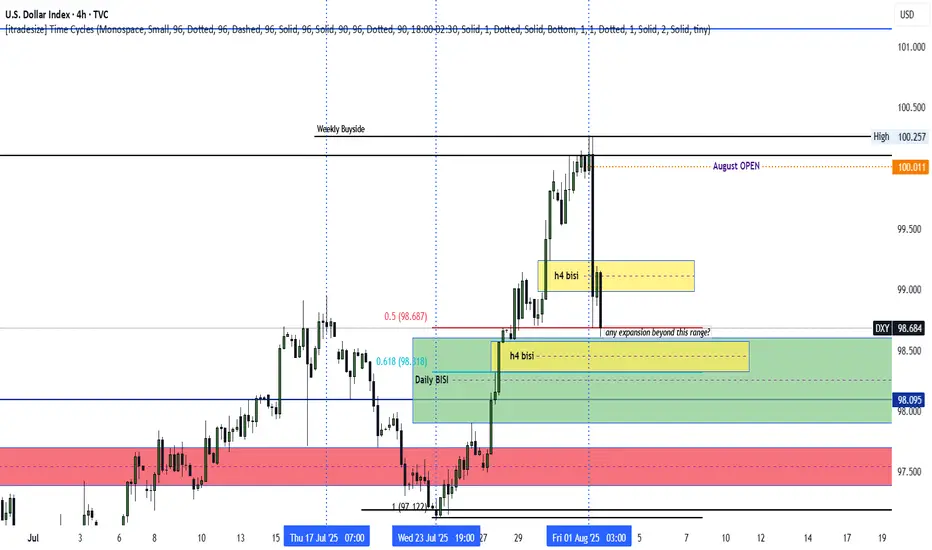
DXY bullish into AUGUSTThe dxy seems poised to rally following a rally above PMHs. The August OPEN decline could end up being nothing but a retracement as we rally high. Monday, Tuesday and Wednesday could range, while Thursday and the NFP push us above August's current highs. An expansion below Friday's New York AM lows (H4) could signal continued decline as we seek to establish weekly LOWS. Patience as the market unfolds is hand is ALWAYS key. Let's chat.
DXYThe DXY, or US Dollar Index, measures the value of the US dollar against a basket of six major world currencies: the euro (EUR), Japanese yen (JPY), British pound (GBP), Canadian dollar (CAD), Swedish krona (SEK), and Swiss franc (CHF). It is a weighted index, with the euro having the largest share, making movements in EUR/USD especially influential on the index. The DXY was created in 1973 by the US Federal Reserve to provide a clear benchmark for the dollar’s international strength after the collapse of the Bretton Woods system.
Since its inception, the DXY has served as a vital gauge of the dollar’s performance in global trade and financial markets. Historically, it reached its all-time high near 164.72 in 1985, during a period of aggressive US interest rate hikes and a strong economic expansion. Conversely, it hit its all-time low around 70.70 in 2008, at the peak of the global financial crisis, when confidence in the US economy sharply declined.
The index typically rises when investors seek safety in the US dollar, especially during global risk-off events or when US interest rates are relatively high. It also tends to strengthen during periods of US economic growth, reduced liquidity, or tightening by the Federal Reserve. On the other hand, the DXY weakens when the Federal Reserve cuts rates, inflation rises, or investor sentiment shifts toward riskier assets and other global currencies.
In the years following the COVID-19 pandemic, the DXY saw sharp movements. It rallied strongly in 2022 as the Federal Reserve raised interest rates aggressively to combat inflation, reaching levels above 114. This was followed by a pullback as inflation cooled and expectations of rate cuts emerged in 2023 and 2024. As of August 2025, the DXY stands at approximately 93.4, reflecting a weaker dollar compared to its recent highs, influenced by a more dovish Federal Reserve, growing US debt concerns, and rising investor interest in alternative assets such as gold and other currencies.
The DXY remains a key tool for traders, economists, and policymakers to assess the dollar’s position in the global economy. Its movements affect everything from commodity prices and trade balances to emerging market capital flows and inflation pressures worldwide.

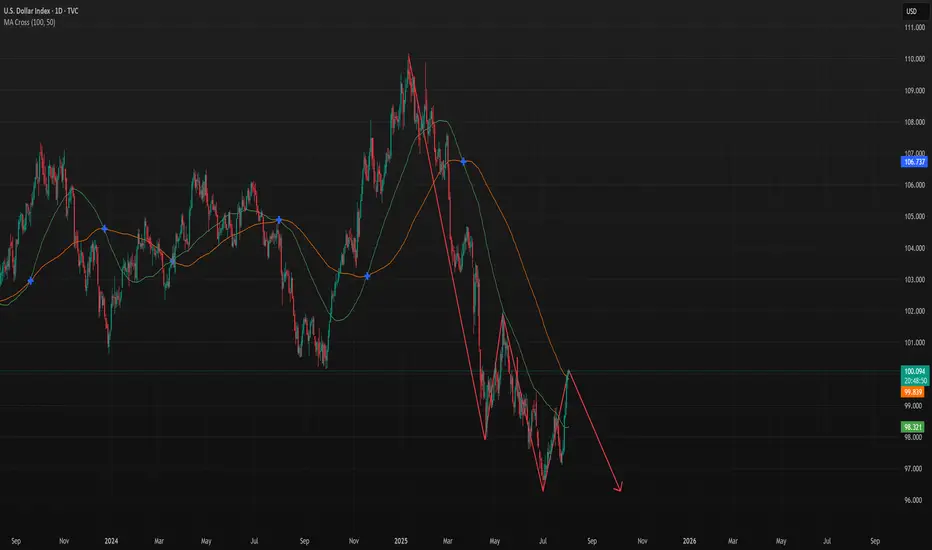
Dollar Index in Danger: Patterns Point to More DownsideThe dollar index (DXY) is flashing serious warning signs. In this video, I break down the technical evidence behind my bearish outlook on both the monthly and daily charts. The head and shoulders pattern we spotted did work it's way to breaking the neckline BUT the target will Not be achieved as the data on the charts have changed. On the daily charts we have a strong bearish engulfing candle, there is also an RSI divergence in the overbought zone, stochastic indicator has turn down and momentum is also following along. The downtrend on the monthly timeframe has not formed any divergence yet so I expect price to fall below the previous month's low in the coming weeks.
There will be bounces from support zones on the daily and 4 hours, these will be opportunities for good entries.
If you’re holding USD or trading around it, this is a must-watch. The signals are clear—are you prepared?
Cheers and I wish everyone a profitable trade in the coming week.

DXY BULLISH coming weeks Dxy is oversold, and what goes down must go up. Price did a nice retracement, setting up for next week to go higher or the week after, depending on consolidation. For me, DXY will go higher, leaving its cross pairs like EURUSD to go lower.

Dollar Falls as Traders Price In Two 2025 Rate Cuts on Weak JobsDollar Falls as Traders Price In Two 2025 Rate Cuts on Weak Jobs Data
Introduction
In a significant turn of events for the global currency markets, the U.S. dollar has taken a sharp tumble as traders brace for a more dovish Federal Reserve. A weaker-than-expected U.S. employment report for July 2025 has prompted market participants to price in two interest-rate cuts by the Fed before the end of the year. This shift in monetary policy expectations comes during a time of heightened global uncertainty, much of it triggered by President Donald Trump's aggressive trade policies, which have already disrupted the $7.5 trillion-a-day foreign exchange market.
The Bloomberg Dollar Spot Index, a key gauge of the dollar’s strength against major currencies, plunged as much as 1%—marking its worst single-day performance since April 21, 2025. The greenback’s decline was mirrored by strong gains in rival currencies, with the Japanese yen appreciating 2.2% and the euro climbing more than 1% against the dollar.
This article delves into the recent developments surrounding the U.S. dollar, the implications of weak jobs data, the Federal Reserve’s likely response, and how Trump’s trade policies are shaping the broader economic landscape.
________________________________________
Weak Jobs Data Sparks Policy Shift
The July 2025 employment report came in well below expectations. Non-farm payrolls growth fell short, and revisions for May and June showed fewer jobs were added than previously reported. These figures suggest that the U.S. labor market is cooling more rapidly than anticipated, raising concerns about the sustainability of the post-pandemic economic recovery.
According to Helen Given, a foreign exchange trader at Monex Inc., “It’s now clear that the U.S. labor market is cooling fairly sharply. There’s a good chance that Trump’s crusade against Chair Powell ratchets up further in the coming days, and there could be further losses for the dollar to come as a result.”
The disappointing employment data has led traders to adjust their expectations for U.S. monetary policy. Futures markets are now pricing in two 25-basis-point rate cuts by the end of 2025, a stark reversal from the earlier outlook that suggested the Fed would remain on hold or even consider tightening if inflation remained sticky.
________________________________________
The Federal Reserve’s Dilemma
The Federal Reserve now finds itself in a precarious position. On one hand, inflation has moderated in recent months, giving the central bank more room to maneuver. On the other hand, a weakening labor market could indicate a broader slowdown that might require immediate action to prevent a recession.
Fed Chair Jerome Powell has come under increasing political pressure from President Trump, who has publicly criticized the Fed for keeping rates too high. Trump argues that rate cuts are necessary to support U.S. exporters and counteract the negative effects of his own tariffs and trade restrictions.
Historically, the Fed has maintained its independence from political influence, but in an election year, the pressure to act can become intense. If the Fed moves to cut rates, it will be seen as responding to both economic data and political dynamics—a delicate balancing act.
________________________________________
The Global Currency Market Reacts
The ripple effects of the dollar’s decline are being felt across the globe. The $7.5 trillion-a-day foreign exchange market, already under strain from geopolitical uncertainty and shifting central bank policies, has seen increased volatility in recent weeks.
The Japanese yen, often viewed as a safe-haven currency, surged 2.2% against the dollar following the release of the jobs data. Meanwhile, the euro gained over 1%, reflecting investor sentiment that the greenback’s era of dominance may be waning—at least for now.
Emerging market currencies also found some relief, as a weaker dollar generally eases pressure on countries with large dollar-denominated debts. However, the overall picture remains complex, as trade tensions and capital flow volatility continue to weigh on risk sentiment.
________________________________________
Trump’s Trade Policies: A Double-Edged Sword
President Trump’s trade strategies have been a central feature of his second term in office. From imposing tariffs on Chinese imports to renegotiating trade agreements with the European Union and Canada, Trump has sought to reshape the global trading system in favor of American manufacturers.
Yet these policies have produced mixed results. While some sectors have benefited from protectionist measures, others—particularly those reliant on global supply chains—have suffered from rising costs and retaliatory tariffs. The uncertainty generated by these policies has also dampened business investment, slowed global trade, and disrupted financial markets.
“The dollar had tumbled this year as Trump’s aggressive trade policies rocked the $7.5 trillion-a-day currency market, weighing on global growth outlook,” Bloomberg reported.
Investors are increasingly concerned that continued trade friction, combined with growing political pressure on the Fed, could lead to policy missteps that undermine the U.S. economy and erode confidence in the dollar.
________________________________________
Market Implications
The dollar’s recent decline has far-reaching implications for various asset classes:
1. Equities
U.S. equities have shown mixed reactions. While lower interest rates are typically supportive of stock prices, the underlying reason—economic weakness—has investors on edge. Sectors such as technology and consumer discretionary are expected to benefit from cheaper borrowing costs, but cyclical sectors may struggle if growth slows further.
2. Bonds
Treasury yields have fallen sharply as traders anticipate rate cuts. The 10-year yield dropped below 3.8%, its lowest level in months. The yield curve has also flattened, a potential warning sign of slowing economic momentum.
3. Commodities
A weaker dollar typically supports commodity prices, as most are priced in dollars. Gold, oil, and industrial metals all saw gains in the wake of the jobs report. However, demand-side concerns stemming from a global slowdown could limit the upside.
4. Emerging Markets
For emerging markets, a softer dollar offers both relief and risk. On the positive side, it reduces debt servicing costs and can attract capital flows. On the negative side, if the dollar’s weakness reflects a broader global slowdown, risk appetite could remain subdued.
________________________________________
Looking Ahead: What to Watch
As markets digest the latest economic data and policy signals, several key developments will be closely monitored:
1. Upcoming Fed Meetings
The Federal Open Market Committee (FOMC) will meet again in September. Markets will be keenly watching for any changes in tone or new forward guidance. A rate cut in September now appears increasingly likely, especially if subsequent data confirms a labor market slowdown.
2. Inflation Trends
While inflation has moderated, it remains a key concern for policymakers. If inflation rebounds unexpectedly, it could complicate the Fed’s ability to cut rates without stoking price pressures.
3. Geopolitical Risks
Trade tensions, particularly with China and the EU, remain unresolved. Any escalation could further destabilize markets and weigh on the dollar. Additionally, developments in the Middle East, Eastern Europe, and Southeast Asia could add to the uncertainty.
4. U.S. Presidential Politics
With the 2026 presidential election campaign already underway, Trump’s rhetoric and policy decisions will continue to influence market sentiment. His ongoing criticism of the Fed could erode confidence in U.S. institutions, particularly if it leads to perceived politicization of monetary policy.
________________________________________
Conclusion
The sharp fall in the U.S. dollar following weak July jobs data marks a pivotal moment in 2025’s economic narrative. With traders now pricing in two Federal Reserve rate cuts by year-end, the stakes have never been higher for policymakers, investors, and political leaders.
While a softer dollar can provide some temporary relief to exporters and boost inflation expectations, it also reflects deeper concerns about the strength of the U.S. economy and the unintended consequences of aggressive trade policies. President Trump’s confrontational approach to global trade, combined with mounting pressure on the Fed, is creating a complex and potentially volatile environment for markets.
As the year progresses, all eyes will be on the Federal Reserve’s response, the resilience of the U.S. labor market, and the evolving political landscape. In a world where headlines can move markets in seconds, clarity, stability, and sound policy have never been more critical.
________________________________________
Disclaimer: This article is for informational purposes only and does not constitute financial or investment advice.
DXY LONGi am looking to go long on DXY from this level of breaker block.. a possible pullback to this level we will engage on the buy and use itr as cross reference for our dollar pairs ..

DXYBack to the initial direction which is bullish momentum acoording to cot report. And I'm expectiong more continuation till maket close of before

DXY - Possible Down Swing to continue furtherTVC:DXY
CMCMARKETS:USDCAD
OANDA:NZDUSD
CMCMARKETS:EURUSD
We may have a further down swing pattern forming let's continue to see if it passes the resistance area.
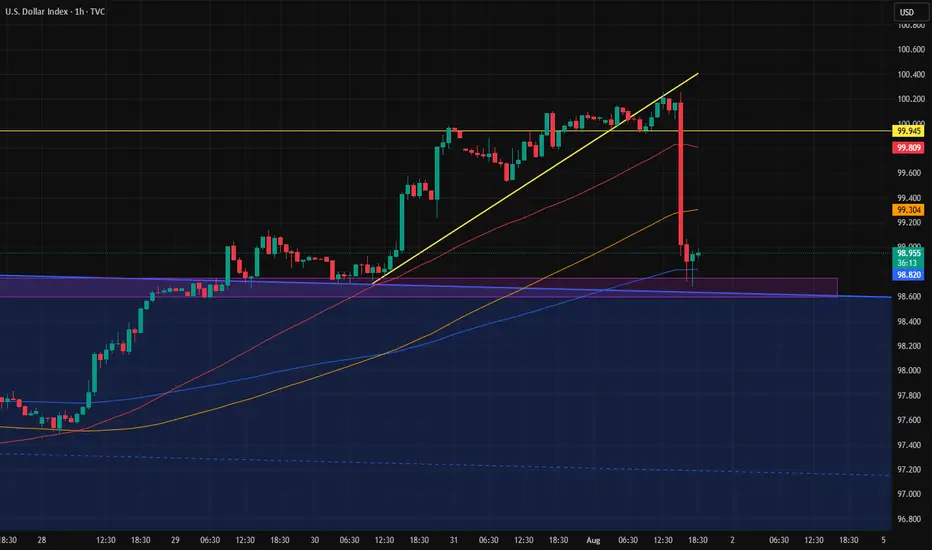
The strength of the PMI reportWe all saw how a large and strong candle formed right after the news, hitting the top of the previous channel.
So now that channel top zone has proven to be valid.
Now we have to see whether this candle leads to another drop in the dollar, or if the dollar recovers and slowly starts moving back toward 100.
What now for the dollar after a poor NFP report?It is difficult not to link the bad US data to the impact of tariffs. Indeed, it certainly looks that way, especially given that the slowdown in jobs started in early Q2 when reciprocal tariffs were announced. Companies expecting margins to be squeezed by higher duties probably thought twice about hiring workers in order to keep costs down. So, the US labour market has been losing steam fast, undoubtedly due to tariff concerns. Unless the data surprises on the upside soon, the Fed may have no choice but to cut—and cut again. Against this backdrop, the recovery in the dollar is going to a long bumpy road.
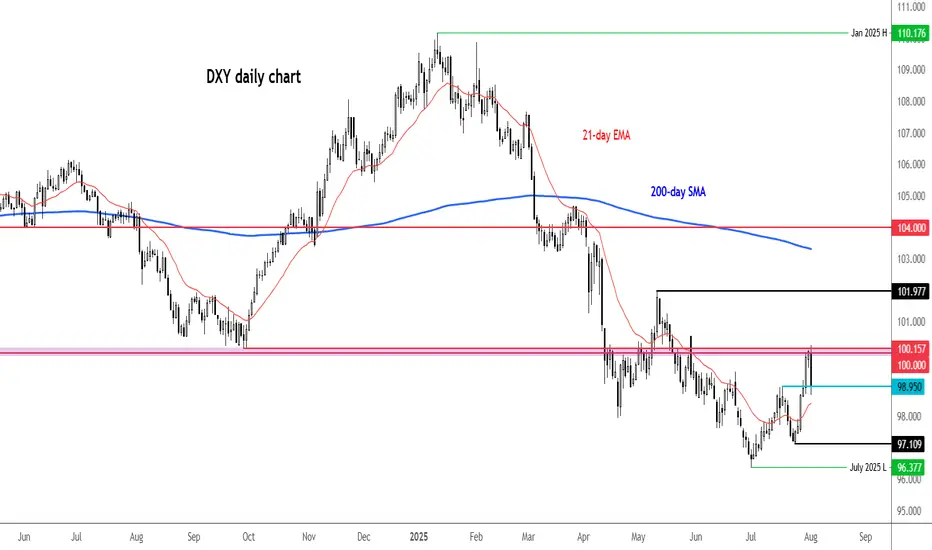
We noted the area around 100.00 to be resistance in the previous update, and that level has held, thanks to the weak jobs report (and ISM survey that was released later). The DXY was testing potential support around 98.95 at the time of writing. Will it be able to bounce there? Break that on a closing basis and next week could bring more technical dollar selling.
By Fawad Razaqzada, market analyst with FOREX.com
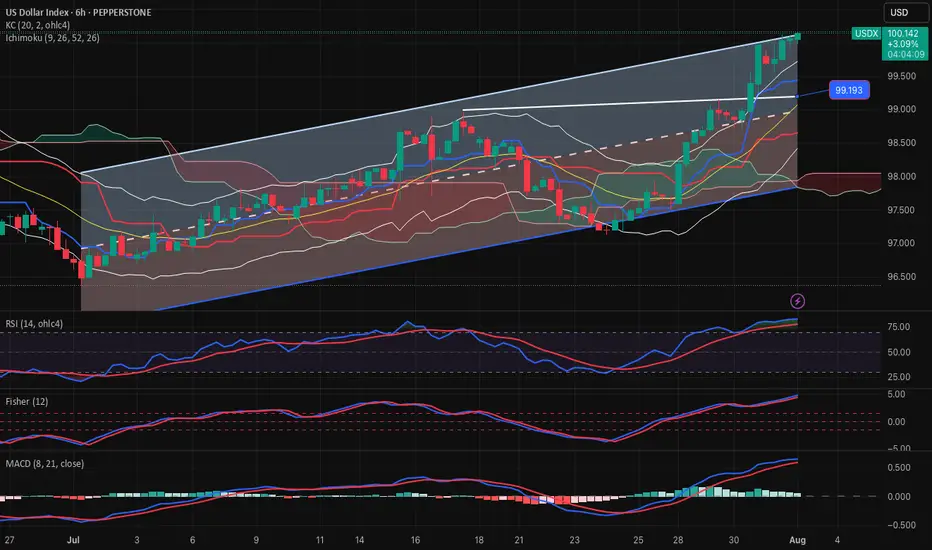
USDX-SELL strategy 6 horuly chart Reg.ChannelThe index has moved up sharply, and as always, when over speeding, one may get a speeding ticket. :) anyway, on a serious note, we are quite overbought and above the Reg. Channel a bit. This means over time we may see a pullback, which can bring us to lower 99.00s.
Strategy SELL @ 100.00-100.40 and take profit near 99.07 for now.
US Dollar Index (DXY) Technical Analysis:The DXY has recently exited a bearish wave, retested support levels, and began a recovery — currently trading near 100.09, a key resistance area.
🔹 If price breaks and holds above 100.09, the upward move may continue toward the 102.00 zone.
🔹 However, if the index rejects this level and reverses, a retest of 98.80 could follow.
⚠️ Disclaimer:
This analysis is for educational purposes only and does not constitute financial advice. Always perform your own analysis and monitor the markets before making any investment decisions.
DOLLAR INDEXDepartments Responsible for Each Economic Report
Indicator Responsible Department/Source
Average Hourly Earnings m/m U.S. Bureau of Labor Statistics (BLS), part of the Department of Labor
Non-Farm Employment Change BLS (Establishment Survey)
Unemployment Rate BLS (Household Survey)
Final Manufacturing PMI S&P Global/Markit (private company)
ISM Manufacturing PMI Institute for Supply Management (ISM, private sector)
ISM Manufacturing Prices Institute for Supply Management (ISM)
Revised University of Michigan (UoM) Consumer Sentiment University of Michigan (private/public university)
Construction Spending m/m U.S. Census Bureau, Department of Commerce
Revised UoM Inflation Expectations University of Michigan
How the Federal Reserve Interprets “Greater Than” or “Lower Than” Forecast
1. Average Hourly Earnings,
2.Non-Farm Payrolls,
3. Unemployment Rate
Higher than forecast (stronger labor market):
Tight labor markets (higher wages, more jobs, lower unemployment) suggest inflationary pressure.
The Fed may view this as a signal to keep rates higher for longer, as wage and job growth could fuel inflation.
Lower than forecast (weaker labor market):
Signals cooling in employment and wage growth, reducing upward pressure on inflation.
The Fed may see this as justification to consider easing policy or at least pausing further rate hikes.
2. Manufacturing PMIs (ISM, S&P)
Above 50: Signals expansion in manufacturing; below 50 indicates contraction.
Higher than forecast: Points to stronger economic momentum; the Fed may see upside risks to inflation.
Lower than forecast: Indicates weaker manufacturing activity; a possible sign of slowing demand, which could support rate cuts or dovish policy if persistent.
3. ISM Manufacturing Prices
Higher than forecast: Suggests inflationary pressures in manufacturing input costs; Fed interprets this as a reason for vigilance on inflation.
Lower than forecast: Implies easing input price pressures, supporting a dovish outlook if inflation remains subdued.
4. University of Michigan Consumer Sentiment & Inflation Expectations
Stronger than forecast sentiment: Consumers are more optimistic, often a sign of solid spending potential. May amplify inflation if this leads to greater demand.
Higher inflation expectations: If consumers expect higher future inflation, this can become self-fulfilling and the Fed may maintain tighter policy.
Weaker sentiment/lower inflation expectations: Reduces inflation risk, gives the Fed more flexibility to ease if needed.
5. Construction Spending
Higher than forecast: Indicates resilient investment and demand in the real economy.
Lower than forecast: Suggests cooling real estate and infrastructure spending; may support a dovish Fed outlook if sustained.
Summary Table
Data Surprises Interpretation for Fed Policy
Higher-than-forecast More hawkish; raises risk of persistent inflation
Lower-than-forecast More dovish; reduces pressure to hold rates higher
The Fed looks at the overall pattern across these data. Persistent upside surprises heighten concerns about inflation, supporting tighter policy. Downside surprises suggest cooling economic momentum and may encourage future rate cuts or pauses. The relative impact depends on which indicators surprise and the broader economic context.
#DXY #DOLLAR

Candle close above 100 after 2 months.If the Dollar Index manages to close above the 100 level today, following the important news release, there's a chance the upward move could continue toward the key 101 zone next week.
However, unless it breaks above the 101 level with strong momentum, the overall trend in the higher timeframes still remains bearish.