The dark situation of the Dollar Index never endsThis week is the most important week of 2025, and the dollar’s situation is not good at all. It’s unclear what will happen by the end of the week with all the news coming out, and there’s a high chance that all our analyses — whether on coins, gold, or currency pairs — could turn out to be fake. ✅
USDX trade ideas

DXY Bearish The DXY is expected to remain bearish until it reaches the 94.00–92.00 levels, with the possibility of dropping even further below those levels

Dollar Index (DXY) – Watching Both Sides LiquidityOn the daily timeframe, we can clearly identify liquidity resting on both sides of the chart:
Relative equal lows acting as sell-side liquidity.
Low-resistance highs representing buy-side liquidity.
From my perspective, the main draw on liquidity remains the sell-side lows. However, before targeting that area, price may first reach higher to grab the buy-side liquidity. Once this liquidity is collected, I expect a potential shift in momentum and a move to the downside.
💌It is my honor to share your comments with me💌
🔎 DYOR
💡Wait for the update!

Us Dollar Index
Hi traders
I will provide you with an analysis of dxy, maybe it will be useful.
Considering reaching the support zone as well as the bottom of the descending channel on the 4-hour time frame،I expect an upward trend (dollar strengthening)
Of course, a trend change may occur after a fake breakout and the trend may become bullish after reaching the number 96.
warninggggg
If today's and tomorrow's news, which are very important, invalidate this analysis, a new analysis will be presented soon.

DXYThe US Dollar Index remains in a downtrend. If the support zone breaks out, I expect the bearish trend to continue. Otherwise, if the price reaches the resistance zone, it could decline again.

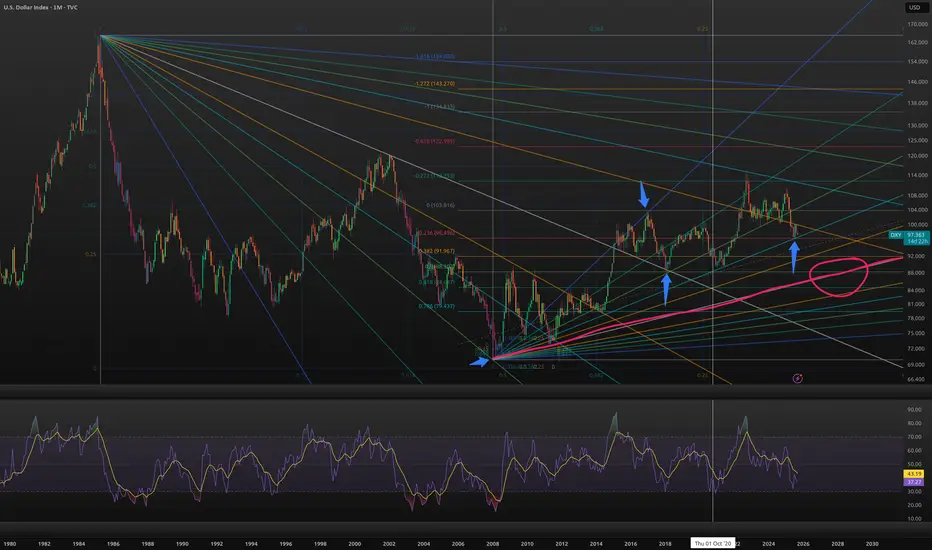
DXY on the move - where to next?This chart has three key elements:
fib fan from the high in 1985
fib fan from the low in 2008
fib retracement. The blue arrows show the anchor, top and 50% retrace
Note how perfect the 50% retrace is. This validates the fib. Also note that we pinned the .236 level which is also the teal fib fan line, where we've found previous support. .236 generally offers a bounce, especially combined with another key level (ascending teal trendline).
RSI momentum looks to be pulling us down. Also note the grey fib fan centerline. This is the basis for this fib fan and we touched it twice, once in 2008 and once in 20011. I believe the dollar will get back to this grey trendline, likely where I've circled, somewhere around the intersection of the 50% fib and this trendline. I would not be surprised to see a bounce to 104. We could also see 75 sometime in june/july of 26 if things start getting crazy.
DXYU.S Dollar Index
- Bearish Channel as an corrective pattern in Short Time Frame
- Fair Value Gap
- Order Block
- Change of Characteristics
- Completed " 123 " Impulsive Waves

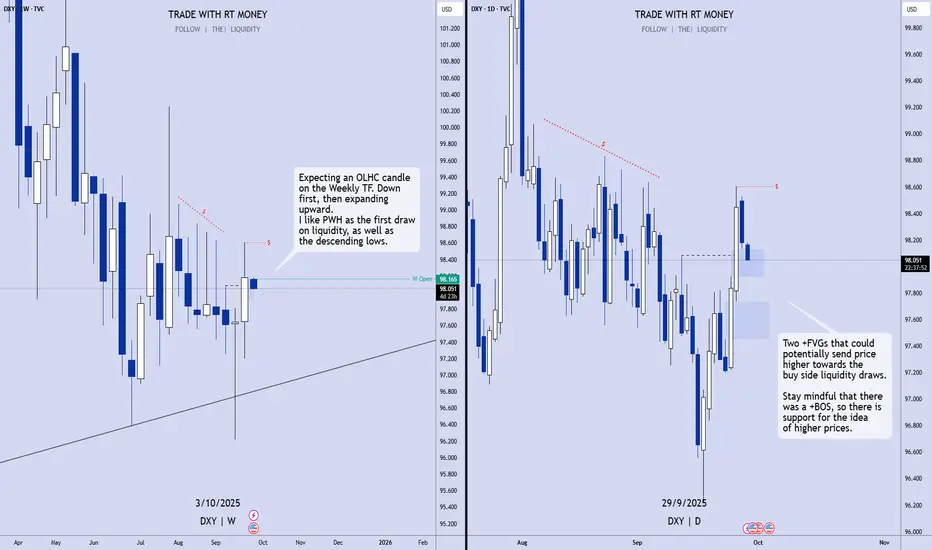
DXY update (29/09/2025)The upper rail of the descending parallel channel channel is waiting to be confirmed.
What matters is the fib target and bottom rail intersection. But most importantly is the bottom rail intersection.
Looks like it will be an aggressive dump.
Not financial advice

DXY outlook for the current week (WC29/09/25)DXY key levels to look out for this week, taking into consideration of manufacturing PMI, ADP & NFP
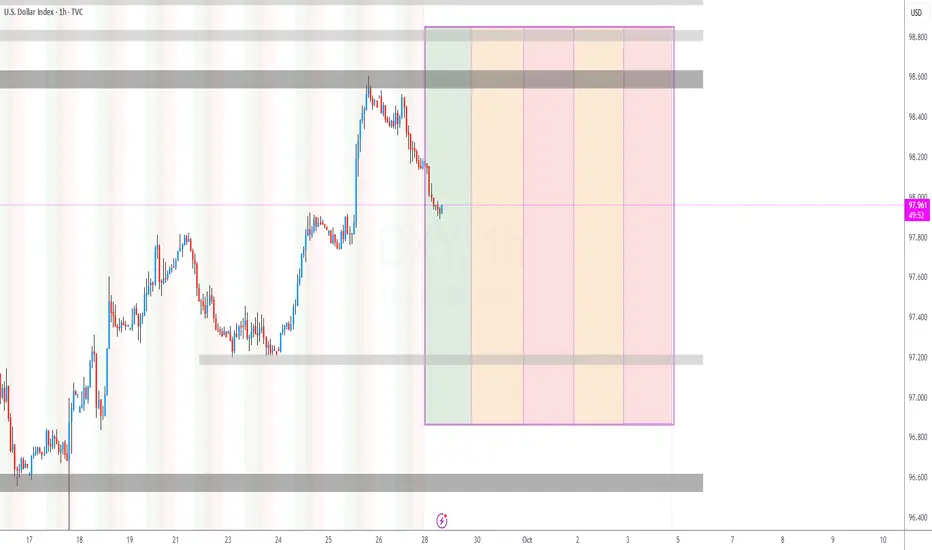
US Dollar Index: Bullish! Buy The Dip!Expecting price to retrace into the +FVGs below. Look on the 1H for a CISD when price comes into contact with either of the two poi's. Once a directional change is confirmed, buy it.
Enjoy!
May profits be upon you.
Leave any questions or comments in the comment section.
I appreciate any feedback from my viewers!
Disclaimer:
I do not provide personal investment advice and I am not a qualified licensed investment advisor.
All information found here, including any ideas, opinions, views, predictions, forecasts, commentaries, suggestions, expressed or implied herein, are for informational, entertainment or educational purposes only and should not be construed as personal investment advice. While the information provided is believed to be accurate, it may include errors or inaccuracies.
I will not and cannot be held liable for any actions you take as a result of anything you read here.
Conduct your own due diligence, or consult a licensed financial advisor or broker before making any and all investment decisions. Any investments, trades, speculations, or decisions made on the basis of any information found on this channel, expressed or implied herein, are committed at your own risk, financial or otherwise.
DXY to come lower then go long Clear demand zone labelled.
Clear potential FVGs need filling
Clear liquidty to target

DXY 4H🔹 Overall Outlook and Potential Price Movements
In the charts above, we have outlined the overall outlook and possible price movement paths.
As shown, each analysis highlights a key support or resistance zone near the current market price. The market’s reaction to these zones — whether a breakout or rejection — will likely determine the next direction of the price toward the specified levels.
⚠️ Important Note:
The purpose of these trading perspectives is to identify key upcoming price levels and assess potential market reactions. The provided analyses are not trading signals in any way.
✅ Recommendation for Use:
To make effective use of these analyses, it is advised to manually draw the marked zones on your chart. Then, on the 15-minute time frame, monitor the candlestick behavior and look for valid entry triggers before making any trading decisions.

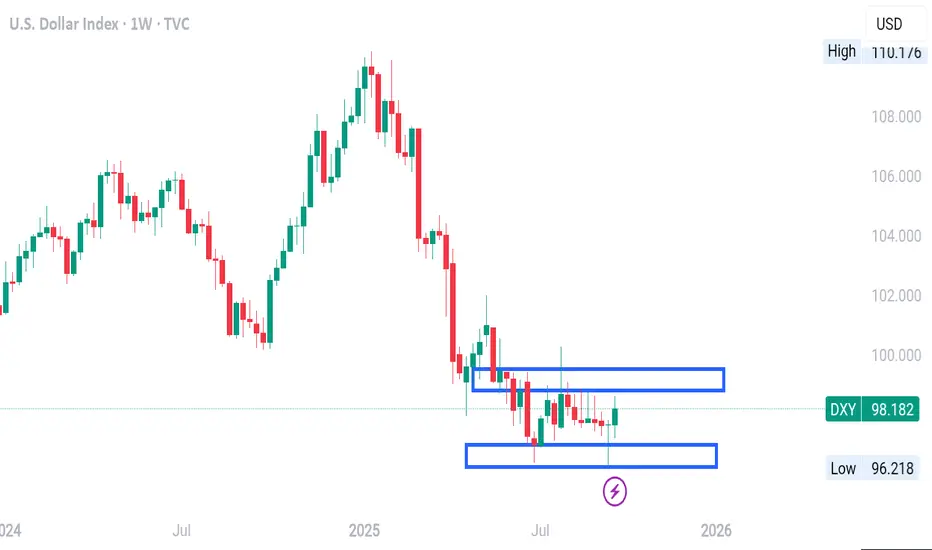
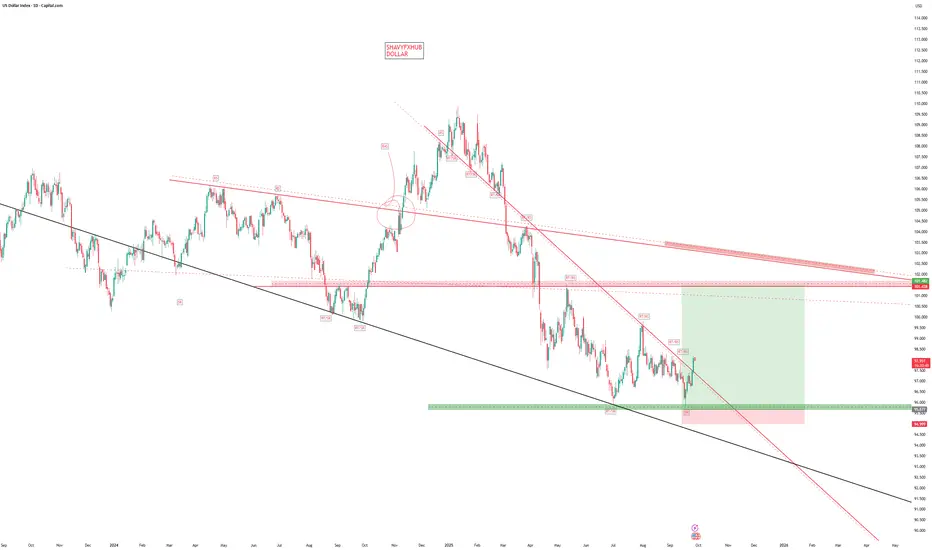
DOLLAR INDEX WEEKLY TIMEFRAME ANALYSIS Looking at the chart (USD Index, Weekly timeframe):
1. Current Context
Price has been in a clear downtrend from the highs above 110.
Recently, it has moved sideways between 96.90 – 99.30 (the two boxed ranges you marked).
Current weekly candle is green, showing a short-term attempt to bounce.
2. Key Zones
Resistance zone: 98.53 – 99.34 (upper box). Price has repeatedly failed to close above this region.
Support zone: 96.92 – 96.12 (lower box). Buyers have stepped in here multiple times to prevent deeper falls.
3. Directional Bias
Macro bias (weekly structure): Still bearish, because the overall trend is lower and price is consolidating near the bottom after a strong selloff.
Immediate/short-term bias: Neutral to slightly bullish, since the last candles show rejection of the lower end (around 97) and price is pushing back up toward resistance at 98.50+.
4. What to Watch
If price breaks and closes above 99.34, bias shifts bullish with room toward 100.95.
If price rejects the 98.5–99.3 zone again and rolls over, expect continuation lower toward 96.00 and potentially 95.30.
👉 Summary:
Bias is bearish overall, but short-term corrective bullish as price moves within the range. Directional confirmation will come only when price breaks out of either the 99.30 resistance or the 96.12 support.
DXY Showing signs of strength as we can see in weekly TF price rejects this weekly area and confirms reversal through doji candle on a weekly TF fed is not supposed to cut rates in next meeting there are possibilities that dollar can regain its strength
price did not break below the previous week low..

DOLLAR REBOUND TO TAKE PROFIT ZONE DOLLAR ,the united states dollar remains a key driver for EURUSD,AUUSD,GBPUSD,USDJPY,XAUUSD,BITCOIN SILVER ,COPPER,when i shared a perspective on the rebound we started seeing a sharp drop in weekly gains of EUR,GBP,GOLD ,SILVER AUD ,CAD, ZAR.
IF THE DXY REBOUND FINALLY REACH TAKE PROFIT ZONE ,OTHER PERS TRADING AGAINST THE DOLLAR WILL STRUGGLE.
#DOLLAR #DXY #US10Y
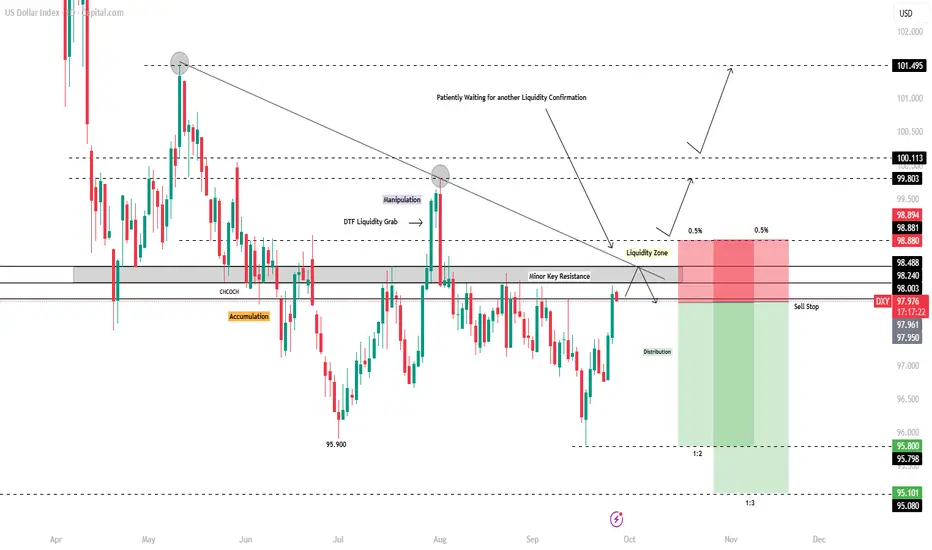
DXY Daily Timeframe – Technical & Fundamental AnalysisDXY Daily Timeframe – Technical & Fundamental Analysis
Fundamentals:
The U.S. economy continues to print strong economic data, which typically supports the dollar. However, the DXY has failed to create new highs and is currently sitting below key resistance. This suggests that much of the positive data is already priced in. With buying momentum slowing, there is an increasing probability that traders will begin taking profits — potentially triggering a sell-off.
Technicals:
After a liquidity hunt/manipulation above previous highs, price broke below a key level, confirming a Change of Character (CHoCH).
Post-breakout, price accumulated sell positions under the key level and was driven lower, reaching as far as 95.900.
A pullback followed, with price retesting the minor key resistance at 98.300, but failing to break higher.
We are now watching closely for a liquidity grab within the 98.300–98.880 liquidity zone.
📌 Trading Plan (DTF Bias – Bearish):
Point of Interest (POI): 97.950
Stop Loss (SL): 98.880 (above liquidity zone)
Take Profit 1 (TP1): 95.800
Take Profit 2 (TP2): 95.100
📌 Disclaimer: This is not financial advice. Always wait for proper confirmation before executing trades. Manage your risk wisely and trade what you see—not what you feel.
Powell Flags Rich Valuations as Dollar Holds the High GroundOur plan from last month is unfolding: weekly liquidity pockets around 97–98 on the DXY have now been tapped, with first profit targets reached on several cross pairs.
Technically, we see:
EUR/USD divergence – euro pushed into absorption while the dollar closed higher.
Heavy weekly liquidity – price action continues to respect the upper band near 98.
From the macro side, Fed Chair Jerome Powell added a quiet but important layer.
In his latest speech, he noted that U.S. equities appear “fairly highly valued,” a gentle reminder that financial conditions matter and valuations are stretched.
He balanced that with a steady-hand message on policy, but the hint was clear: risk assets are not priced for perfection.

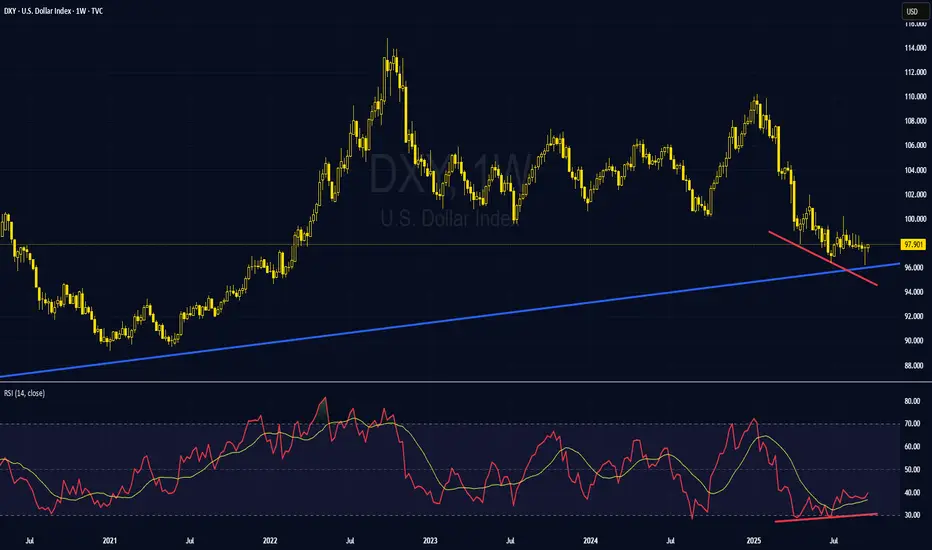
Revisit: DXY long-term analysis (Weekly chart), maintain bullishRevisit: DXY long-term analysis (Weekly chart), maintain bullish view on USD that DXY near or already end of the downtrend
Technical perspective
DXY continues to hold above its 14-year ascending trendline, despite a brief dip below it—underscoring the broader uptrend.
The index has yet to make a lower low following an RSI bullish divergence, signaling potential for a bullish reversal. The longer it consolidates above the trendline, the closer the index resumes its uptrend.
A rebound from current levels and a break above 100.00 would establish a higher low—an early reversal signal that could mark the end of the downtrend and potentially accelerate gains toward 105.00.
Overall, this area may mark the bottom of the current DXY bearish trend and could trigger a significant rebound.
However, a break below 95.00 would warrant a reassessment of this view.
Fundamental Perspective:
USD is poised to turn bullish due to the following factors:
The factors that had been weighing on the dollar are fading, paving the way for renewed USD strength. Those factors such as concerning over tariff policy, central-bank independence (as the Fed now began an easing phase), and the concern for large volumes of maturing US Treasuries have been rolled over and has proceeded smoothly.
Europe and the U.K.’s competitiveness has deteriorated due to war and conflict, forcing a shift to higher-cost energy sources that will weigh on the region’s industries over the long term. The region also lacks a powerful new S-curve industry like the US tech sector, including aging societies in many countries pose structural headwinds that erode long-run economic potential.
Early signs of improvement are also emerging in the US trade balance roughly six months after the Trump tariff regime took effect, with a progressively clearer recovery expected.
One counterargument is that a Fed rate-cutting cycle typically weakens the dollar. However, there are several reasons the USD may not depreciate due to Fed dovish cycle from now:
1. Markets have largely priced in Fed cuts; the balance of risks now skews toward hawkish surprises.
2. Trump’s tariff policy may weaken trading partners’ growth and currencies, which in turn supports the USD.
3. Elevated geopolitical and trade uncertainty is boosting the dollar’s safe-haven appeal, drawing inflows even as rates fall—consistent with the dollar’s historical resilience during global stress.
To conclude, USD appears to be in a gradual recovery phase, with a more obvious strengthen likely over the next year.
Analysis by: Krisada Yoonaisil, Financial Markets Strategist at Exness
P.S. Previous analysis:
Dxy bullish | 98.012The US Dollar Index (DX) appears to be completing its Wave 4 correction within the Elliott Wave structure, signaling a potential bullish reversal. After a period of consolidation and pullback, price action is stabilizing above key Fibonacci support levels, suggesting that the corrective phase may be ending. Technical indicators are starting to shift bullish, with early signs of momentum recovery and possible bullish divergence on lower timeframes. A confirmed breakout above short-term resistance would likely validate the start of Wave 5, targeting a new swing high. Overall, the setup favors a bullish continuation as Wave 5 unfolds, in alignment with the primary uptrend.

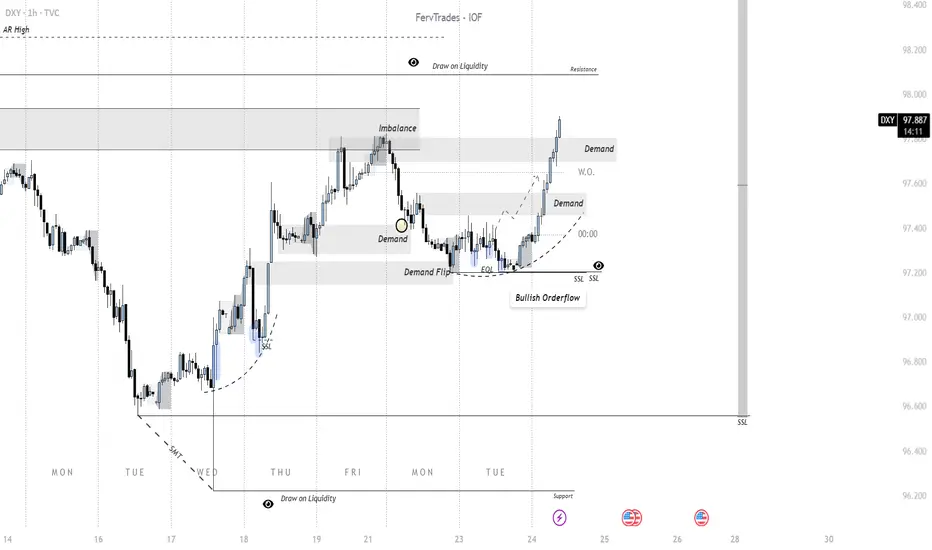
Importance of DXY for all CFD and Futures Assets The 1H DXY chart shows a clear shift in orderflow from bearish to bullish, framed within an auction-theory context where price continuously seeks liquidity to facilitate rebalancing. Early in the week, supply overwhelmed demand, driving the dollar lower into a region of resting liquidity (sell-side liquidity/SSL). This liquidity grab served as the catalyst for demand to reassert itself, evident in the sharp recovery that flipped prior supply zones into demand. The chart highlights a demand flip and multiple demand re-entries, showing how buyers defended levels once liquidity was secured.
Auction-wise, the market auctioned downward until sellers exhausted at a support zone near SSL, where bids were reintroduced. This led to an imbalance that buyers corrected by driving higher, reclaiming inefficiencies (noted in the imbalance box). Subsequent consolidation acted as a re-auctioning phase to validate demand before continuation. Now, the bullish orderflow is steering price toward resting liquidity overhead (draw on liquidity), with demand zones forming higher as the market reprices.
In short: orderflow reveals a demand-driven transition, with the auction process shifting value upward after clearing downside liquidity. The next key behavior will be how DXY reacts once it taps into overhead resistance and whether new demand sustains the auction higher or supply reasserts.
Strong Momentum at ResistanceNow I am projecting DXY is strong for upcoming session. Potential for resistance Breakout.
Plan,
Bullish for USDxxx
Bearish for xxxUSD

US DOLLAR LIQUIDITY GAMES MAPThe U.S. Dollar is testing traders resolve.
Price action keeps pressing higher, and a daily close above 97.394 would confirm a classic “fractal low” — the kind of structural pivot that lures late buyers before the real move unfolds.
3 Key Insights
Macro Calendar – Stay alert:
Thu – Final Q2 GDP, Weekly Jobless Claims, Durable Goods Orders.
Fri – Core PCE Price Index, Personal Income & Spending, University of Michigan Sentiment (final).
These are the week’s steering currents for USD flows.
A daily close above 97.394 is the key trigger to confirm a fresh leg higher.
• EUR/USD short bias remains valid while DXY stays bid, but expect intraday volatility around data releases.

DXY – Post-Fed Cut: What’s Next for the Dollar?The Fed has cut rates — but the dollar didn’t flinch. No major reaction, which suggests the move was priced in.
I currently see two possible scenarios unfolding on DXY:
Scenario 1: Triangle Completed – More Downside Ahead
If we’ve finished a triangle correction, a break below 96.20 could confirm the move and open up downside toward $95–$92.
Chart:
Scenario 2: Ending Diagonal in Wave 5
Alternatively, the recent low may mark the end of a 5th wave diagonal, completing Wave 3 of the broader decline. If so, we could see choppy corrective action before any larger moves.
Chart:
Key level to watch: Break below $96.20
If price closes above $100.25 I will review the analysis as this may indicate the downward trend is complete.
