USD Index to fall fast - Mar-a-largo AccordUSD Index to fall fast - Mar-a-largo Accord
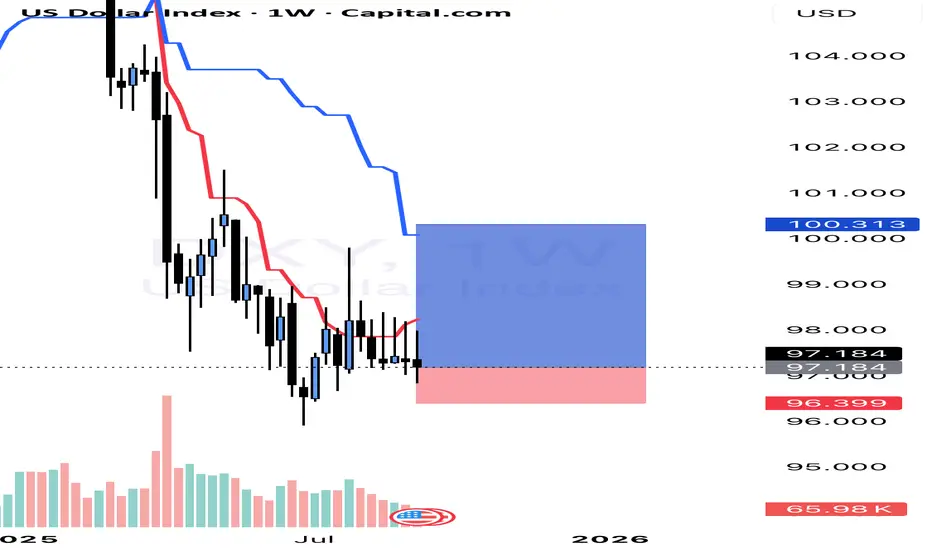
Dr Stephen Miran (Whitehouse Chief Economic advisor) set the plan for a weaker USD going forward and vast tariffs to rebalance the US trade deficit.
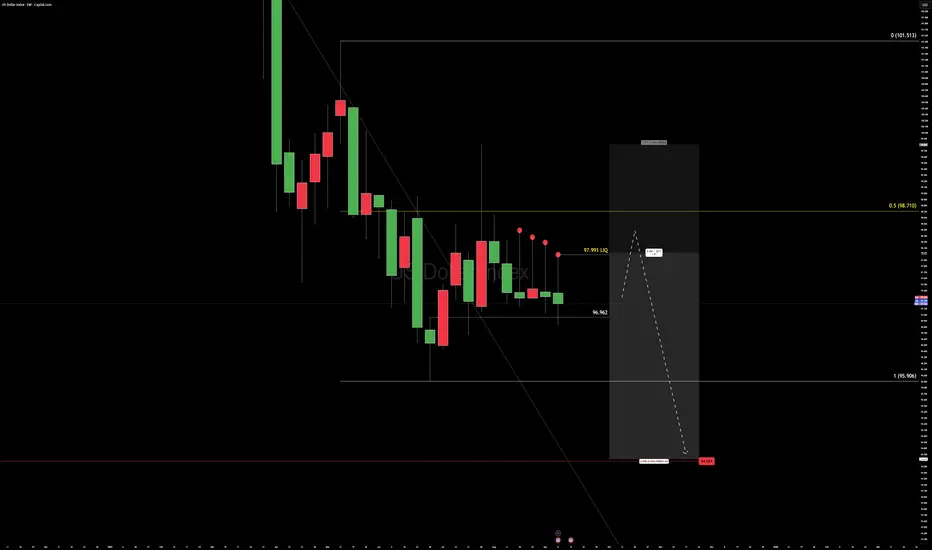
Yellow arrow indicates the start of 2025 and the trade tariffs. Red arrow indicates likely downward breakout of the long-term Uptrend support line.
USDX trade ideas

Hmmm, DXYThere is something quite telling about the DXY that has me rubbing my chin. If the DXY continues it's downtrend this year and even next year, what would it mean for assets against the dollar, especially crypto currencies, mainly Bitcoin? Typically, Bitcoin's 4 year cycle is bearish on the 4th year but that was for the last 15 or so years when the dollar was in an uptrend. What would happen on the fourth year for Bitcoin during a crashing DXY? Is it safe to hold crypto currencies this end of cycle? I have a feeling that if the DXY continues to fall, crypto will continue to rise even during the 4th year when the bears usually take over. The take over may happen, but with a minor correction (32.8 possibly) that whiplashes a bit more than it trends, before it trends again. Stay tuned!

BEARISH CONTINUATION FOR DXYBearish Bias for CAPITALCOM:DXY
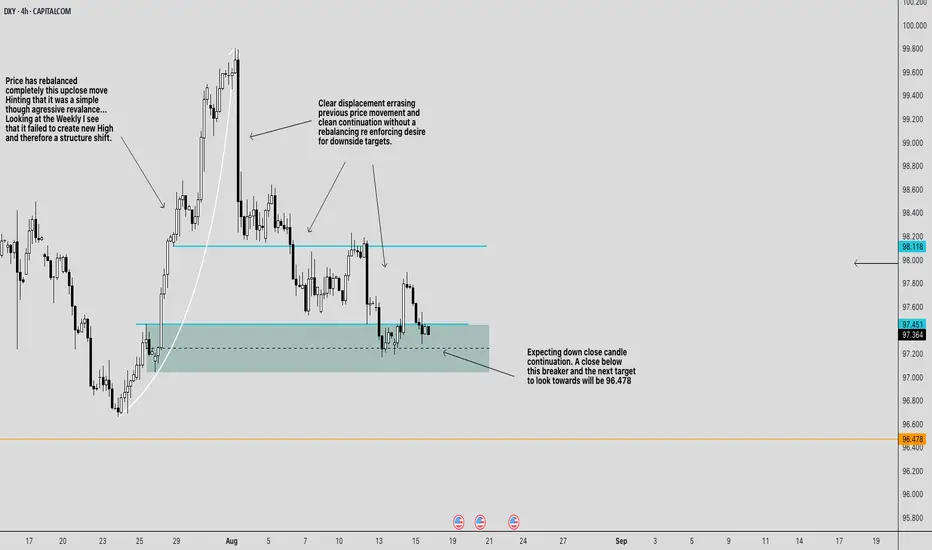
Weekly context:
The last up-move failed to print a new weekly high. Failing to create a shift in structure , so rallies are suspect.
4H structure:
We had a hard bearish displacement (large down candles) that erased prior price action and kept going without delivering a “full” rebalance. That usually means the price target remains lower .
The key zones on chart
Breaker / sell zone: \~ 97.45–97.75 (teal box). This is the prior bullish OB that failed (now acting as resistance).
Line in the sand: \~ 97.35–97.40 (dashed line through the teal). A decisive 4H close below here signals continuation.
Upside cap / invalidation area: 98.12 (cyan line) up to \~ 98.20 . Above this, the bearish sentiment weakens.
Primary downside draw: 96.478 (orange line). That’s the next obvious liquidity/inefficiency magnet on your chart.
Trade plan
Idea A — Rejection short from the breaker (preferred):
Entry: look for a rejection setup inside 97.45–97.75 (e.g., 15m/1h bearish shift after a sweep).
Stop: above the breaker and the cyan line ⇒ 98.12 (conservative) or 98.20 (safer).
Targets:
T1: 96.84 (take partials; pay yourself)
T2: 96.47.00
Idea B — Continuation after the break (confirmation play):
Trigger: a 4H close below \~97.35 .
Entry: sell the first clean pullback into 97.35–97.45 .
Stop: above 97.85–98.00 (back inside the breaker); conservative stop 98.12 .
Target: 96.478
Management & invalidation
If price rebalances deeper and closes 4H above 98.12–98.20 , the breaker is failing. Flatten shorts; reassess (potential squeeze toward 98.60–99.00 is then on deck).
If price hesitates at 97.00 , trail above the last 1H swing high to protect realized PnL while aiming for 96.478 .
News risk: Your chart flags upcoming US data (icons). Expect wicks; use hard stops and consider sizing down around releases.
Why this makes sense
* The strong displacement leg sets the draw lower.
* The teal box is a bearish breaker created by a failed bullish structure—ideal for “sell on rally.”
* The market rebalanced the prior up-close leg already; the lack of a symmetrical rebalance on the down-leg favors continuation to the next target ( 96.478 ).
One-liner: Bearish while 4H stays under 98.12 ; sell rallies into 97.45–97.75 or sell a 4H close-and-pullback below 97.35 ; scale out 97.20 → 97.00 → 96.80 → 96.478 ; hard stop above 98.12–98.20 .
*Not financial advice. Size appropriately and stick to your stop.*
PLEASE PUA!
DXY Neutral -BearishCAPITALCOM:DXY
Quick read / bias
Near-term neutral → biased bearish.
Price has failed to produce a clean reversal from the large consolidation at the top, shows a series of lower-highs and liquidity hunts (marked ellipses / Imbalance repairs on the chart), and a visible “downside pressure” supply region above. The path of least resistance is down unless price reclaims the supply/consolidation zone above ~98.6–99.2.
------------------------------------------------
Key levels (from the chart)
Major consolidation / supply: ~99.2 – 99.8 (big-picture resistance).
Downside pressure / mid supply: ~98.5 – 98.8 (area to sell into).
Recent micro highs: 98.39, 98.19, 97.99 (loci for liquidity).
Current price (chart right): ~97.18.
Recent local low/liquidity grab: 96.834.
Weekly void / structural bottom to watch: 96.478 (labelled on chart).
Invalidation for bearish thesis: close/hold above 99.2 (reclaim of consolidation).
------------------------------------------------
How I read the structure (step-by-step)
Price spent time in a higher consolidation zone and then failed to reverse higher — that is a distribution / supply footprint rather than demand.
The chart shows several short liquidity hunts above swing highs (grey ellipses) and subsequent strong selling — classic stop-hunts into supply then continuation lower.
Imbalances / small supply boxes on the chart mark places the market tends to retest before continuing — these are high-probability sell zones on rallies.
The sequence of lower highs and a recent push down to ~96.83 (buyer defence) gives a local support but not yet a valid reversal signal. Until price chops through the weekly void (96.478) or reclaims the supply, expect range/biased-down behavior.
------------------------------------------------
Trade setups (actionable — use your 5-min/1-min workflow)
I’ll give two primary setups: a higher-probability short (sell the rally) and a contrarian long (mean-reversion). Use 5-min to identify displacement into the zone and 1-min for the exact micro reversal entry.
------------------------------------------------
Setup A — Primary: Short on rally into supply (preferred)
Why: Market structure + downside pressure + Imbalance above make rallies into supply favourable.
Area to enter (limit or wait for 1-min reversal): 98.00 – 98.20 (ideal limit ~98.10).
Stop loss: 98.45 (just above the 98.39 / structure swing and above the Imbalance top).
Targets (scale):
T1: 97.00 — first logical demand and psychological level.
T2: 96.50 — deeper swing support / mid structural level.
T3: 96.478 — weekly void bottom (big target if momentum continues).
Risk / reward (example entry 98.10 → stop 98.45):
Risk = 0.35 index points.
R:T1 ≈ 1.10 / 0.35 ≈ 3.14:1.
R:T2 ≈ 1.60 / 0.35 ≈ 4.57:1.
R:T3 ≈ 1.622 / 0.35 ≈ 4.63:1.
Trigger: 5-min displacement into the 98.0–98.2 zone, then 1-min rejection pattern (pin bar / engulf / two-bar reversal) and ideally a filled Imbalance or wick extension that fails. Enter limit at Imbalance top or use a short after 1-min confirmation.
------------------------------------------------
Setup B — Secondary: Mean-reversion long (countertrend)
Why: Buyers defended the 96.83 area previously; a clean, verified micro reversal at lower support can produce a quick retrace. This is lower probability vs the sell-the-rally plan and should be sized smaller.
Area to enter (limit/1-min confirmation): 96.75 – 96.95 (example limit 96.85).
Stop loss: 96.45 (below the 96.48 weekly void and the local wick).
Targets (scale):
T1: 97.40 (near recent chop / first structure).
T2: 97.99 (previous micro high).
T3: 98.39 (if momentum shifts to reclaim structure).
Risk / reward (example entry 96.85 → stop 96.45):
Risk = 0.40.
R:T1 ≈ 0.55 / 0.40 ≈ 1.38:1.
R:T2 ≈ 1.14 / 0.40 ≈ 2.85:1.
R:T3 ≈ 1.54 / 0.40 ≈ 3.85:1.
Trigger: Look for a 5-min exhaustion and 1-min clean micro reversal (two-bar bullish rejection) ideally with buy volume or a wick that holds. Keep size smaller than on shorts.
------------------------------------------------
Intraday scalp idea (quick)
Long scalp on a 1-min reversal after a displacement down to ~96.83 with tight stop under the wick (e.g. 5–8 ticks) and target 97.20–97.40. Use only if price shows clean microstructure and momentum.
Trade management rules
Positioning: Risk a fixed % per trade (e.g., 0.5–1% of account) and size accordingly. The short setup has high RR — size to risk tolerance.
Partial take: Take ~50% at T1, move stop to breakeven, let remainder run to T2/T3.
If price stalls at T1: tighten stop to lock profit or exit if structure shows weakness.
If price breaks and holds above 98.60 / 99.2: exit shorts and flip to neutral/bullish plan — the initial bearish thesis is invalidated.
Use your timeframe combo: identify the displacement on 5-min, execute 1-min entry confirmation.
------------------------------------------------
Invalidation / alternative scenario
Bearish invalidation: clean, sustained close above 98.6–99.2 (consolidation re-claim) — if that happens, the market likely shifts to bullish and short ideas should be abandoned.
Bullish trigger: rally above 99.2 with follow-through and a higher low -> targets back toward 99.8.
------------------------------------------------
Final prediction
Over the next sessions I expect failed rallies into 98.0–98.6 to be sold, which should gravitate price toward 97.00 → 96.50 → 96.48 if momentum confirms. Countertrend longs are possible as scalps/swing trades off 96.8–96.48, but they should be treated as lower-probability and sized smaller. If price instead reclaims and holds >99.2, the bearish bias is invalidated.

DXY Bearish Breakout! Sell!
Hello,Traders!
DXY is trading in a
Downtrend and the
Index made a bearish
Breakout of the key
Horizontal level of 97.200
So we are bearish biased
And we think that a
Further price decline is
Likely to happen
Sell!
Comment and subscribe to help us grow!
Check out other forecasts below too!
Disclosure: I am part of Trade Nation's Influencer program and receive a monthly fee for using their TradingView charts in my analysis.

DXY on 13 year support....Either we break down here, which will inevitably lead to a continuation of the rally in equities, or it's time to start hedging short. Either way it's decision time. I see more downside to the DXY personally, which fits the narrative of a blowoff top.
Famous last words.

DXYThe US Dollar Index remains in a downtrend. If the support zone breaks out, I expect the bearish trend to continue. Otherwise, if the price reaches the resistance zone, it could decline again.

Possibility of correction Given the behavior of the index within the current support range, possible scenarios have been identified. If the index breaks through the support range, a continuation of the downward trend is likely.
First day of the week and Dollar dropWith the market opening, the Dollar Index continued its decline and reached a key support level. However, I think it could bounce from this area and move up toward the middle of the range. We’ll have to see how long this level can hold the price, since the Dollar Index has been bearish for quite some time. ✅
DXY: Next Move Is Up! Long!
My dear friends,
Today we will analyse DXY together☺️
The recent price action suggests a shift in mid-term momentum. A break above the current local range around 96.860 will confirm the new direction upwards with the target being the next key level of 96.957 and a reconvened placement of a stop-loss beyond the range.
❤️Sending you lots of Love and Hugs❤️

Bearish drop formation?The US Dollar Index (DXY) is rising towards the pivot and could reverse to the 1st support.
Pivot: 98.63
1st Support: 97.12
1st Resistance: 100.21
Disclaimer:
The above opinions given constitute general market commentary, and do not constitute the opinion or advice of IC Markets or any form of personal or investment advice.
Any opinions, news, research, analyses, prices, other information, or links to third-party sites contained on this website are provided on an "as-is" basis, are intended only to be informative, is not an advice nor a recommendation, nor research, or a record of our trading prices, or an offer of, or solicitation for a transaction in any financial instrument and thus should not be treated as such. The information provided does not involve any specific investment objectives, financial situation and needs of any specific person who may receive it. Please be aware, that past performance is not a reliable indicator of future performance and/or results. Past Performance or Forward-looking scenarios based upon the reasonable beliefs of the third-party provider are not a guarantee of future performance. Actual results may differ materially from those anticipated in forward-looking or past performance statements. IC Markets makes no representation or warranty and assumes no liability as to the accuracy or completeness of the information provided, nor any loss arising from any investment based on a recommendation, forecast or any information supplied by any third-party.

DXY key levels to look out for this weekDXY key levels to look out for this week, FOMC, chart segregated into days of significance.

DXY Weekly Fundamental factors: The US domestic economy and the imposition of additional tariffs on consumer goods from China and Russia, as well as the confidence building of global opinion that the US will not start a war, all of these factors can help the index grow.
Technical factors: The oversold situation and the gap between the Keysin and Tensin lines increased, as a result, there is a possibility of price growth.
DXY FRGNT WEEKLY CHART ANALYSIS - DXY Q3 W38 Y25🌍FRGNT WEEKLY CHART ANALYSIS - DXY Q3 W38 Y25
📊 DXY FRGNT Breakdown + Impact on GBP, EUR, and Cross Pairs
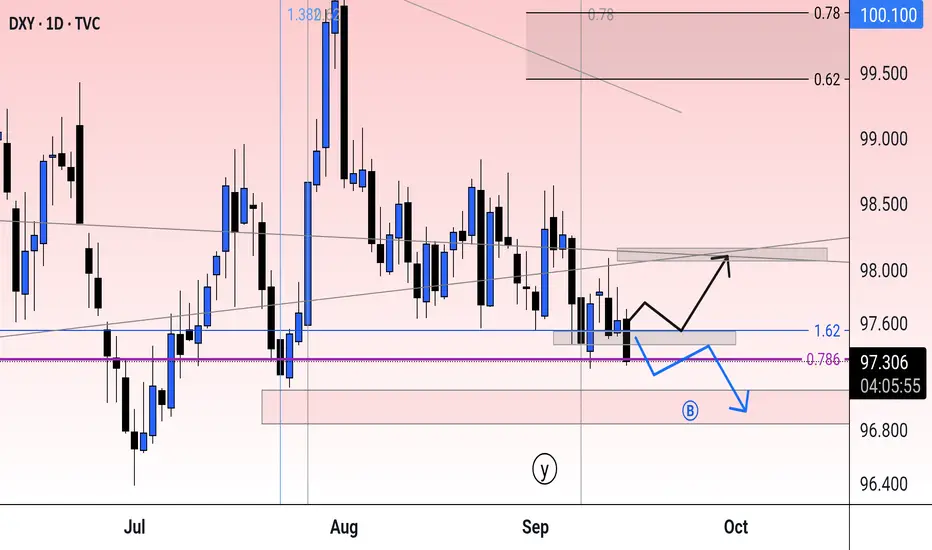
1. Higher Timeframe Context (Weekly)
Trend: Bearish → clear lower highs & lower lows since mid-summer.
Unmitigated Imbalance (IMB): 99–101 zone above current price → acts as a long-term liquidity magnet but not yet tested.
Bias: Weakness dominates until price proves otherwise.
2. Daily Timeframe
Supply Zone: 98.200–98.500 (aligns with Daily 50 EMA).
Demand Zone: 96.800–97.000 (next liquidity draw).
Expectation: Retrace into 98.2 supply, then continuation lower toward 97.0 demand.
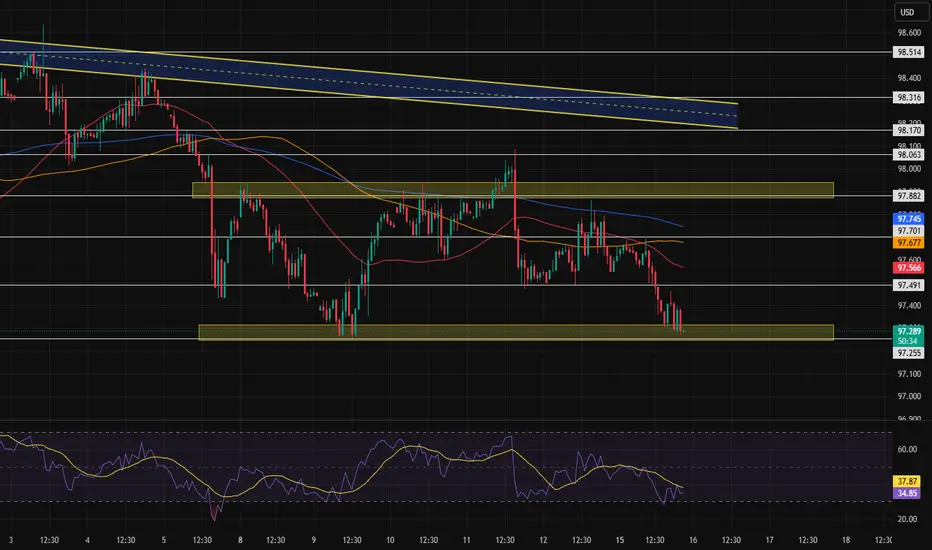
3. Intraday (4H)
Supply Overlap: 97.800–98.200 (Daily + 4H confluence).
Structure: Still bearish, repeated rejections from the 50 EMA.
Projection: Price likely taps 98.0 area, then drives into 97.0 demand.
Summary
Bias: Bearish.
Watch for liquidity sweep above 98.0 → rejection → sell setups toward 97.0 demand.
🌍 Impact on GBP, EUR, and Cross Pairs
GBPUSD
Effect: Dollar weakness supports bullish setups.
Expect retrace into 1.2670–1.2720 demand before price extends higher.
Targets: 1.2800–1.2850, with potential stretch toward 1.2950.
Narrative: As long as DXY stays capped under 98.2, GBPUSD should continue higher.
EURUSD
Effect: Also benefits from USD weakness, though less aggressively than GBP.
Look for longs around 1.0850–1.0880 demand.
Targets: 1.0950–1.1000.
Narrative: Similar structure to GBPUSD, but GBP is likely to outperform EUR.
EURGBP
Effect: GBP stronger than EUR → bearish bias.
Shorts valid below 0.8520, aiming for liquidity under 0.8430–0.8450.
Narrative: Even if both EUR and GBP rise against USD, GBP is leading.
Other USD Cross Pairs
USDJPY: Likely to weaken, targeting 144.50–145.00 liquidity.
USDCAD: Bearish pressure, could reach 1.3600 demand.
USDCHF: Lower toward 0.8850–0.8900 demand.
✅ Overall Picture
DXY Bearish = Favor longs on GBPUSD & EURUSD.
GBP stronger than EUR = EURGBP shorts are attractive.
JPY & CHF weak = Pairs like GBPJPY and EURJPY can push higher.
👉 In short: DXY’s weakness is the engine, driving GBPUSD and EURUSD higher. The Pound has the edge, making EURGBP a sell candidate while GBPJPY becomes a standout buy.
TVC:DXY
FRGNT

US Dollar: Upside Price Target vs. GoldSince the historic print low of 70.69 in 2008, the US dollar has risen more than 55% to its current levels north of 110. There is no telling just how high the dollar can run amid the parabolic move upward from its 2021 low. An inverse head and shoulder pattern suggests a minimum upside price target of 117.64 or around 7% north of current levels. Fibonacci time cycles portend potential turning points this October and in November 2023. Despite all the headline inflation, the rise in the dollar is, by definition, deflationary. This suggests that given inflation remains steadily on the rise, the dollar needs to go significantly higher for its deflationary effects to manifest in the real economy. One item of particular note is the dollar-based price of gold today vs. at the dollar lows in 2008. At the all-time lows of 2008, Gold was trading in the $800-$1000 range. Contrast that to today, with a dollar that is 55% higher, and we see Gold trading at $1700. That says a lot about Gold's ability to hold its value amid a rising dollar, which is typically bearish for Gold.

LONG OPPORTUNITYin daily tf market price form hhs and hls
in monthly tf there is bullish engulfing cs formation
general market trend is uptrend

Will the US Dollar Run?Here we have a classic invert head and shoulders in validated if we take out the previous higher lows, but with how things are going, I don't see that happening, especially with Trump being in office you can argue all you want, but the charts don't lie

DXY week 14/09/2025Even last week we close near to the NWOG, I still see a dxy under the 97 I don’t want to see dxy over the 97,800 I expect a reaction to the down side taking PDL and a retest to continue lower.

Pre-FOMC Crossfire US DOLLAR INDEXPre-FOMC Dollar War Map
The weekly chart just printed a fourth straight lower high—
a slow grind down while Friday’s close stayed red.
Liquidity is stacked behind us, perfect fuel if the desks want to run stops before the Fed.
Order flow shows massive resting bids around 96.962, the last structural block.
If that line cracks, expect the move to be fast and brutal.
Cross-markets are whispering the opposite:
equities, metals, and crypto are coiled to run if the dollar slips.
The headlines will call it a surprise.
It isn’t. The map was drawn weeks ago.
Focus on levels, not noise.
Trade the reaction, not the prediction.
DXYDXY has got a potential to give us correction and push up if FOMC will be dropping the Dollar.
Disclosure: We are part of Trade Nation's Influencer program and receive a monthly fee for using their TradingView charts in our analysis.

BULL RUN IS NEAR TO OVER! We are at the last stage of this bull run in my opinion. Now everything will go crazy.
Always when TVC:DXY hits its major context support, the bullrun is over
IMO the green box will be the area to sell and run from crypto as fast as possible! Around $94! #btc #altseason

DXY 4HTrading Outlooks for the Week Ahead
In this series of analyses, we review short-term trading outlooks and perspectives.
As can be seen, in each analysis there is a key support/resistance zone close to the current price of the asset. The market’s reaction to or breakout from these levels will determine the next price movement toward the specified targets.
Important Note: The purpose of these trading outlooks is to highlight critical price levels ahead and the market’s potential reactions to them. The analyses provided are by no means trading signals!

The Buck’s Getting Bucked“Rule #1: Respect Bitcoin.
Rule #2: When you think you’ve respected it enough…double it.
Big players like BlackRock manage trillions of dollars.
They usually keep their money in things like U.S. dollars and government bonds because that’s been the “safe spot” forever.
But the dollar keeps losing buying power and the U.S. keeps adding debt.
So these big funds are starting to put a small slice of their cash into Bitcoin—a digital money that nobody can print more of.
It’s not that the dollar is disappearing tomorrow.
They just want a backup that can’t be inflated away.
When companies with that much money start buying, it makes Bitcoin look less like a fad and more like the next big “store of value.”
