Dollar Index Stock Chart Fibonacci Analysis 091125Trading Idea
1) Find a FIBO slingshot
2) Check FIBO 61.80% level
3) Entry Point > 97.4/61.80%
Chart time frame:B
A) 15 min(1W-3M)
B) 1 hr(3M-6M)
C) 4 hr(6M-1year)
D) 1 day(1-3years)
Stock progress:A
A) Keep rising over 61.80% resistance
B) 61.80% resistance
C) 61.80% support
D) Hit the bottom
E) Hit the top
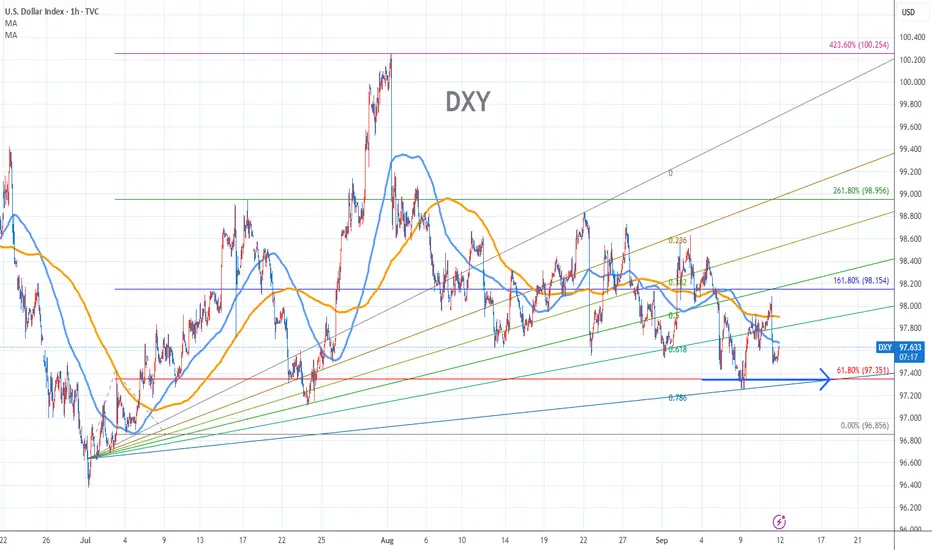
Stocks rise as they rise from support and fall from resistance. Our goal is to find a low support point and enter. It can be referred to as buying at the pullback point. The pullback point can be found with a Fibonacci extension of 61.80%. This is a step to find an entry-level position. 1) Find a triangle (Fibonacci Speed Fan Line) that connects the high (resistance) and low (support) points of the stock in progress, where it is continuously expressed as a Slingshot, 2) and create a Fibonacci extension level for the first rising wave from the start point of the slingshot pattern.
When the current price goes over the 61.80% level, that can be a good entry point, especially if the SMA 100 and 200 curves are gathered together at 61.80%, it is a very good entry point.
As a great help, TradingView provides these Fibonacci speed fan lines and extension levels with ease. So if you use the Fibonacci fan line, the extension level, and the SMA 100/200 curve well, you can find an entry point for the stock market. At least you have to enter at this low point to avoid trading failure, and if you are skilled at entering this low point, with the fibonacci6180 technique, your reading skill of to chart will be greatly improved.
If you want to do day trading, please set the time frame to 5 minutes or 15 minutes, and you will see many of the low points of rising stocks.
If you prefer long-term range trading, you can set the time frame to 1 hr or 1 day
USDX trade ideas
DXY Long/Short The movement of the dollar index may be influenced by the dynamic interactions between buyers and sellers, as assessed using the harmonic crab algorithm.

Renewed decline of the Dollar IndexBefore today, the dollar was trying to break out of the range box, but after the news, it fell back inside the range. It is expected to return to the bottom of the range, and if the trend continues this way, there is also a possibility of breaking down below the range. ✅

U.S. Dollar Index (DXY) into Core CPI — key levelsContext (macro)
PPI is upstream; CPI is what the market prices. Core CPI at 08:30 ET (14:30 SAST) will set the near-term path for the USD, UST yields, gold, and risk assets. The tape is positioned for a directional move outcome depends on whether core inflation is softer, in-line, or hot.
Daily DXY chart
Structure: An inverse head-and-shoulders completed into late July with a clear break of structure. Since then, price has flagged back inside the prior value area in a descending channel, sitting mid-range.
Range: Roughly 97.3–98.6 is the active box.
Liquidity markers:
Swing low: ~97.1–97.3 (recent liquidity sweep).
Swing high: ~100.0–100.5 (unresolved liquidity from July spike).
Bias from structure: Post-break bullish continuation is favoured if the channel resolves up, but repeated supply above 98.5 means confirmation matters.
Levels that matter:
Support: 97.30–97.40 (range floor). Beneath that: 97.10, then 96.60 (the “head” low).
Resistance: 98.40–98.60 (range cap). Above: 98.90–99.10 (channel top/throw-over), then 100.0–100.5 (swing-high liquidity).
Event-driven scenarios (Core CPI 08:30 ET / 14:30 SAST):
Soft CPI (sub-consensus core)
Reaction path: USD offered → DXY breaks 97.30 → 97.10 test; follow-through opens 96.60.
Confirmation: A 4H close below 97.30 that fails to reclaim on retest.
Cross-asset: UST yields down, gold up, risk bid; EUR, GBP, commodity FX supported; USDJPY heavy.
In-line CPI (near consensus)
Reaction path: First move likely fades; range persists 97.8–98.2 with whipsaws. Market waits for next catalyst (Fed speak/data).
Tactics: Fade extremes of the box until a daily close breaks 97.30 or 98.60.
Hot CPI (above consensus core or sticky services)
Reaction path: USD squeezes → clean break and hold above 98.60 → attack 98.90–99.10. Sustained acceptance above 99.10 puts 100.0–100.5 back in play.
Confirmation: Daily close above 98.60, followed by shallow pullbacks that hold former resistance as support.
Cross-asset: UST 2s/10s yields up, gold pressured, risk off; EUR/GBP slip; USDJPY supported with yields.
Trading plan logic (not advice):
Bullish continuation trigger: Daily close > 98.60, then hold 98.40–98.60 on retest. Targets 98.90–99.10, extension 100.0–100.5.
Bearish breakdown trigger: 4H close below 97.30 and failed reclaim. Targets 97.10 then 96.60.
Invalidations: For longs, a shove back inside the channel that loses 98.10 after a breakout. For shorts, inability to hold below 97.30 within 1–2 sessions post-break (bear trap risk around CPI).
Why this setup matters:
We’ve got compression inside a descending channel parked on prior value. CPI is the release valve. Don’t anchor on the first spike; wait for acceptance beyond 98.60 or 97.30 to avoid getting chopped.

LIQUIDITY GAMES: DOLLAR HOLDS THE LINE WHILE CRYPTO SURGESWe head into a heavy news flow week with CPI Thursday and the FOMC next Wednesday. It’s easy to expect continuation of bearish economic data — but don’t think for a second that news alone will simply make price drop.
The dollar has been holding and absorbing both sides of the market for the past month. This kind of structure often creates the opposite effect of what headlines suggest. While traders lean bearish, the dollar could easily run higher into mid-range before rolling over.
We’ve seen this pattern before — gold rush movements and Bitcoin rallies that unfold without the dollar moving. It’s planned this way, building liquidity by trapping both sides.
From a CORE5 perspective:
– Structure → BTC is pressing toward the 124K liquidity zone, while DXY consolidates in balance.
– Dynamic Symmetry → rallies and pullbacks are aligned; watch for rotation if dollar squeezes higher.
– Volume & Order Flow → Bitcoin flows remain elevated, but sustainability hinges on post-CPI reactions.
– Confluence → Risk pairs remain vulnerable if DXY snaps higher, despite crypto’s relief bid.
Beaware - In weeks like this, price action around news is designed to confuse. Stay focused on structure and confluence, not headlines.
Trading is only fun when you’re on the winning side — guessing usually lands you on the other

DXY MONTHLY CHART- EVERYTHING SEEMS QUITE BULLISH!From the monthly timeframe, everything seems quite bullish. As traders are optimistic about dollar growth. Technically, price support bullish rebound as price is seen testing a very nice trendline. I expect a dovish USD

DXY - My Detailed Bull Thesis Going ForwardDear Friends in Trading,
How I see it on a 12HR Time Frame.
(To follow my findings so should you)
RSI:
4HR = above 50% - 14sma supported
12HR = just below but right at 50% - 14sma supported
SUPPORT:
The purple line represents a multi layered support area created by HUGE demand.
It is the THRESHOLD of institutions and surely the US Government.
I have indicated the multiple "demand" rejections - UP in recent history.
BACK TEST: (Please see for yourself how price reacted from this support)
1st of MARCH 2022 - 31st of March 2022
Yes, that is the previous time price was where it's at now.
1) 1st of March just below support line, there is a FVG formed.
2) I have drawn this FVG all the way to today - LIGHT BLUE
3) Then look how what price reacted above the purple line once it breached the confluence.
MY SUMMARY:
For 3 and a half years that FVG have been accumulating demand to hold the INDEX UPWARD.
Price can definitely dip into BLUE FVG to muster a "REVERSAL SHOT/BOUNCE" out of the hole.
Price can also just do a "BOUNCE" reversal from the current support and rally to compensate for the pending rate cut later this month.
I sincerely hope my point of view offers a valued insight.
Thank you for taking the time study my analysis.

DXY near or already end of downtrendDXY near or already end of downtrend
Technical perspective
DXY continues to hold above its 14-year ascending trendline, reinforcing the grand cycle uptrend.
Price is consolidating above this support after a bullish divergence, with RSI suggesting reversal potential.
However, in the short term, it may continue to move sideways, as indicated by parallel EMAs.
A decisive close below the long-term support near 96.00 would shift sentiment sharply bearish.
Macro perspective
In the short term, USD is stabilizing as traders await August CPI data and the Fed’s policy decision, key drivers for DXY’s next move.
Market sentiment could turn more bullish once the Fed’s rate cut is realized, as dovish expectations are fully priced in which could trigger a reversal.
US Treasury yields have been declining, reflecting recovered demand for dollar-denominated assets.
Meanwhile, heightened geopolitical tensions across multiple regions are reinforcing the USD’s role as the world’s most liquid safe-haven currency.
Analysis by: Krisada Yoonaisil, Financial Markets Strategist at Exness

Bearish reversal off 61.8% Fibonacci resistance?The US Dollar Index (DXY) is rising towards the pivot which aligns with the 61.8% Fibonacci retracement, and could reverse to the 1st support.
Pivot: 98.11
1st Support: 97.36
1st Resistance: 98.47
Disclaimer:
The above opinions given constitute general market commentary, and do not constitute the opinion or advice of IC Markets or any form of personal or investment advice.
Any opinions, news, research, analyses, prices, other information, or links to third-party sites contained on this website are provided on an "as-is" basis, are intended only to be informative, is not an advice nor a recommendation, nor research, or a record of our trading prices, or an offer of, or solicitation for a transaction in any financial instrument and thus should not be treated as such. The information provided does not involve any specific investment objectives, financial situation and needs of any specific person who may receive it. Please be aware, that past performance is not a reliable indicator of future performance and/or results. Past Performance or Forward-looking scenarios based upon the reasonable beliefs of the third-party provider are not a guarantee of future performance. Actual results may differ materially from those anticipated in forward-looking or past performance statements. IC Markets makes no representation or warranty and assumes no liability as to the accuracy or completeness of the information provided, nor any loss arising from any investment based on a recommendation, forecast or any information supplied by any third-party.

Strength of the $The U.S. dollar is facing a rare convergence of structural and cyclical headwinds in 2025, and analysts expect its decline to continue into 2026. Here’s a breakdown of the most influential factors driving the dollar’s weakness:
---
## 📉 Key Drivers of Dollar Decline
### 1. **Federal Reserve Policy Shift**
- The Fed is expected to cut rates by 25–50 basis points due to soft labor data and rising unemployment (now at 4.3%).
- Lower interest rates reduce the yield advantage of dollar-denominated assets, making them less attractive to global investors.
### 2. **Surging U.S. Debt and Treasury Issuance**
- Debt-to-GDP is approaching **130%**, one of the highest in history.
- Massive Treasury issuance to fund deficits is creating bond market volatility and investor fatigue.
- Foreign holders are increasingly hedging or reducing exposure to U.S. debt.
### 3. **Political and Fiscal Uncertainty**
- Post-election trade policies, tariff announcements, and fiscal gridlock have eroded confidence in U.S. governance.
- Currency traders are pricing in higher risk premiums for U.S. assets.
### 4. **Global De-Dollarisation Trends**
- BRICS nations and others are settling trade in non-dollar currencies like the yuan.
- The dollar’s share of global FX reserves has dropped to ~58%, down from 71% in 2000.
- This shift is accelerating as geopolitical blocs strengthen outside the U.S. orbit.
### 5. **Safe-Haven Rotation**
- Investors are diversifying into gold, commodities, and crypto:
- Gold has surged past **$3,600/oz**, with projections up to $5,000.
- Bitcoin and Ethereum are gaining traction as digital hedges against fiat depreciation.
---
## 🧠 Strategic Implications
- **Import inflation**: A weaker dollar makes foreign goods more expensive, pressuring consumer prices.
- **Export boost**: U.S. goods become more competitive abroad, which could help manufacturing.
- **Asset reallocation**: Global investors may shift toward emerging markets, commodities, or alternative currencies.

DXY Head and Shoulders Retest H4Change of bias on DXY - if the current bounce of price in support is a retest of this H&S pattern then we may see prices fall to the 94 - 95 region.
NB: the upward-facing arrow is just a rough estimation of the retest target. Prices may fall from a much lower level than that.

Tomorrow’s important newsToday’s news didn’t cause much movement, but tomorrow’s news will definitely bring strong volatility, enough to even change the trend in some currency pairs. ✅

DXY - Major Breakdown of bearish StructureDXY has broken down and is currently retesting a breakdown of this major ascending channel on the weekly - monthly time frame.
Applying this to equities and Bitcoin - we can anticipate a bull run spanning 3-6 years approximately.
Due to the major event of this retest here - I expect that Bitcoin and manipulated markets will see a flash crash of severe magnitude, popping the balloon of the over- leveraged market caps.
No black swan is needed to see this take place on Bitcoin. The charts been rising steadily and holding since 2023 - this attracts long leveraged positions and consequently their stop loss orders. Sell orders are cascading in the chart all the way down to 10,000 - and only fill when price crosses.
This is the event that will pop the bubble before we see stability in the bull run. I don’t expect the equities markets to drop substantially at all - rather I believe we will continue to rise for 3-6 years coinciding with DXY breakdown.
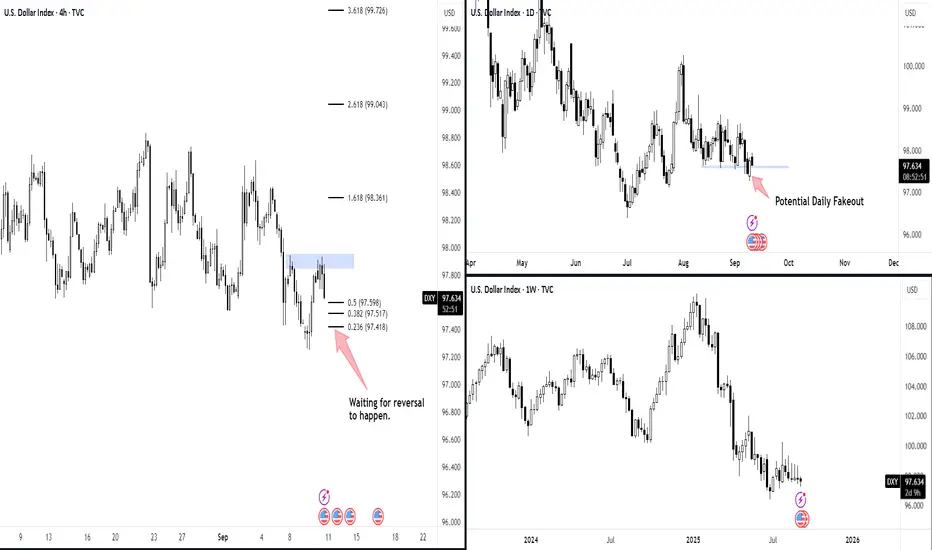
DXY – Potential Bullish Bias: Daily Fakeout & H4 ReversalThe Dollar Index (DXY) is showing signs of a possible bullish reversal.
On the Daily timeframe, price has swept below support and is now indicating a potential fakeout. This often signals trapped sellers and can provide fuel for a bullish recovery if price reclaims above the broken level.
On the H4 timeframe, I see a V-shape continuation pattern forming. Price has also made multiple retests in the same zone, showing strong buying interest. This confluence strengthens the bullish bias.
For execution, I will wait for a clear reversal signal on H4 (such as a strong bullish engulfing candle or momentum break) before confirming the entry. If the reversal holds, the next upside targets could align with the Fib extension levels (1.618, 2.618, and 3.618).
Risk management remains key – if price fails to hold the fakeout level, then the bearish trend may still continue.
Disclaimer: This is not financial advice or a trade call. Analysis shared here is for educational purposes only. Please manage your own risk accordingly.
INDEX_DXY_1DDollar Index Analysis The Dollar Index has completed five downwaves on the Daily timeframe according to Elliott waves and it is possible that we are at the end of the downwave and can enter a new phase of the upwave and move towards the number 105.50. At the resistance of this reaction on the Dollar Index, it can react on the currency pairs. The market is in a big turn

DXY - Updated trade (10sept)Still the very same outlook like the previous DXY trade only difference is that we re-entered at the very same price and extended SL below the LQC(candle that swept liquidity) and took our TP abit higher

DXY ready to resume downtrend!97.94 Level on DXY is a high liquidity zone as in the falling market there is bounce off to 97.937. Price grabbed liquidity and started to drop again to the major direction of the trend. As it is a long term down trend and price just rejected from a high liquidity zone, it is a high probability price may continue to drop to this support level as multiple timeframe trend is bearish.

DXY Trade Outlook – Sept 10, 2025DXY currently sits at a critical zone with mixed timeframe confluence:
Weekly: Bearish bias still intact.
Daily: Bullish structure after tapping into POI.
4H: Bearish at extreme POI.
Key Note:
Not expecting a strong close below 97.80, although intraday spikes may occur. Watching for confirmation before directional commitment.
Outlook: Neutral-to-bullish bias in the short term, but bigger picture remains capped by higher-timeframe bearish structure.

uptrendThe downward trend in the current support range is expected to end and we will witness the beginning of the upward trend.
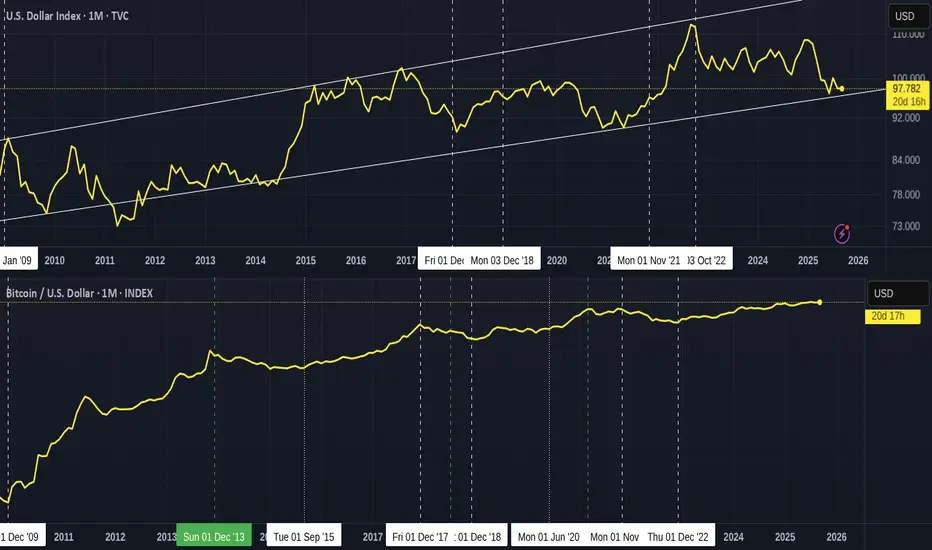
DXY and Bitcoin since 2009 - compare PA and see possible paths
This is a very clear Chart with the DXY Index on top and the Bitcoin Index below, Both starting in 2009.
You tell me which is more volatile.
Things to take note of here
See how, Most of the time, when DXY Rises, Bitcoin Drops.
Compare the dates on both charts and see this.
And what REALLY needs to be paid attention to Right now is how the DXY is back on its lower trend line of Support.
It has bounced off this trend line many times since 2009
We maybe about to see another one anytime between now and Dec.
The interesting thing about this is simply that should the FED Cut Rates next week, this reduces the desire to hold $ as returns are diminished.
This would Drop the DXY below the support it created in 2008.
The chart below shows DXY since 1973 and what happened on major rate cuts
As you can see, nearly Every time, DXY Drops when Rates are cut.
So, The question is this.
If The FED drops rates, will DXY Drop below a strong line of support and BTC Rise as Risk becomes cheaper. ?
OR
Will DXY go against the tradition, bounce off support and Rise as Rates lower the cost of borrowing the $ and industry investment grows ?
This could also lead to an increase in investment in Bitcoin.
For Bitcoin, there are many things that say we are near a Top but still have room to move higher.
But there are also a number of things that point towards the pattern of previous cycles are changed. The ETF system leading to Bitcoin being bought and Held, stopping the massive price swings could be a major factor.
Look what happened to GOLD after the ETF were allowed in 2004
The asset has Risen ever since. But it has to be said, Bitcoin % of profit since 2009 is Many Many times more than Gold !
We are at a crossroads for all these assets
Next week the FED tells us if they will Cut rates as expected.
We will then see how Markets react
Hang on tight Ladies and Gents.
We have some interesting days ahead.
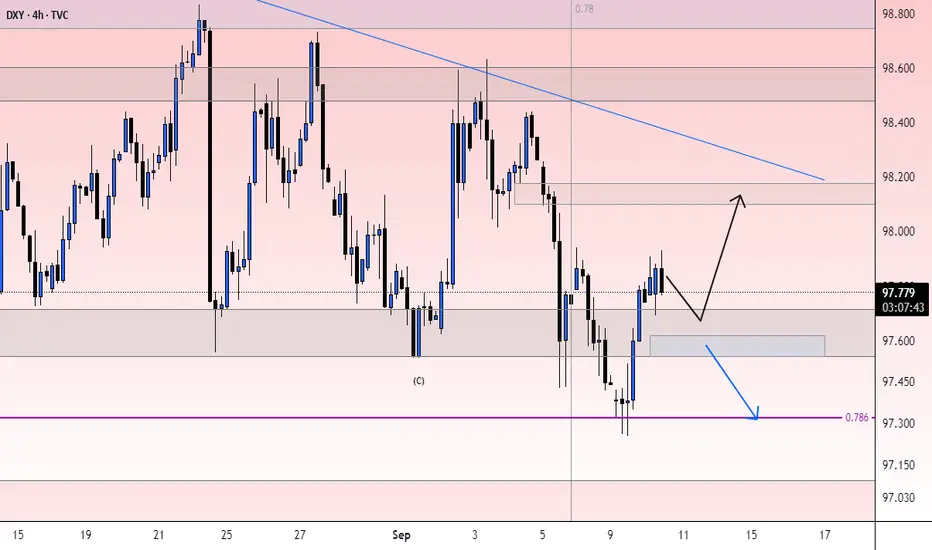
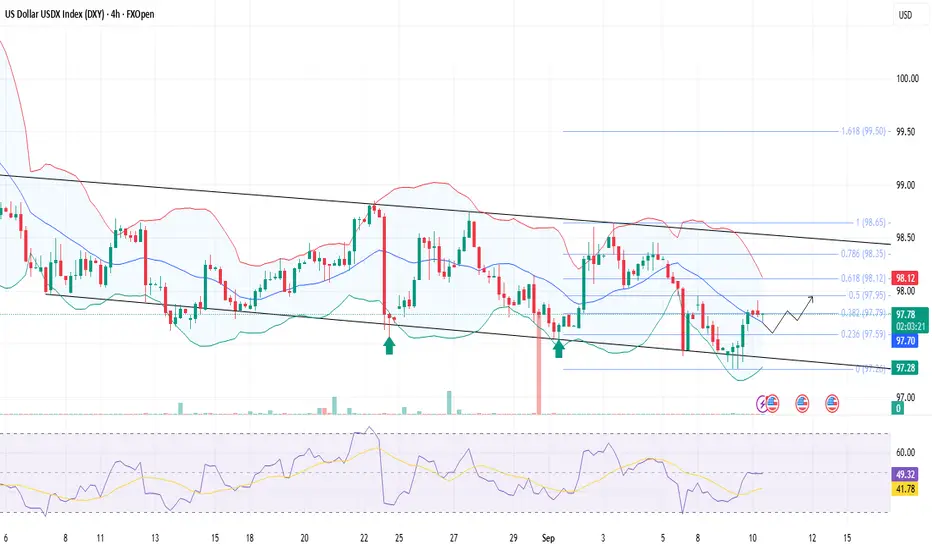
Brief Analysis of US DXYDXY is trading around 97.70, while trending within a descending channel formation, and holding above 97.60 (Fib support 0.236), with resistance seen near 97.80–98.00 zone.
The RSI is rising and holding near 46, showing mild recovery momentum but not yet strong enough for a breakout.
However, prices have taken a support at the middle Bollinger band, which might lift the dollar a little higher.
Price action suggests consolidation inside the descending channel; intraday bias stays neutral-to-bullish above 97.60.
PPI data stronger than expected could lift DXY toward 98.35–98.50, while weaker data may pressure it back toward 97.30.
The 10Y auction outcome will also guide direction — higher yields can support the dollar, while softer demand may weigh on it.
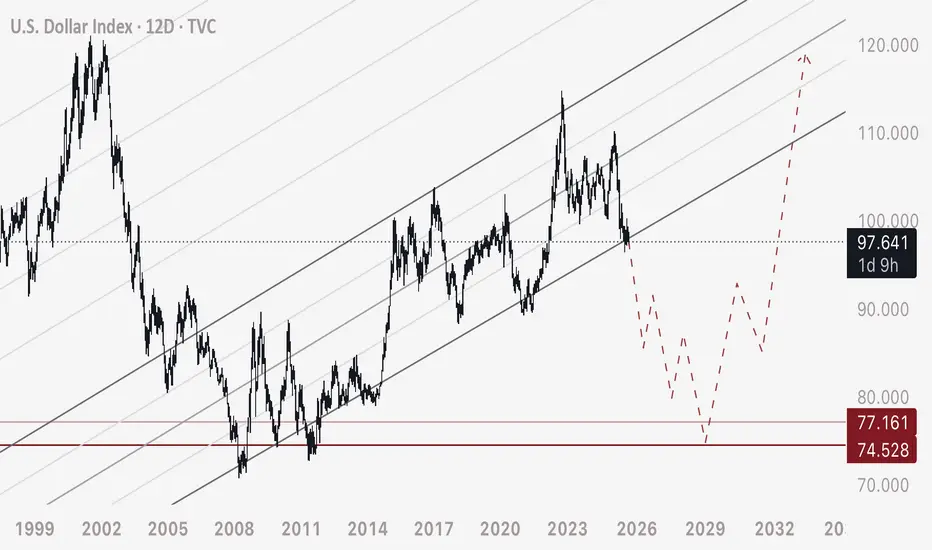
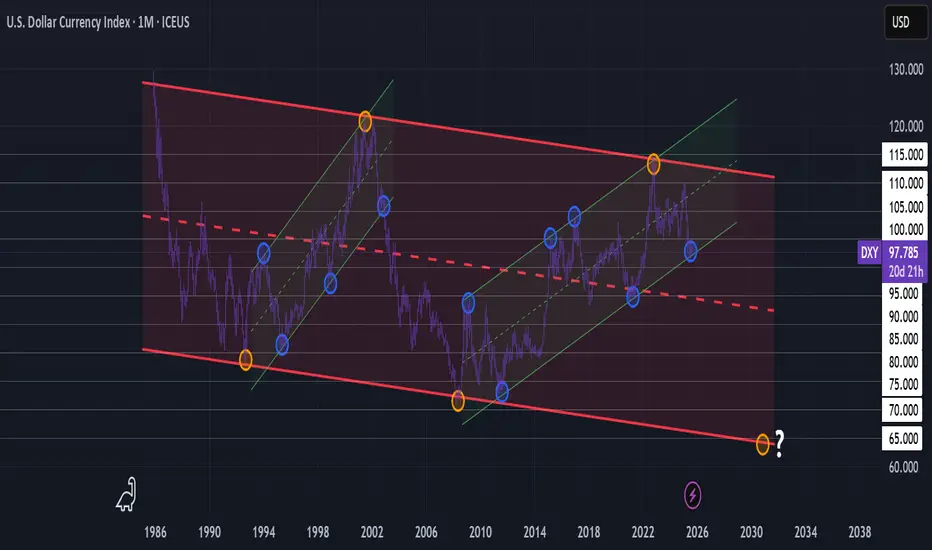
Implausible until it's not? Zoom out $DXY.On the high time frames, the dollar is trading inside a long-term descending channel that dates back decades. The rally into a rising channel has been previously followed by a decline 2002-2008. The most recent rejection from the channel’s upper trend in 2022–2023 suggests that momentum could shift toward the downside, with our next macro target lying near the bottom of the range. We've already broken below our major whole of 1.00 and retested.
Recent NFP data shows a cooling labor market. Slowing job growth and downward revisions might point to a break in momentum. A softer labor market reduces the Fed’s ability to maintain higher rates, undermining DXY strength. Beyond employment, consumer spending is showing cracks while business investment is being pressured by higher borrowing costs. If growth becomes stagnant, the immediate appeal of the economy could weaken, reducing foreign capital that support the dollar. Other factors may include tariffs, policy shifts, or deficits.
When both macro fundamentals and technical structure align, the case for a dollar decline strengthens. While near-term volatility is always expected around Fed shifts and global risk, the high-time-frame view points to the possibility of a downtrend that could extend into the months or possibly years to come.
Eyes peeled for an inverse crypto-winter.
Good reaction on supportAs we mentioned in the previous analysis, the price was correctly rejected after touching the resistance, and now it has also shown a very good reaction on the support. The price has risen nicely, creating a great setup for us. For re-entry, we need to wait until another structure forms
