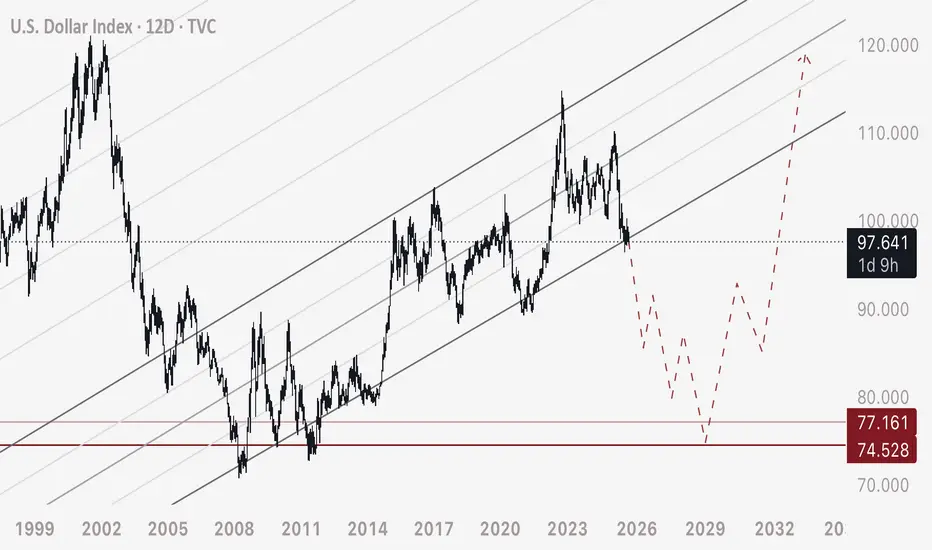
DXY - Major Breakdown of bearish StructureDXY has broken down and is currently retesting a breakdown of this major ascending channel on the weekly - monthly time frame.
Applying this to equities and Bitcoin - we can anticipate a bull run spanning 3-6 years approximately.
Due to the major event of this retest here - I expect that Bitcoin and manipulated markets will see a flash crash of severe magnitude, popping the balloon of the over- leveraged market caps.
No black swan is needed to see this take place on Bitcoin. The charts been rising steadily and holding since 2023 - this attracts long leveraged positions and consequently their stop loss orders. Sell orders are cascading in the chart all the way down to 10,000 - and only fill when price crosses.
This is the event that will pop the bubble before we see stability in the bull run. I don’t expect the equities markets to drop substantially at all - rather I believe we will continue to rise for 3-6 years coinciding with DXY breakdown.
USDX trade ideas
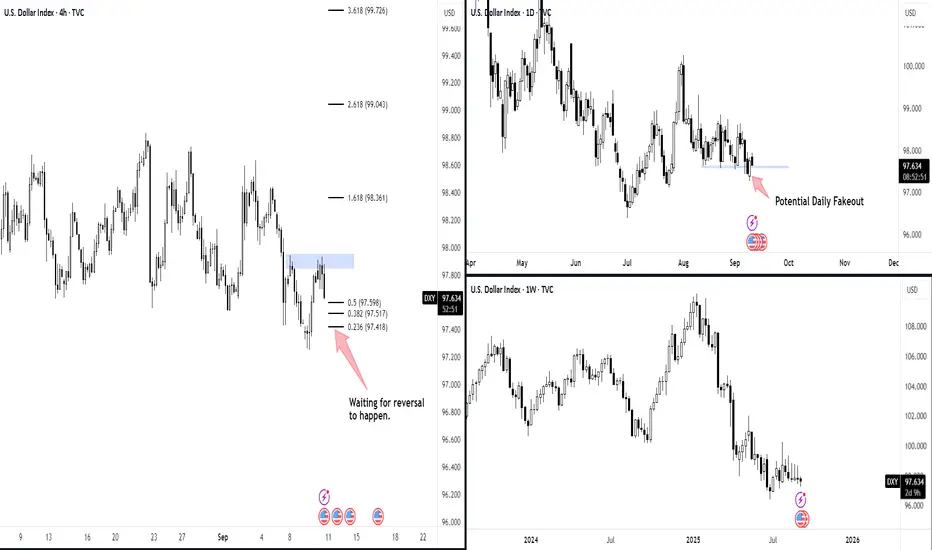
DXY – Potential Bullish Bias: Daily Fakeout & H4 ReversalThe Dollar Index (DXY) is showing signs of a possible bullish reversal.
On the Daily timeframe, price has swept below support and is now indicating a potential fakeout. This often signals trapped sellers and can provide fuel for a bullish recovery if price reclaims above the broken level.
On the H4 timeframe, I see a V-shape continuation pattern forming. Price has also made multiple retests in the same zone, showing strong buying interest. This confluence strengthens the bullish bias.
For execution, I will wait for a clear reversal signal on H4 (such as a strong bullish engulfing candle or momentum break) before confirming the entry. If the reversal holds, the next upside targets could align with the Fib extension levels (1.618, 2.618, and 3.618).
Risk management remains key – if price fails to hold the fakeout level, then the bearish trend may still continue.
Disclaimer: This is not financial advice or a trade call. Analysis shared here is for educational purposes only. Please manage your own risk accordingly.
INDEX_DXY_1DDollar Index Analysis The Dollar Index has completed five downwaves on the Daily timeframe according to Elliott waves and it is possible that we are at the end of the downwave and can enter a new phase of the upwave and move towards the number 105.50. At the resistance of this reaction on the Dollar Index, it can react on the currency pairs. The market is in a big turn

DXY - Updated trade (10sept)Still the very same outlook like the previous DXY trade only difference is that we re-entered at the very same price and extended SL below the LQC(candle that swept liquidity) and took our TP abit higher

DXY ready to resume downtrend!97.94 Level on DXY is a high liquidity zone as in the falling market there is bounce off to 97.937. Price grabbed liquidity and started to drop again to the major direction of the trend. As it is a long term down trend and price just rejected from a high liquidity zone, it is a high probability price may continue to drop to this support level as multiple timeframe trend is bearish.

DXY Trade Outlook – Sept 10, 2025DXY currently sits at a critical zone with mixed timeframe confluence:
Weekly: Bearish bias still intact.
Daily: Bullish structure after tapping into POI.
4H: Bearish at extreme POI.
Key Note:
Not expecting a strong close below 97.80, although intraday spikes may occur. Watching for confirmation before directional commitment.
Outlook: Neutral-to-bullish bias in the short term, but bigger picture remains capped by higher-timeframe bearish structure.

uptrendThe downward trend in the current support range is expected to end and we will witness the beginning of the upward trend.
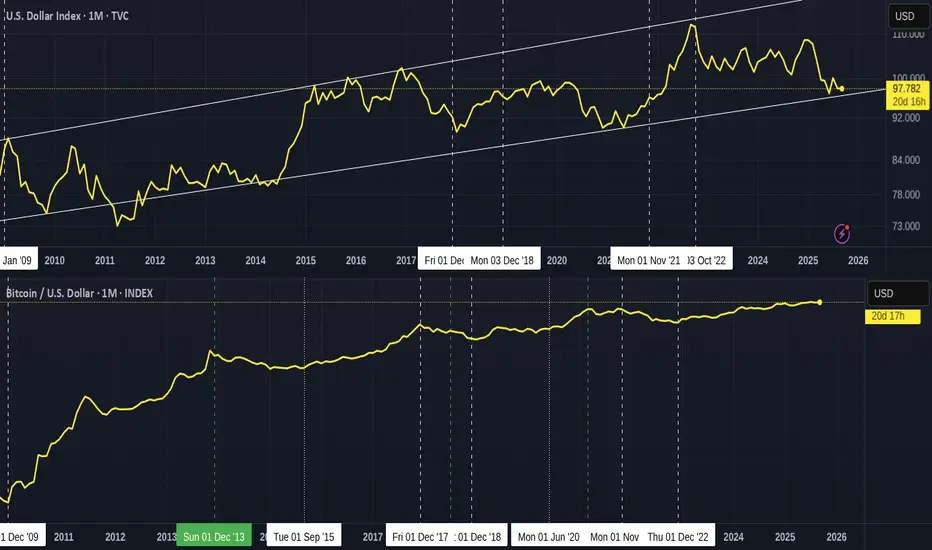
DXY and Bitcoin since 2009 - compare PA and see possible paths
This is a very clear Chart with the DXY Index on top and the Bitcoin Index below, Both starting in 2009.
You tell me which is more volatile.
Things to take note of here
See how, Most of the time, when DXY Rises, Bitcoin Drops.
Compare the dates on both charts and see this.
And what REALLY needs to be paid attention to Right now is how the DXY is back on its lower trend line of Support.
It has bounced off this trend line many times since 2009
We maybe about to see another one anytime between now and Dec.
The interesting thing about this is simply that should the FED Cut Rates next week, this reduces the desire to hold $ as returns are diminished.
This would Drop the DXY below the support it created in 2008.
The chart below shows DXY since 1973 and what happened on major rate cuts
As you can see, nearly Every time, DXY Drops when Rates are cut.
So, The question is this.
If The FED drops rates, will DXY Drop below a strong line of support and BTC Rise as Risk becomes cheaper. ?
OR
Will DXY go against the tradition, bounce off support and Rise as Rates lower the cost of borrowing the $ and industry investment grows ?
This could also lead to an increase in investment in Bitcoin.
For Bitcoin, there are many things that say we are near a Top but still have room to move higher.
But there are also a number of things that point towards the pattern of previous cycles are changed. The ETF system leading to Bitcoin being bought and Held, stopping the massive price swings could be a major factor.
Look what happened to GOLD after the ETF were allowed in 2004
The asset has Risen ever since. But it has to be said, Bitcoin % of profit since 2009 is Many Many times more than Gold !
We are at a crossroads for all these assets
Next week the FED tells us if they will Cut rates as expected.
We will then see how Markets react
Hang on tight Ladies and Gents.
We have some interesting days ahead.
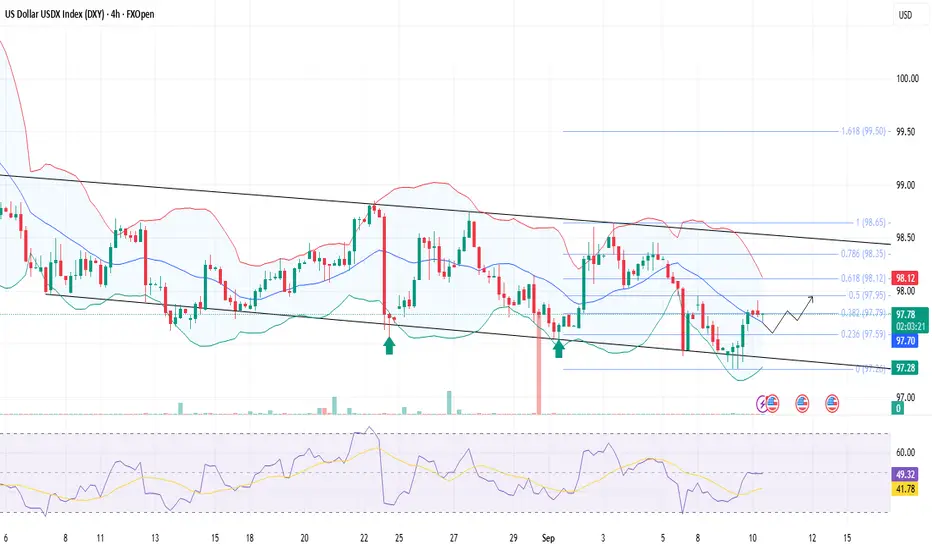
Brief Analysis of US DXYDXY is trading around 97.70, while trending within a descending channel formation, and holding above 97.60 (Fib support 0.236), with resistance seen near 97.80–98.00 zone.
The RSI is rising and holding near 46, showing mild recovery momentum but not yet strong enough for a breakout.
However, prices have taken a support at the middle Bollinger band, which might lift the dollar a little higher.
Price action suggests consolidation inside the descending channel; intraday bias stays neutral-to-bullish above 97.60.
PPI data stronger than expected could lift DXY toward 98.35–98.50, while weaker data may pressure it back toward 97.30.
The 10Y auction outcome will also guide direction — higher yields can support the dollar, while softer demand may weigh on it.
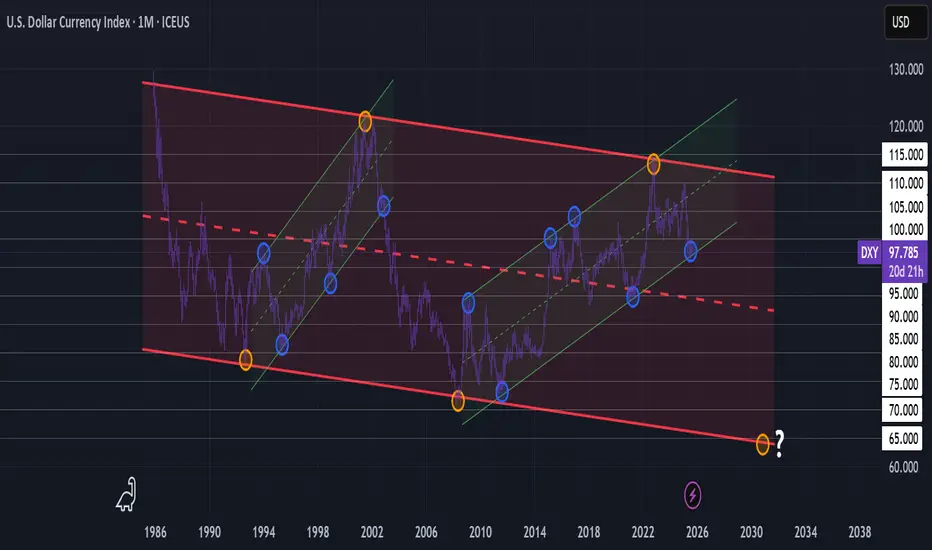
Implausible until it's not? Zoom out $DXY.On the high time frames, the dollar is trading inside a long-term descending channel that dates back decades. The rally into a rising channel has been previously followed by a decline 2002-2008. The most recent rejection from the channel’s upper trend in 2022–2023 suggests that momentum could shift toward the downside, with our next macro target lying near the bottom of the range. We've already broken below our major whole of 1.00 and retested.
Recent NFP data shows a cooling labor market. Slowing job growth and downward revisions might point to a break in momentum. A softer labor market reduces the Fed’s ability to maintain higher rates, undermining DXY strength. Beyond employment, consumer spending is showing cracks while business investment is being pressured by higher borrowing costs. If growth becomes stagnant, the immediate appeal of the economy could weaken, reducing foreign capital that support the dollar. Other factors may include tariffs, policy shifts, or deficits.
When both macro fundamentals and technical structure align, the case for a dollar decline strengthens. While near-term volatility is always expected around Fed shifts and global risk, the high-time-frame view points to the possibility of a downtrend that could extend into the months or possibly years to come.
Eyes peeled for an inverse crypto-winter.
Good reaction on supportAs we mentioned in the previous analysis, the price was correctly rejected after touching the resistance, and now it has also shown a very good reaction on the support. The price has risen nicely, creating a great setup for us. For re-entry, we need to wait until another structure forms

DXY: Target Is Up! Long!
My dear friends,
Today we will analyse DXY together☺️
The price is near a wide key level
and the pair is approaching a significant decision level of 97.331 Therefore, a strong bullish reaction here could determine the next move up.We will watch for a confirmation candle, and then target the next key level of 97.458.Recommend Stop-loss is beyond the current level.
❤️Sending you lots of Love and Hugs❤️

Dollar Inde: back in the range / potential move to >100Dollar Index is coming back in the range of the previous correction before the drop in the first 2 days of the week. As we're typing we still cannot rule out another small correction for more downside. However, as price proceeds to the upside, we will take a look at today's close: if price closes the daily candle above the previous 3 weeks low and the previous month low, we will start looking for buy setups all the way back to the 100 area, as previously discussed.
Stay tuned for more updates on short opportunities on EURUSD, GBPUSD and NZDUSD (this last one is technically not in the dollar basket but could have the potential for a nice drop too because the move could be dollar driven only).

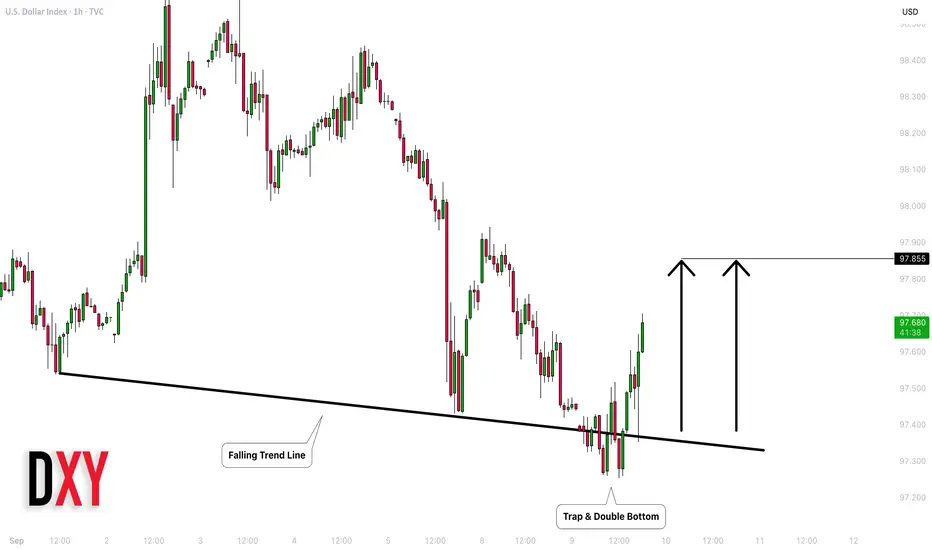
DOLLAR INDEX (DXY): Time to Recover
US Dollar finally shows a strength after a false violation
of a trend line and a formation of a double bottom pattern.
The index will most likely reach 97.85 level soon.
❤️Please, support my work with like, thank you!❤️
Dxy Chart LongBias
Fundamental
NFIB SmallBusiness Index Actusl Greater then Forecast
Technical
Double Bottom

BUY DXYIn todays session we will be taking buys on the dollar. Our entry is at 97.677 and stops are below 97.480 targets are above 98.40. Use proper risk management.

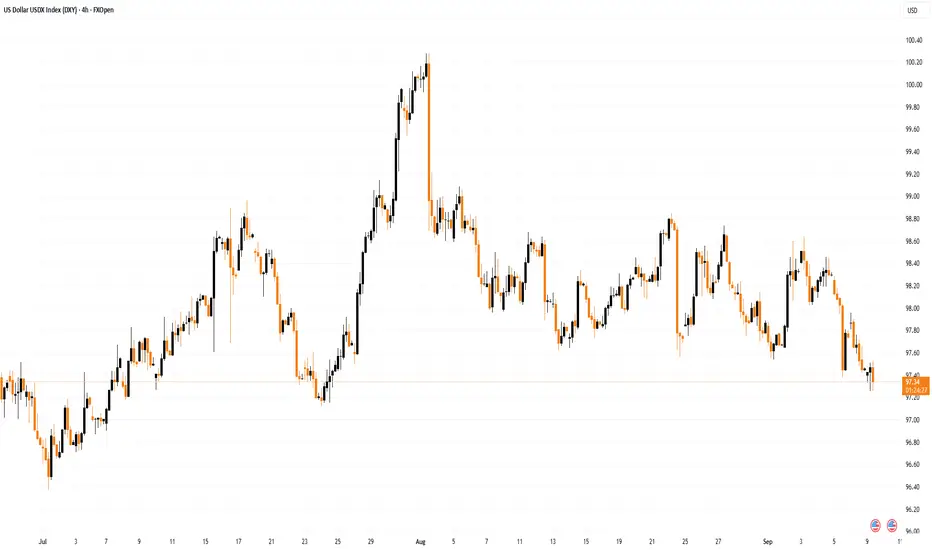
US Dollar Index Drops to 7-Week Low Ahead of Key Inflation DataUS Dollar Index (DXY) Drops to 7-Week Low Ahead of Key Inflation Data
As the US Dollar Index (DXY) chart shows, the value of the USD against a basket of other currencies has fallen below 97.30 – its lowest level since late July.
The reasons lie in market sentiment ahead of major data releases:
→ On Wednesday at 15:30 GMT+3, Producer Price Index (PPI) figures will be published; a month ago they came in extremely high.
→ On Thursday at 15:30 GMT+3, Consumer Price Index (CPI) figures are due.
These releases are particularly significant as next week the Federal Reserve is set to announce its decision on interest rates – a 25-basis-point cut is widely expected.
Technical Analysis of the DXY Chart
On 18 August, we identified a descending channel (shown in red) based on a sequence of lower highs and lower lows → it remains valid.
In addition, our base scenario suggested that the index might test one of the quartile lines (QL and/or QH) dividing the channel → indeed, since then the QH line has been tested several times (red arrow), convincingly acting as resistance.
What Next?
Bearish case:
→ Lower highs and lows throughout the second half of August indicate that sellers are in control of the DXY market.
→ The black arrow marks bearish momentum that broke through support at 98.05 last week.
→ The drop was sharp (a sign of imbalance in favour of sellers), and yesterday the 98.05 level acted as resistance.
Bullish case:
→ The DXY has dropped into the median zone, where supply and demand often balance. Buyers may step in, viewing current levels as attractive for entry.
→ The RSI may potentially form a bullish divergence.
→ The latest candle on the right shows a long lower wick (a bullish pin bar pattern), underlining buyers’ determination.
Given the above, we could expect the DXY to hover around the median area. However, the upcoming US inflation reports could trigger volatility across financial markets. A test of support at 97.15 could occur.
This article represents the opinion of the Companies operating under the FXOpen brand only. It is not to be construed as an offer, solicitation, or recommendation with respect to products and services provided by the Companies operating under the FXOpen brand, nor is it to be considered financial advice.
DXY Key Levels to look out for DXY levels to watch out for to show signs of exhaustion for reversal points on the majors, approaching 97
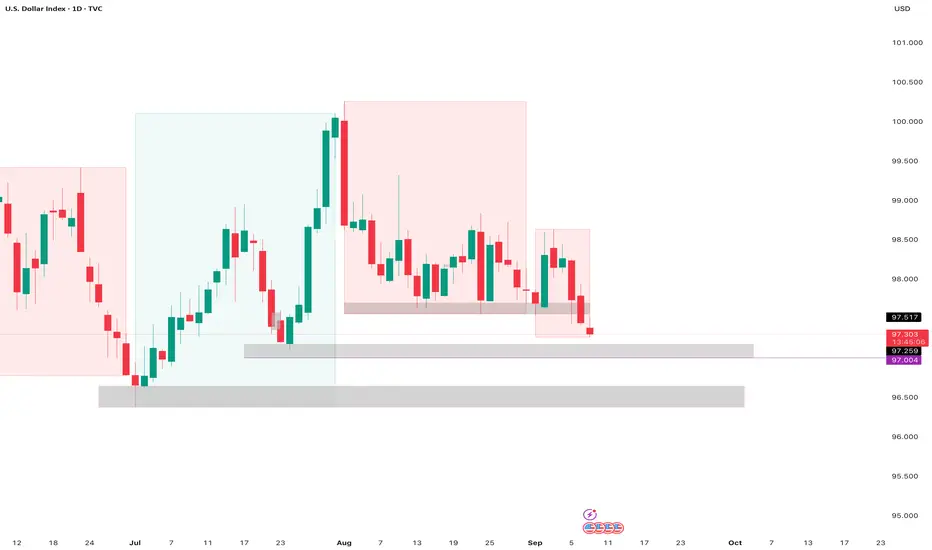
DXY SHORTS | 9SEPT Price failed to hold above resistance — strong sign of supply in control ⚡.
Intraday structure shifting bearish below 97.400.
Minor LQC + demand point marked — a confirmed close below supports further downside.
⚡ Trade Summary:
This is a continuation play following the first trade idea. The rejection confirms bears are stepping in, aligning with higher timeframe momentum. Short positions below 97.400 remain valid, targeting 97.100.

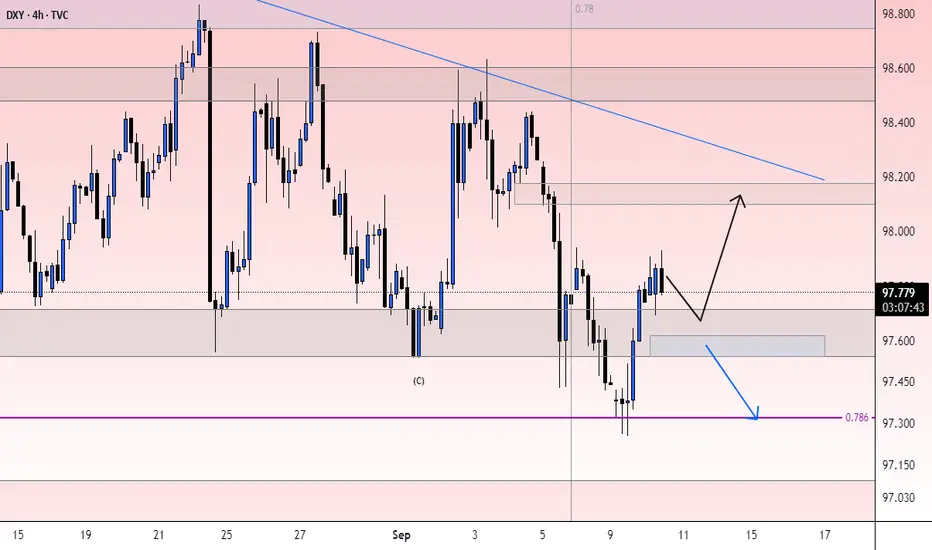
DXY countertrend play | 9 SEPT📌 Key Observations:
Asian session highs swept ➡️ liquidity grab complete.
Price reacted from resistance zone (97.470 – 97.576) 🟦.
Minor LQC marked — a close below this level confirms bearish continuation.
🎯 Targets:
First downside target: 97.300 (intra-day liquidity pocket).
Main target: 97.100 🔽.
⛔ Invalidation:
A clean break & hold above 97.576 would shift bias back to bullish intraday.
⚡ Trade Summary:
Looking for short opportunities after this liquidity sweep, aligned with overall bearish momentum. A confirmed rejection from resistance strengthens the short setup. Patience is key — wait for candlestick confirmation before entry.

US Dollar & FED’s Final Choice: All Possible Scenarios The end of 2025 is shaping up to be decisive for the US dollar. After two years marked by persistent inflation and a slowdown in the labor market, the Federal Reserve (Fed) faces a crucial choice: maintain its current policy or initiate a monetary pivot. Depending on the chosen trajectory, the consequences for the US dollar (measured by the DXY index) could be diametrically opposed. Five main scenarios outline the full range of possible outcomes.
No Pivot: Status Quo until 2026
In this scenario, the Fed keeps its policy rate unchanged throughout 2025. Inflation, stuck around 3%, prevents any easing. The key meetings in September, October, and December would therefore result in a status quo.
The impact on the FX market would be clear: a strong bullish recovery of the US dollar against major currencies. After being one of the weakest currencies in the FX market, the greenback would regain strength, supported by a favorable rate differential. Technically, a move above 100/101 points would validate this bullish reversal hypothesis.
Technical Pivot to Adjust the Labor Market
Here, the Fed proceeds with a one-off rate cut in September or October, motivated by a weakening labor market. However, it does not initiate a broader easing cycle due to still-high inflation.
This type of pivot, described as “hawkish,” would anchor the DXY around 100 points, corresponding to levels seen in spring and summer 2025. The dollar would therefore remain stable, perhaps with a slight upward bias, without a clear downward trend.
Real and Healthy Pivot: Disinflation Confirmed, Labor Market Under Control
A more balanced scenario would see the Fed launching a genuine pivot, paving the way for a series of rate cuts starting September 17. Prerequisites would be in place: inflation near 2% and a stabilized labor market.
In this case, the impact would be bearish for the dollar. The downward trend, in place since early 2025, would continue. However, since this trend is already well advanced, the downside potential could be limited to the 94–95 zone on the DXY. In other words, moderate but contained pressure.
Real but Unhealthy Pivot: Sticky Inflation, Deteriorating Employment
This hypothesis combines inflation still close to 3% (notably due to tariffs) with a clear deterioration in the labor market. The Fed would be forced to begin a series of rate cuts, not out of macroeconomic comfort but to try to support activity and employment.
The risk of a US recession would intensify, forcing the Fed to act quickly. The effect on the dollar would be pronounced: a prolonged slide towards the lows of 2021, driven by falling rates and heightened perceptions of economic weakness.
Emergency Fed PUT: Surging Unemployment and Confirmed Recession
Finally, in the most extreme scenario, the US economy would enter a full recession with a sharp rise in unemployment. The Fed would intervene forcefully with massive and rapid rate cuts, confirming the seriousness of the situation.
The dollar would respond with a steep plunge, potentially falling back to its 2018 lows. This would reflect investors’ loss of confidence in the resilience of the US economy.
The chart below shows the weekly candlesticks of the US Dollar (DXY).
DISCLAIMER:
This content is intended for individuals who are familiar with financial markets and instruments and is for information purposes only. The presented idea (including market commentary, market data and observations) is not a work product of any research department of Swissquote or its affiliates. This material is intended to highlight market action and does not constitute investment, legal or tax advice. If you are a retail investor or lack experience in trading complex financial products, it is advisable to seek professional advice from licensed advisor before making any financial decisions.
This content is not intended to manipulate the market or encourage any specific financial behavior.
Swissquote makes no representation or warranty as to the quality, completeness, accuracy, comprehensiveness or non-infringement of such content. The views expressed are those of the consultant and are provided for educational purposes only. Any information provided relating to a product or market should not be construed as recommending an investment strategy or transaction. Past performance is not a guarantee of future results.
Swissquote and its employees and representatives shall in no event be held liable for any damages or losses arising directly or indirectly from decisions made on the basis of this content.
The use of any third-party brands or trademarks is for information only and does not imply endorsement by Swissquote, or that the trademark owner has authorised Swissquote to promote its products or services.
Swissquote is the marketing brand for the activities of Swissquote Bank Ltd (Switzerland) regulated by FINMA, Swissquote Capital Markets Limited regulated by CySEC (Cyprus), Swissquote Bank Europe SA (Luxembourg) regulated by the CSSF, Swissquote Ltd (UK) regulated by the FCA, Swissquote Financial Services (Malta) Ltd regulated by the Malta Financial Services Authority, Swissquote MEA Ltd. (UAE) regulated by the Dubai Financial Services Authority, Swissquote Pte Ltd (Singapore) regulated by the Monetary Authority of Singapore, Swissquote Asia Limited (Hong Kong) licensed by the Hong Kong Securities and Futures Commission (SFC) and Swissquote South Africa (Pty) Ltd supervised by the FSCA.
Products and services of Swissquote are only intended for those permitted to receive them under local law.
All investments carry a degree of risk. The risk of loss in trading or holding financial instruments can be substantial. The value of financial instruments, including but not limited to stocks, bonds, cryptocurrencies, and other assets, can fluctuate both upwards and downwards. There is a significant risk of financial loss when buying, selling, holding, staking, or investing in these instruments. SQBE makes no recommendations regarding any specific investment, transaction, or the use of any particular investment strategy.
CFDs are complex instruments and come with a high risk of losing money rapidly due to leverage. The vast majority of retail client accounts suffer capital losses when trading in CFDs. You should consider whether you understand how CFDs work and whether you can afford to take the high risk of losing your money.
Digital Assets are unregulated in most countries and consumer protection rules may not apply. As highly volatile speculative investments, Digital Assets are not suitable for investors without a high-risk tolerance. Make sure you understand each Digital Asset before you trade.
Cryptocurrencies are not considered legal tender in some jurisdictions and are subject to regulatory uncertainties.
The use of Internet-based systems can involve high risks, including, but not limited to, fraud, cyber-attacks, network and communication failures, as well as identity theft and phishing attacks related to crypto-assets.

Fibonacci confluence signals bullish reversalUS Dollar Index (DXY) is falling towards the pivot and could bounce to the 1st resistance.
Pivot: 97.17
1st Support: 96.75
1st Resistance: 97.86
Disclaimer:
The above opinions given constitute general market commentary, and do not constitute the opinion or advice of IC Markets or any form of personal or investment advice.
Any opinions, news, research, analyses, prices, other information, or links to third-party sites contained on this website are provided on an "as-is" basis, are intended only to be informative, is not an advice nor a recommendation, nor research, or a record of our trading prices, or an offer of, or solicitation for a transaction in any financial instrument and thus should not be treated as such. The information provided does not involve any specific investment objectives, financial situation and needs of any specific person who may receive it. Please be aware, that past performance is not a reliable indicator of future performance and/or results. Past Performance or Forward-looking scenarios based upon the reasonable beliefs of the third-party provider are not a guarantee of future performance. Actual results may differ materially from those anticipated in forward-looking or past performance statements. IC Markets makes no representation or warranty and assumes no liability as to the accuracy or completeness of the information provided, nor any loss arising from any investment based on a recommendation, forecast or any information supplied by any third-party.

DXY: Move Down Expected! Short!
My dear friends,
Today we will analyse DXY together☺️
The recent price action suggests a shift in mid-term momentum. A break below the current local range around 97.099 will confirm the new direction downwards with the target being the next key level of 96.993 and a reconvened placement of a stop-loss beyond the range.
❤️Sending you lots of Love and Hugs❤️
