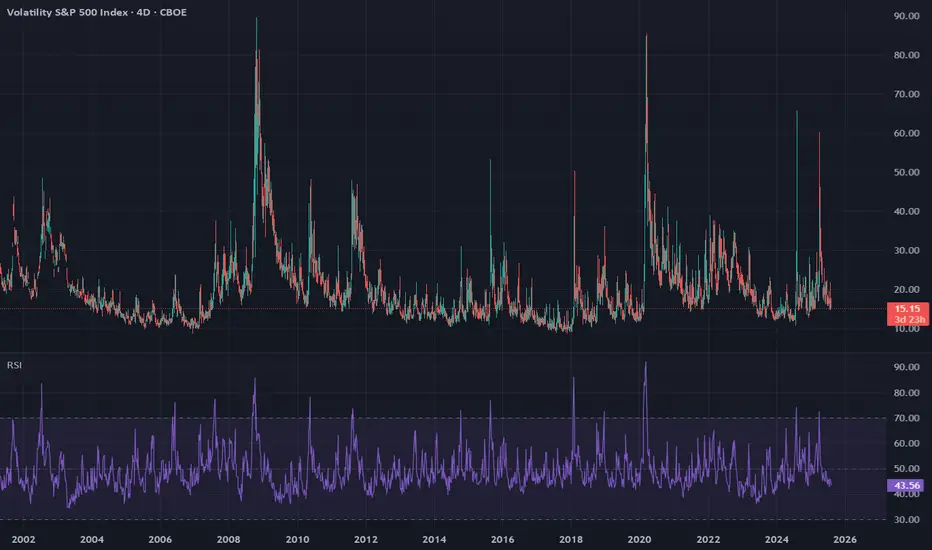
$VIX We only just started! Volmageddon 2.0Zoom out on the VIX and you'll find that there is A LOT more runway. Study the VIX for the last 30 years and you'll find that it bottoms out and explodes. We are not at a turning point in the markets with ultra high "hot air balloons" that will come down with a correction that is long overdue. The VIX hasn't been this low in a very long time, so you want to keep the proxy CBOE:UVIX in your radar. Happy trading! Always look to make lemonade out of lemons :)
Trade ideas
Volmageddon 2.0 in the making.....must watch!I have been saying this for months! Keep an eye on the VIX, always! Yes, it's been down for 5-6 months in a very unnatural way, but things are about to take a turn and potentially in a big way. Ultra-high valuations, crap unemployment, defaults through the roof, PE/CAPE ratios at historic levels, and highest concentration / weight in the stock market. 10 tech companies buying from each other like very good friends with 100% capex that hasn't been spent = 40% of S&P, seriously, WTF! In any case, it's not rosy, and we are overdue a massive spike in the VIX. Use the proxy ETF CBOE:UVIX and add alerts. Best of luck!
$VIX trending up nicely.....buckle your seatbeltVIX has been on the downside for the last few months, mostly because of much f$ckery in the market that is running super hot. I would not be surprised if it crosses 20 this week! You can use UVIX as the proxy. Best of luck! This could be magical

VIX USFA Lights out 9/19/2025 BLACKSWAN PREDICTION
First time in recorded History that Saturn
Will be its closest from earth combined
With a Partial solar eclipse the 9/21/2025
All happening the day before
"Market Maker Day"
global derisking potential
only if sustained over 19,91
Crazy shit is possible
23days after VIX palindrom anniversary
Chritmas Kiss of death expected
@Hanslanda369

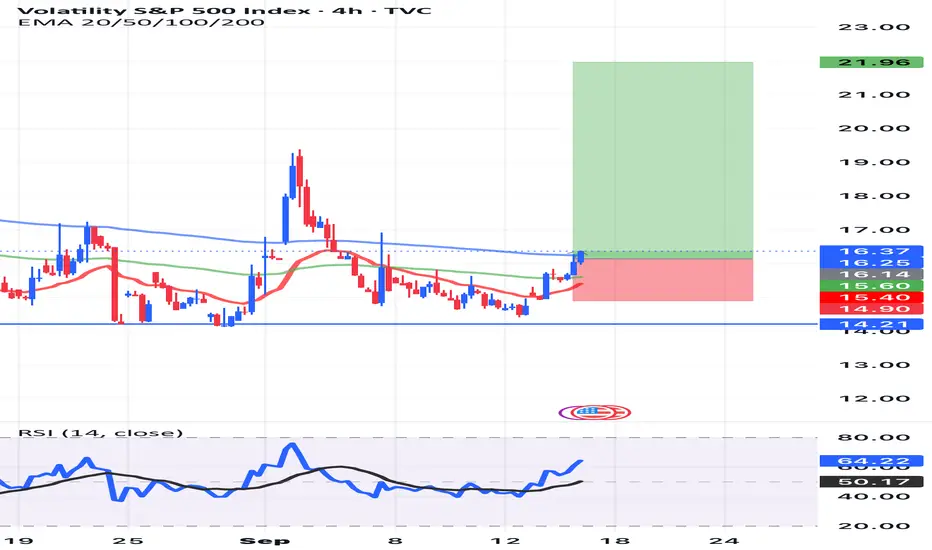
VIX caution signal?Noticed that we closed above the 50 on the RSI... on the day and 1hr chart.
>16 caution
>17... it's higher than 16 so the VIX is rising; caution x2
>20 = elevated VIX
P.S. I noticed that the Fear & Greed index is at greed.
www.cnn.com

What will happen to VIX after another crappy jobs report today?While there is no crystal ball, the jobs market is beyond horrible and many precursors to a massive pullback on coming together; credit defaults, unemployment (after several revisions, each one worse than the last one), China pulling back on US based AI tech (what AI bubble?), and valuations that peak dot.com bubble. The VIX has been unnaturally low, hedge funds are shorting it!, and let's not forget volmaggedon! Could spike any second and it likely will before people get too complacent. This is a recipe for v-maggedon 2.0. Bullish on the economy, but not blind to facts and historical standards when things look very wonky. Best of luck out there! Everyone is a genius when the market is up :)
VIX spiking....PEEKA BOOTVC:VIX (proxy CBOE:UVIX ) is crossing up key technicals and looks like there is a nice upside. Much of the news hasn't reported that the rate cuts have "already" been priced-in, which is a nice recipe for volatility to spike as people make big moves (mostly sell). Again, 99% of sell orders from insiders are SELL, and congress members are putting PUT options orders too. It also doesn't help that China is not buying NVDIA, which was a big reason for the upside and that has completely faded out. Where do you go when the MARKET has reached the ceiling?
Best of luck and always hedge your positions! VIX / UVIX now has an awesome beta and upside.

VIXSuccess in forex and stocks comes from a combination of knowledge, discipline, and patience. Understanding market trends, economic factors, and company fundamentals is crucial, but equally important is controlling emotions and sticking to a well-planned strategy. Continuous learning, adapting to changing conditions, and managing risk wisely can turn opportunities into consistent growth over time. Consistency, not luck, separates successful traders from the rest.
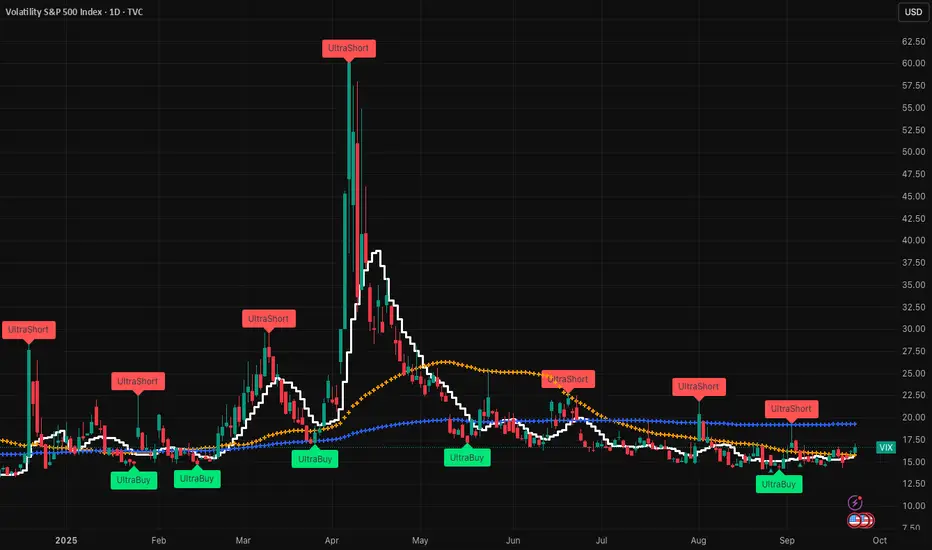
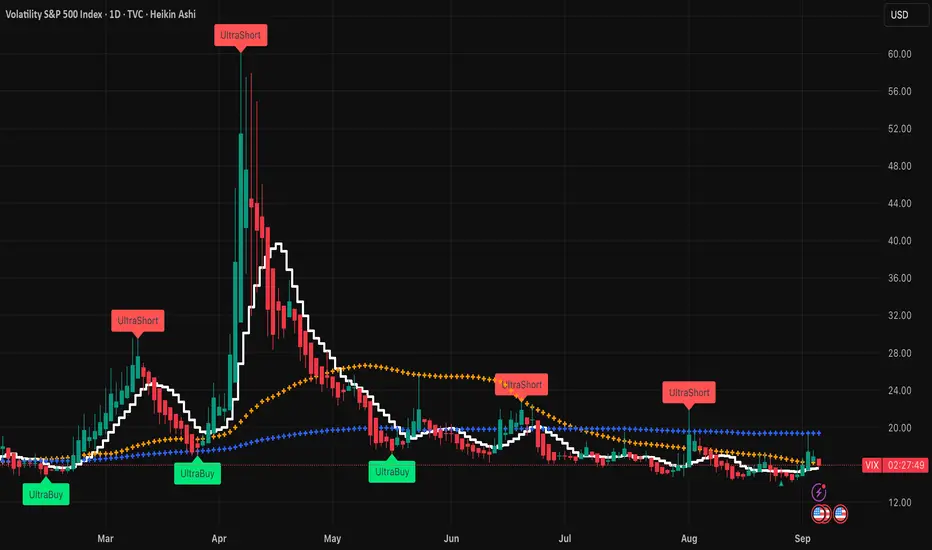
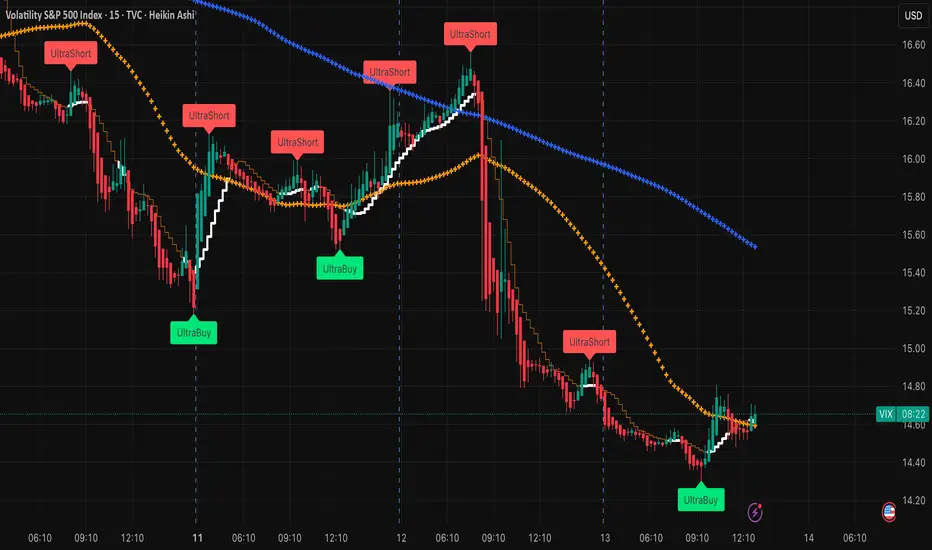
VIX looking real sweet now before tomorrow's Job numbersIf you're looking for a nice upside before things get wonky, then look at the $VIX! It's starting to tick-up from all the complacency - folks buying at all time high with insane valuations just not supported historically. The jobs numbers is expected to look pretty grim tomorrow, and with that the market can correct itself. The proxy for TVC:VIX is $UVIX. If you need help, just check the ultrabuy / short signals and you should be fine! Best of luck and stay active in the market otherwise you could be a bag holder for a while, and that's not fun!
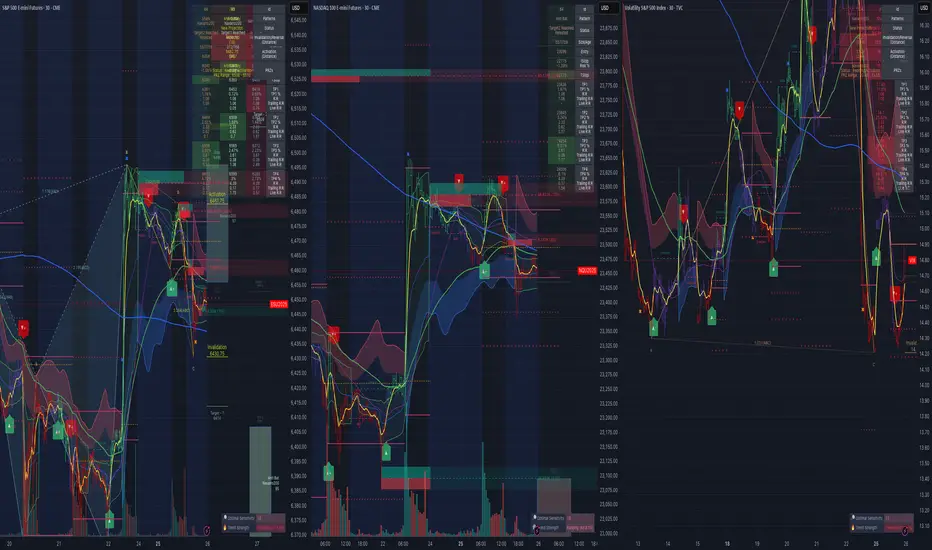
US500, USTECH, US30 & VIX Daily Trade SetupsIn this update we review the recent price action in the SP500, Nasdaq, DowJones & VIX identifying the next high-probability trade setups and price objectives to target. To review today's video analysis, click below!

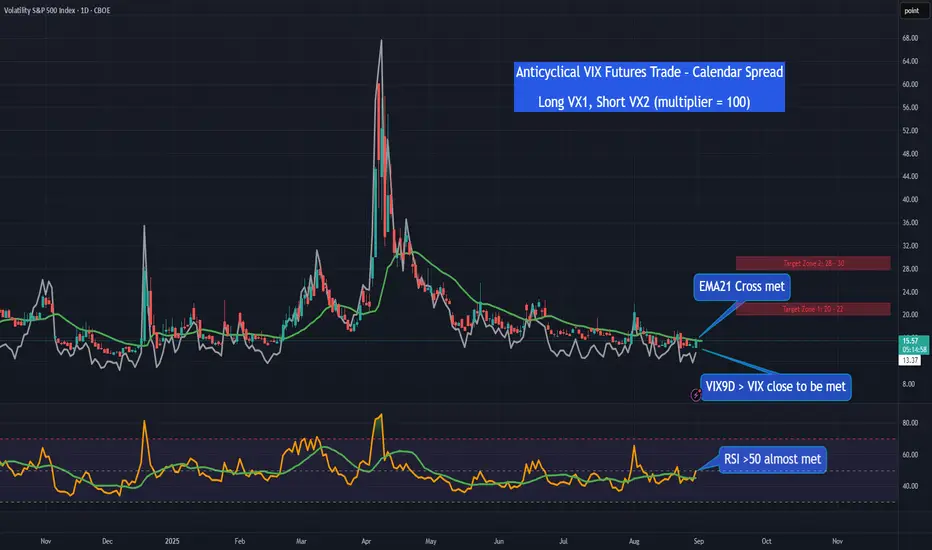
Anticyclical VIX Futures Trade – Calendar SpreadVIX has drifted into complacency territory with stretched short positioning, steep front-end contango, and seasonal factors lining up. Instead of outright longs, a VX1–VX2 Calendar Spread offers cleaner exposure to rising volatility and curve normalization.
Setup
• VIX near equilibrium range (12–15%), entering complacency.
• Futures curve in steep contango → negative carry on outright longs.
• Short positioning at multi-year highs, vulnerable to squeeze.
• Seasonality favors higher VIX.
• Index volatility suppressed, single stocks trading erratically.
Trade Idea
• Long VX1 / Short VX2 (multiplier = 100).
• Benefits from both rising volatility and front-end curve flattening.
• VX1 outperforms VX2 in a spike; VX2 cushions VX1 in grind-lower scenarios.
Entry Triggers
• VIX9D > VIX.
• VIX crossing EMA20/EMA50.
• RSI(14) on VIX > 50.
• SPX daily short setup.
Target
• Target zone to be reached before VX1 expiration.
• Target zone 1: VIX in range 20 - 22, target zone 2: VIX in range 28 – 30
Exit
• On VX1 expiry: VX1 converges to the VIX. VX2 becomes front month. If the position is left open, it effectively becomes a short front-month future and must be re-evaluated.
• Alternatively, close at VIX Index in specified target zone or discretionary, depending on SPX price action (i.e. SPX bouncing back after a dip).
Risk
• Do not over-leverage.
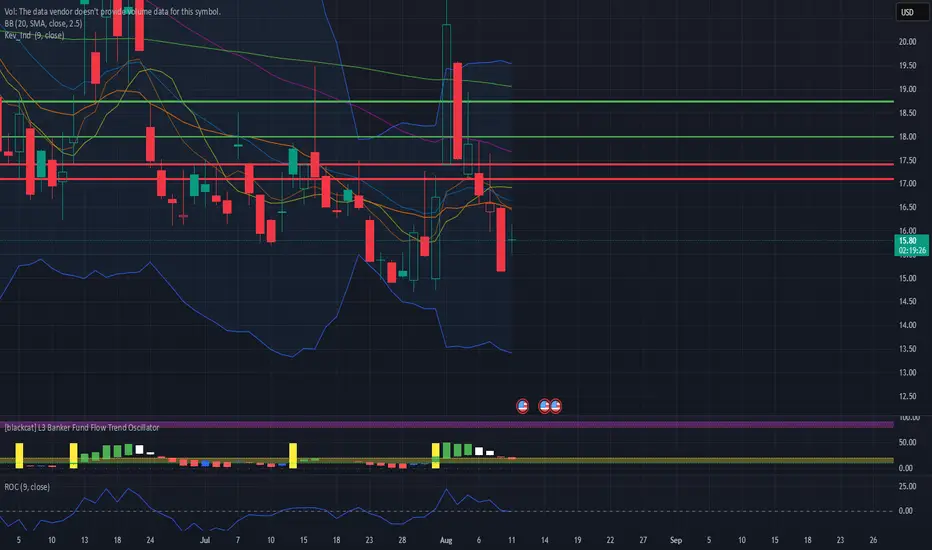
VIX looking real sweet now (use UVIX as proxy)For those tracking macros and true diversification, this is a potential nice play with a massive upside. Look at last year around July 17th. We are nearing this. Historically, the VIX bottoms out around 17-18 and it's sitting at 15. It doesn't stay in this region for too long. Most macros are looking extremely brittle and cracks are forming everywhere. I'd argue that the macros look worse now than in early 20202. Track this, put alerts on, use whatever technical you prefer, but this will spike and it's a massive upside. Some use UVIX as the proxy for the VIX :) Best of luck and always take calculated risks. If not, just go to your trusty bank and get 0.02% return annually!

IB EMA5 cross HP AHProj LuxAlgoGo long when the EMA 5 crosses above the EMA 65, and exit the long position when it crosses back below. This setup is combined with the harmonic pattern drawing a downward line, and it triggers when price touches the LuxAlgo support band.
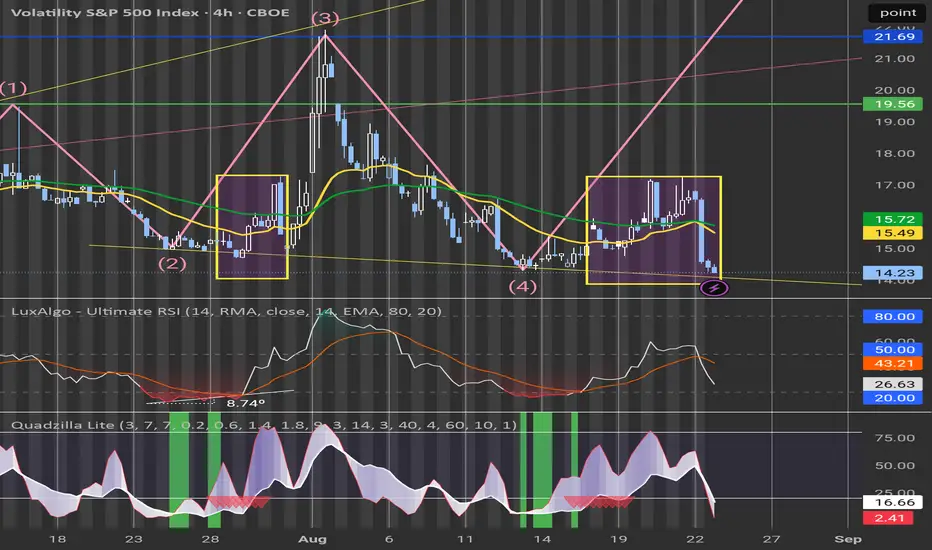
$VIX.US tere might be something hiding in the water many missed We will focus on the candle formation for July 30th wednesday, July 31st Thursday, and July 32nd Friday. We will compare these dates to August 20th Wednesday, the 21st thursday and the 22nd Friday.
I have been following it since I spotted it few days ago to see if it checks out, and sofar its been playing out candle for candle. If you go to the Daily and the 4h chart and focus on the July dates you might notice something very similar to what we had this Friday, a big drop. Now that is exactly what I was hoping for personally. It dropped bellow its previous low, and in theory should bounce off the bottom limit of the 5 wave megaphone which would signal a possible sharp rise in Vix and a sharp drop in SPY furthermore validating the pattern that im speculating is going to play out by October.
VIX & Nvidia Daily Trade SetupsIn this update, we review the recent price action in the VIX & Nvidia and identify the next high-probability trade setups and price objectives to target. To review today's video analysis, click here!

Have we entered a brand new normal or is a crash coming?The market's bullish narrative rests first and foremost on the control of volatility. I won't go too much deeper into that right now, but I have been discussing with AI the current period of volatility expression and would like to highlight the following points about the current period:
4d VIX RSI has not had a 5 point increase since April 1 of this year. That's 129 days and counting.
From Claude AI (Anthropic):
The ongoing 4 day VIX RSI fall period (started April 1, 2025, now at 128+ days) is completely unprecedented since September 2003 (when VIX formula was modernized).
That's already:
More than double the longest ever previous period of in October 28, 2020 to Jan 27, 2021 (63 days)
Nearly 10x longer than the average period (13.14 days)
Over 12 standard deviations beyond the mean
The only period ever to exceed 70 days since September 2003
Key Insight:
Since September 2003, 67.3% of all fall periods recovered within 2 weeks, and 84.2% recovered within 3 weeks. The current 128+ day period represents an extreme statistical outlier in modern VIX behavior.
Additionally, if we look at the S and P week chart, we see that the gap from May 9 to May 12 is the largest ever unfilled weekly gap in the entire history of the S and P.
We are currently in a whole new normal of "bullishness", akin to the time period just before the great crash and great depression (which was the most bullish the stock market has ever been).
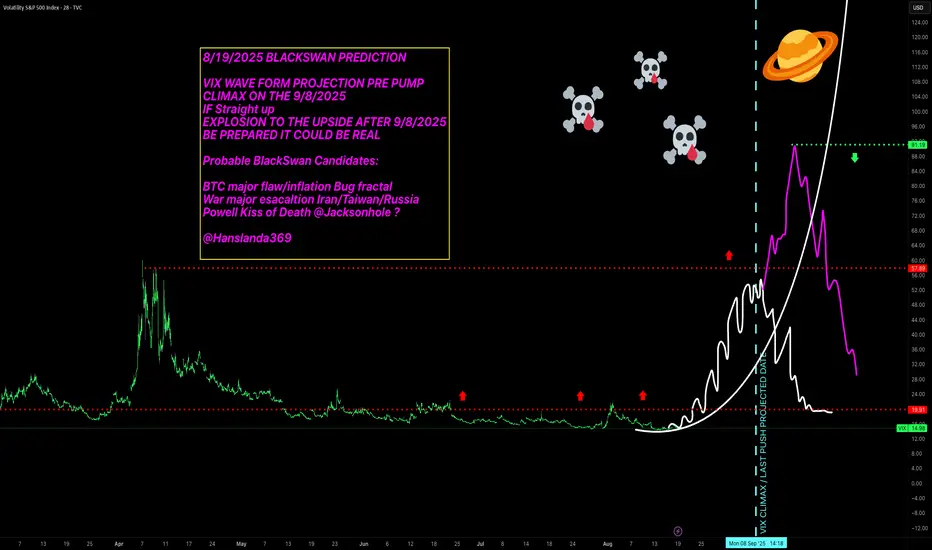
Operation US FA Liquidation VIX explosion 8/19/2025 BLACKSWAN PREDICTION
VIX WAVE FORM PROJECTION PRE PUMP
CLIMAX ON THE 9/8/2025
IF Straight up
EXPLOSION TO THE UPSIDE AFTER 9/8/2025
BE PREPARED IT COULD BE REAL
Probable BlackSwan Candidates:
BTC major flaw/inflation Bug fractal
War major escalation Iran/Taiwan/Russia
Powell Kiss of Death Jacksonhole ?
@Hanslanda369
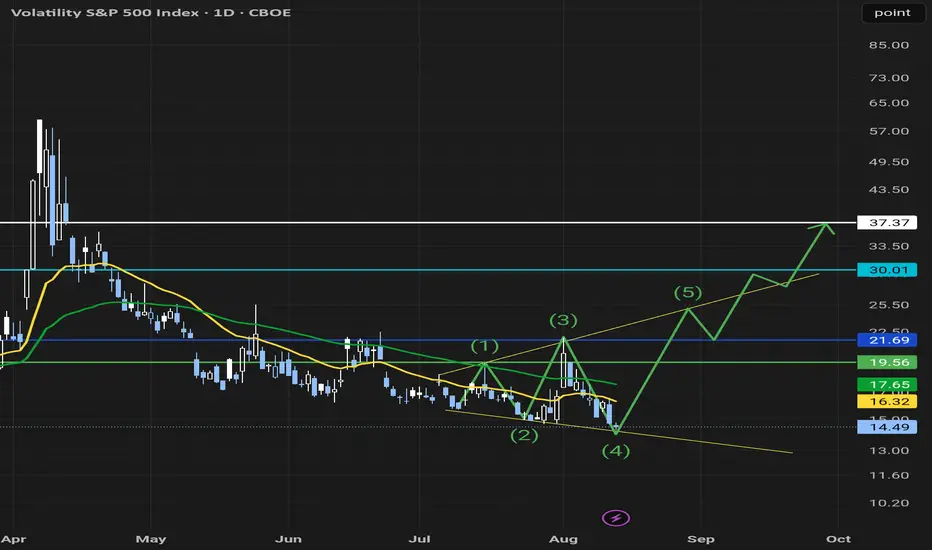
Here is what I am seeing for VIX roughly by October Greetings my people.
This is what I am seeing for VIX.US. 5 wave megaphone on the daily. Each vertical line corresponds to liquidity gaps that are still present. We had a very similar pattern on SPY.US I personally played, but I have not posted it on here. I'll start sharing my ideas more often as I get more used to using this. 😅 Perhaps it might look a bit exagerated however If you break down SPY.US in small sections on the 4h, its really just a few patterns that repeat in 3s for each circle. After each circle is complete it drops to a lower level from which it rebounds and begins a new circle of 3 reoccurring patterns. After the completion of each such cycles the pull back is bigger with the third one being the biggest like the one we had last April which was basically the end of the 3rd and final cycle. We have been in curently in cycle one of the new phase and curently working our way up and towards the completing of the 3rd reoccurring pattern in cycle one. I know it likely makes zero sense at the moment, if youre interested and I get enough requests ill take the time and make a post about it.
Again, this is a GIFT....VIX super lowThere's a very good chance you won't see the VIX at this level for a while and it ALWAYS ALWAYS spikes and goes above 20 for over 30 YEARS! Learn how trade the VIX to take advantage of this golden time. This isn't 5-10% upside, this could easily be over 100-200% in a few weeks / months....
VIX Crab VIX is likely to rise from $17.4 upon reaching it, positioned at the leg of the Crab Pattern, potentially advancing towards the targets (TP #1 - TP #3).

Bullish Harami Forming On Vix?? I saw this developing this morning and bought about 400-500$ worth of Spy Puts I think this could play out and we see a big drop in Indexes by latest Wednesday
lens.usercontent.google.com
VIX looking good....While some are celebrating small wins the bigger picture is that the economy is NOT doing well and there will likely be a liquidity crisis at some point. The smartest investors are pilling up cash while retailers are the exit liquidity. From a TA perspective, historically the VIX is below its mean average and we're seeing it crossing 50SMA then most likely 200SMA lines. The VIX ALWAYS spikes and it will cross 20 very soon! Just look at the last week that's 2-3 good years in the S&P in a few hours. DM me for details on how to use ETFs.

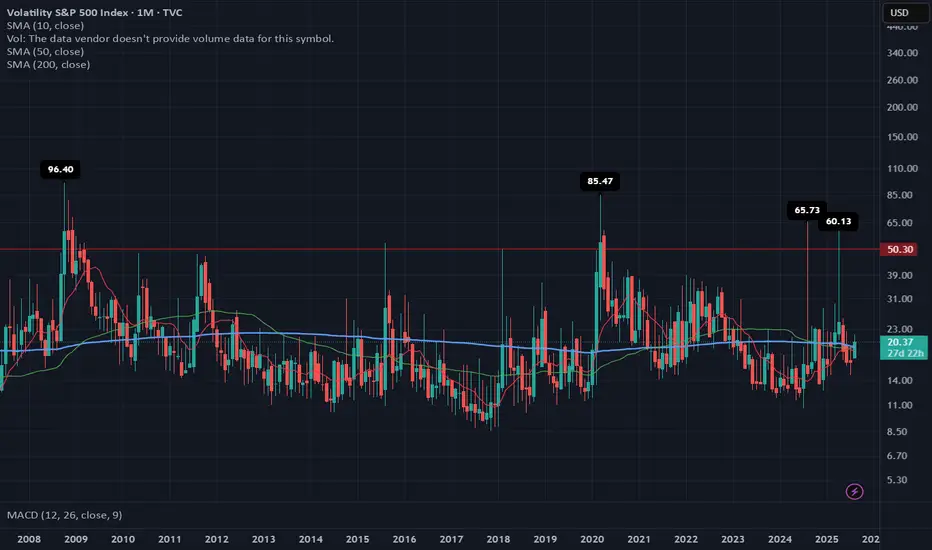
VIX: From “Calm Tension” to a ReboundWhy does a small uptick matter today… if we’ve already seen 60+ readings four times in the past 17 years?
The first week of August 2025 brought back a familiar market force: volatility.
The VIX, which tracks expected fluctuations in the S&P 500, jumped 21% in just a few days, rising from 17.4 to 20.37, with an intraday high of 21.9 on August 1.
At first glance, the move may seem minor. But it broke through key long-term moving averages (SMA 50 and 200) and exited its recent comfort zone (14–19 pts). That alone is enough to make portfolio managers and traders pay attention again.
🔙 Historical context: when the VIX truly spiked
📅 Date 🔺 VIX intraday 🧨 Trigger
Oct 1, 2008 96.40 Subprime mortgage crisis, Lehman collapse, AIG bailout
Mar 2, 2020 85.47 COVID-19 global spread, border shutdowns
Aug 5, 2024 65.73 Surprise Fed rate hike + overheated jobs data
Apr 7, 2025 60.13 Panic over new U.S. tariffs on global partners
Compared to those moments, today's VIX levels look “mild.” But the technical and macroeconomic signals suggest that volatility may be establishing a new baseline.
1. 📊 Breakdown: First week of August 2025
Weekly increase: from 17.4 → 20.37 (+21%).
Technical breakout: monthly close above both the 50-day and 200-day simple moving averages (SMA 19.25 and 19.45).
MACD on the monthly chart has flipped positive for the first time since March 2023.
Key drivers:
🏛️ The Fed left interest rates unchanged on July 30, but two dissenting votes favored a rate cut.
👷♂️ Softening jobs data: July NFP came in at only +73,000 jobs (vs. +110,000 expected).
🧾 New U.S. tariffs, announced on August 1, reignited inflation concerns.
2. ⚖️ Comparing August 2025 to the August 2024 storm
Factor August 2024 August 2025 (Week 1)
🔺 VIX peak 65.73 21.9
🏛️ Fed stance Surprise 25 bp rate hike Rates unchanged, internal division
👷 Labor market Hot, wage pressures Cooling down
📉 S&P 500 reaction −12% in 3 weeks Approx. −3% decline underway
💧 Market liquidity Very low (pre-market) Normal
Conclusion:
2024 was a systemic shock.
2025 is more of a volatility warning sign—but one that matters for risk management.
3. 📍 Technical signals to monitor
The monthly MACD just turned positive, which historically precedes sustained volatility spikes.
Key short-term range: 18–22 pts. A sustained close above 22 could trigger heavy selling in high-beta stocks.
Options expiration (OPEX, Aug 16) may amplify moves via gamma flows.
4. 🔮 What could move the VIX next?
📅 Date 📌 Event ⚠️ Volatility Risk
Aug 14 Core CPI (July) Reading above 0.3% m/m could reignite hawkish Fed bets
Aug 22–23 Jackson Hole Symposium Powell’s speech could reset the policy outlook
End of Aug Q2 GDP revision Confirm whether slowdown = soft landing or stagflation
📌 Note: The VIX cannot be traded directly. Exposure is typically obtained through futures, options, or ETNs—each with specific risks like contango, low liquidity, and roll decay.
📌 Final thoughts
The VIX doesn’t need to hit 60 to send a message.
The fact that it’s breaking above long-term averages, reacting sharply to macro data, and threatening key levels is enough to suggest that the era of ultra-low volatility may be ending.
History shows us that major VIX spikes come fast and unannounced.
If you remember 2008, 2020, or even April 2025—you know that preparation beats prediction.