UK100 H4 | Bullish bounce off 61.8% Fibonacci supportUK100 is falling towards the buy entry 9,259.83, which is a pullback support that aligns with the 61.8% Fibonacci retracement and could bounce from this level to the take profit.
Buy entry is at 9,259.83, which is a pullback support that aligns with the 61.8% Fibonacci retracement.
Stop loss is at
About FTSE 100 Index
The UK Financial Times Stock Exchange 100 is an index of share prices of the largest 100 companies listed on the London Stock Exchange (LSE) by market capitalisation. The index was launched on January 3, 1984 at a base value of 1000, and the index level is calculated in real-time.
Related indices

UK100/FTSE100 - OPPORTUNITY TO PRINT MONEYTeam,
last trade UK100 target hit last night.
Now reaching the HOLD HIGH or NEW ATH, time for a kill
Shorting range at 9380-9400 - stop loss at 9460
Target 1 at 9356-45
target 2 at 9315-9286
lets go

UK100--LONG--Bullish reversal from the bottom of the ascending channel
--tp and entry levels are as shown on chart

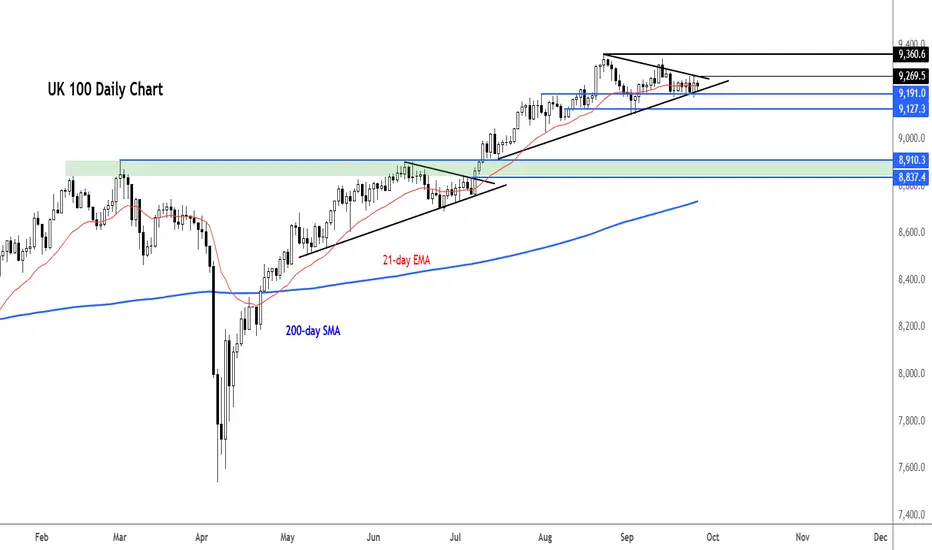
FTSE about to break higher?Yesterday we highlighted the potential for a bullish breakout on the FTSE as it coiled inside converging trend lines. Today it was trying to stage a breakout as it tests the resistance trend of this pattern and a key level around 9270. A clean above this level could see the index aim for new all-tim

Bulls Trap Bears at 9196 - Ready for Reversal?📊 To see my confluences and/or linework, follow these steps:
Step 1: Grab the chart 🖱️
Step 2: Unhide Group 1 in object tree 📂
Step 3: Hide and unhide specific confluences as needed 🔍
Step 4 : Double click chart to unhide minimized indicators ( OBV,RSI,MFI,CVD )
Title: 🎯 FTSE 100: Bulls Trap Be

FTSE 100 coiling ahead of potential breakoutThe FTSE remains in consolidation mode for now, but the underlying trend is still arguably bullish. The index was holding inside a consolidation pattern, coiling before a potentially large breakout. 9270 is the level to watch on the upside - a break above this could pave the way for fresh gains towa
UK100 Strategy Map: SMA Pullback Meets Heikin Ashi Signal🚀 UK100 Index Market Wealth Strategy Map (Swing/Day Trade)
📊 Plan
🔹 Bias: Bullish trend confirmed
🔹 Method: Simple Moving Average (SMA-382) pullback + bullish Heikin Ashi candle confirmation + Double bottom pullback detected.
🔹 Style: Thief layering strategy (multiple limit orders to build position)

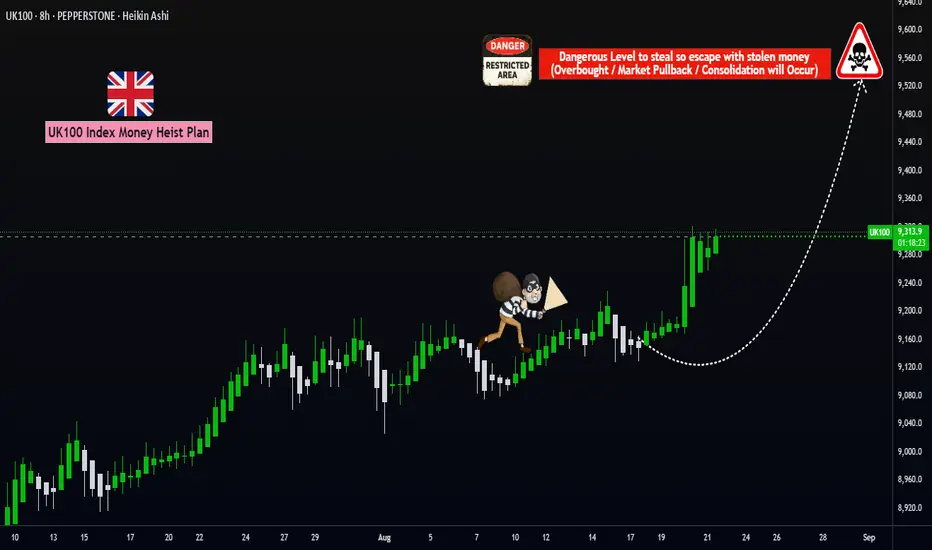
UK100 Bullish Heist: Ready to Loot the Upside?🎯 TRADE PLAN: UK100 BULLISH ROBBERY HEIST! 🎯
Asset: UK100 "FTSE 100 Index Cash" | Type: Indices CFD | Style: Swing & Scalping Larceny
Dearest Fellow Thieves & Money Bandits! 🤑💸🤵♂️👩💼
The vault doors to the UK100 are creaking open! Our intel confirms a BULLISH HEIST is in play. The big money is si
FTSE support retest at 9190The FTSE remains in a bullish trend, with recent price action showing signs of a corrective pullback within the broader uptrend.
Support Zone: 9190 – a key level from previous consolidation. Price is currently testing or approaching this level.
A bullish rebound from 9190 would confirm ongoing ups

FTSE having problems breakig through the 9 and 18 day M/AI would suggest all short postions covered...At this point I would only go long if above 9248 which is the 18 day M/A

See all ideas
Summarizing what the indicators are suggesting.
Oscillators
Neutral
SellBuy
Strong sellStrong buy
Strong sellSellNeutralBuyStrong buy
Oscillators
Neutral
SellBuy
Strong sellStrong buy
Strong sellSellNeutralBuyStrong buy
Summary
Neutral
SellBuy
Strong sellStrong buy
Strong sellSellNeutralBuyStrong buy
Summary
Neutral
SellBuy
Strong sellStrong buy
Strong sellSellNeutralBuyStrong buy
Summary
Neutral
SellBuy
Strong sellStrong buy
Strong sellSellNeutralBuyStrong buy
Moving Averages
Neutral
SellBuy
Strong sellStrong buy
Strong sellSellNeutralBuyStrong buy
Moving Averages
Neutral
SellBuy
Strong sellStrong buy
Strong sellSellNeutralBuyStrong buy
Displays a symbol's price movements over previous years to identify recurring trends.
Frequently Asked Questions
The current value of FTSE 100 Index is 9,491.25 GBP — it has risen by 0.67% in the past 24 hours. Track the index more closely on the FTSE 100 Index chart.
FTSE 100 Index reached its highest quote on Oct 2, 2025 — 9,475.07 GBP. See more data on the FTSE 100 Index chart.
The lowest ever quote of FTSE 100 Index is 1,717.70 GBP. It was reached on Sep 9, 1988. See more data on the FTSE 100 Index chart.
FTSE 100 Index value has increased by 3.01% in the past week, since last month it has shown a 4.11% increase, and over the year it's increased by 14.48%. Keep track of all changes on the FTSE 100 Index chart.
The champion of FTSE 100 Index is LSE:CCEP — it's gained 9.02 K% over the year.
The weakest component of FTSE 100 Index is LSE:WPP — it's lost −52.21% over the year.
FTSE 100 Index is just a number that lets you track performance of the instruments comprising the index, so you can't invest in it directly. But you can buy FTSE 100 Index futures or funds or invest in its components.
The FTSE 100 Index is comprised of 100 instruments including LSE:AZN, LSE:HSBA, LSE:SHEL and others. See the full list of FTSE 100 Index components to find more opportunities.