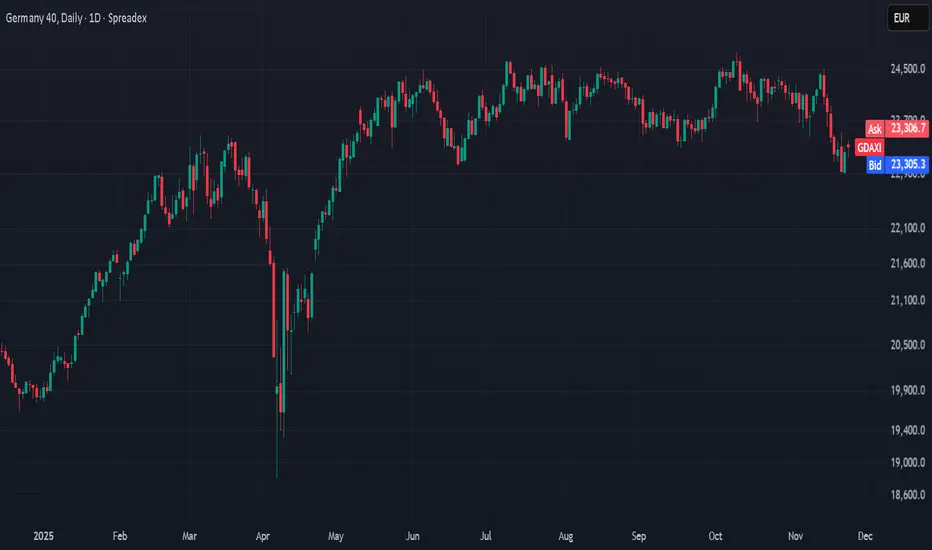
DAX.Chart patternThat looks to be the vhart pattern we are trading
Trying to break that downtrend .Plenty of overhead resistance
lets see what happens
Trade ideas

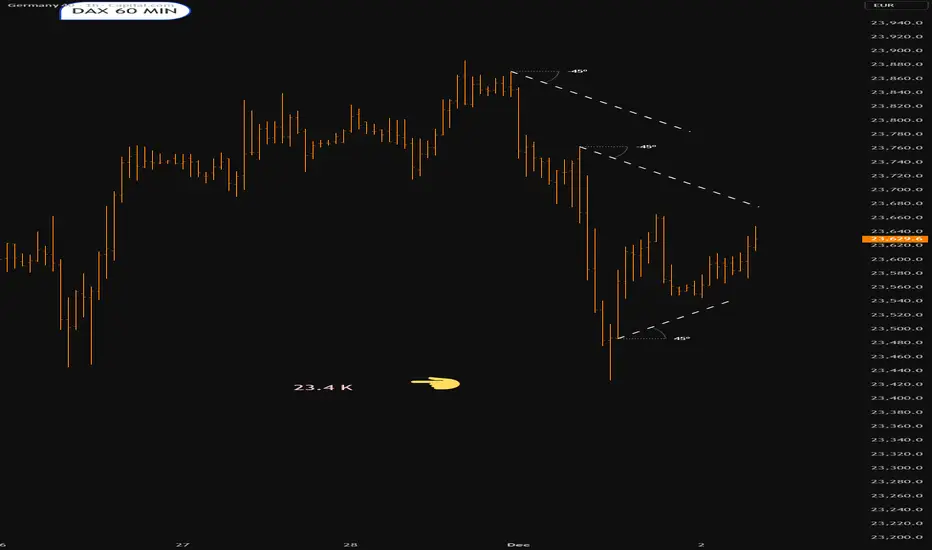
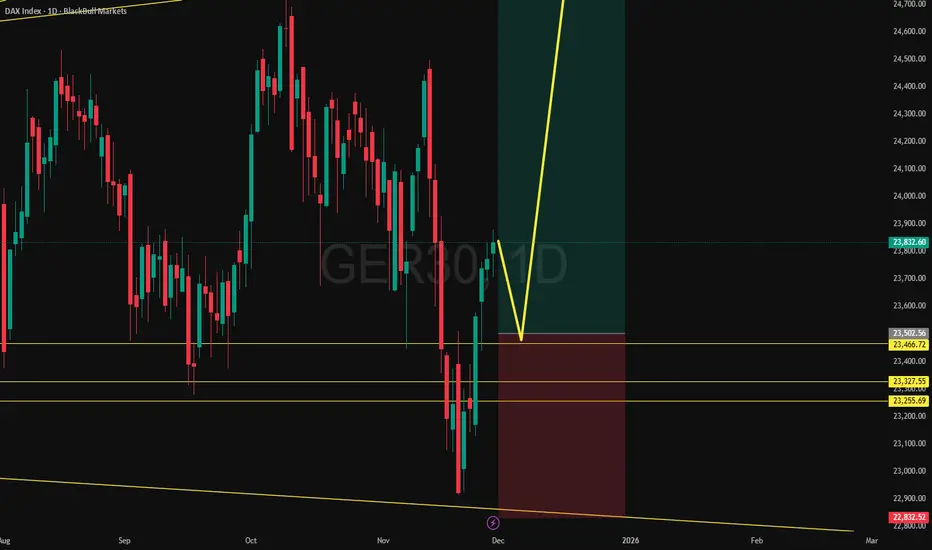
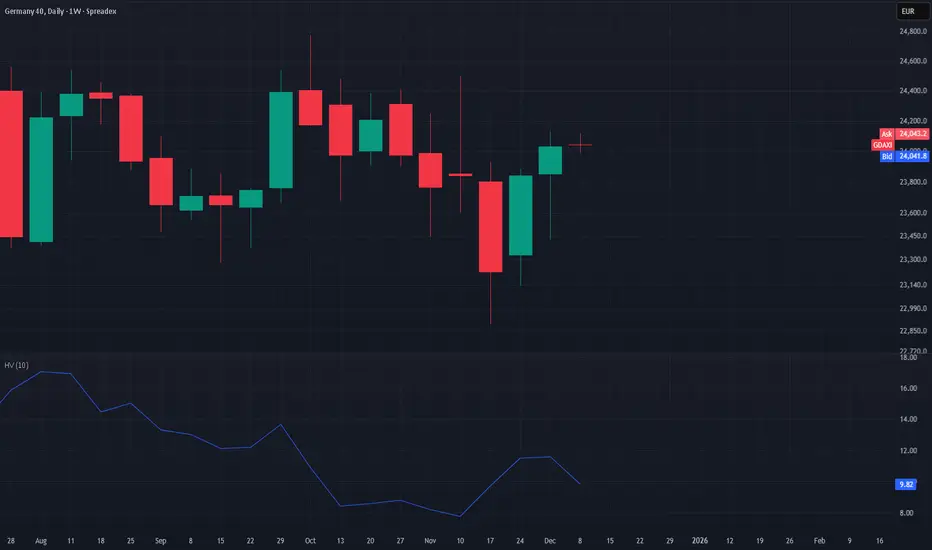
Dax into the open.Tuesday 2nd DecemebrDoes not look happy
Sellers will want to take out 23.4 K
Lets see what happens
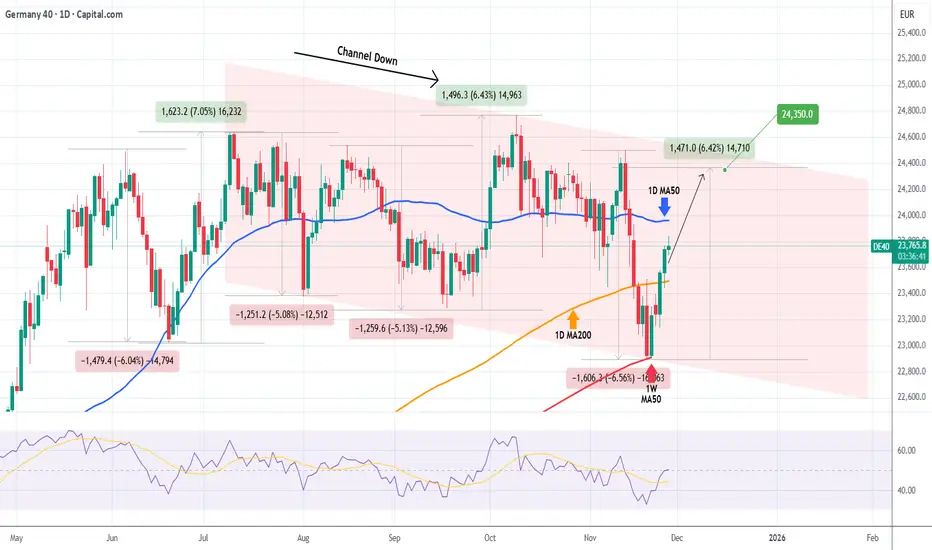
DAX This rally isn't over yet.DAX (DE40) has started a strong rebound following the 1W MA50 (red trend-line) test, as we showed last week. This week the price broke again above its 1D MA200 (orange trend-line) and is about to recover its 1D MA50 (blue trend-line) as well.
The latter has never posed as a Resistance in 2025, so we expect the price to break and continue above it without problems. However, given that the prevailing pattern right now is a Channel Down, the uptrend is limited to its top (Lower Highs trend-line).
With the previous Bullish Leg making a +6.43% rise, we expect a symmetric rise this time around to, thus targeting 24350 short-term.
---
** Please LIKE 👍, FOLLOW ✅, SHARE 🙌 and COMMENT ✍ if you enjoy this idea! Also share your ideas and charts in the comments section below! This is best way to keep it relevant, support us, keep the content here free and allow the idea to reach as many people as possible. **
---
💸💸💸💸💸💸
👇 👇 👇 👇 👇 👇
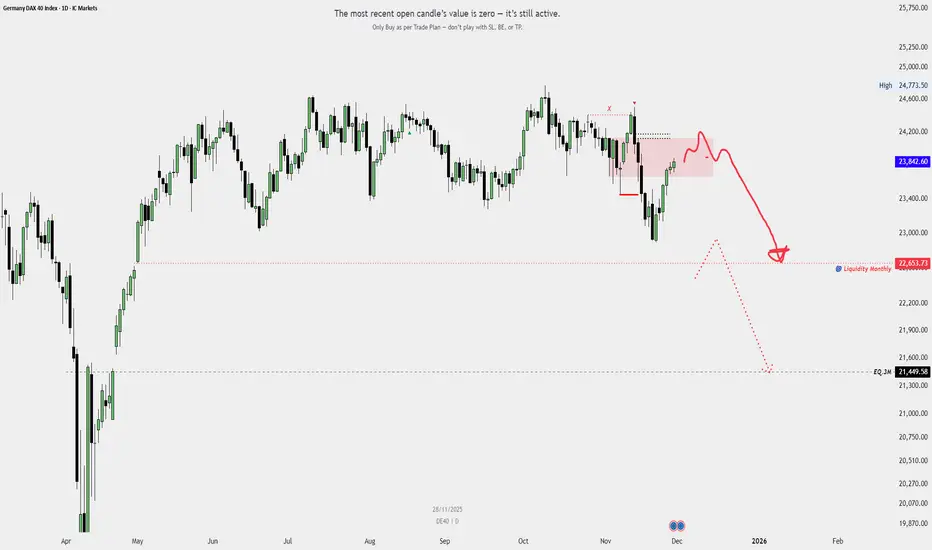
Germany 40 index Dax Swept High,s Running Low,sGermany 40 index Dax Swept High,s Running Low,s
Market structure shifted completely bearish.
once in lower time frame Mss happend i will open short position till Monyjly liqudity,
potential Much Lower.
DAX long after a strong correction-DAX formed an invers head and sholders now I'm very bullish on indices after a very deep correction

GER30 H4 | Bullish Bounce Off key SupportMomentum: Bearish
Price is currently falling toward the buy entry, which acts as an overlap support level.
Buy Entry: 89,034.03
Overlap support
Stop Loss: 81,966.16
Pullback support
Take Profit: 104,866.08
Overlap resistance
Slightly above the 61.8% Fibonacci retracement
High Risk Investment Warning
Stratos Markets Limited (tradu.com ), Stratos Europe Ltd (tradu.com ):
CFDs are complex instruments and come with a high risk of losing money rapidly due to leverage. 70% of retail investor accounts lose money when trading CFDs with this provider. You should consider whether you understand how CFDs work and whether you can afford to take the high risk of losing your money.
Stratos Global LLC (tradu.com ): Losses can exceed deposits.
Please be advised that the information presented on TradingView is provided to Tradu (‘Company’, ‘we’) by a third-party provider (‘TFA Global Pte Ltd’). Please be reminded that you are solely responsible for the trading decisions on your account. Any information and/or content is intended entirely for research, educational and informational purposes only and does not constitute investment or consultation advice or investment strategy. The information is not tailored to the investment needs of any specific person and therefore does not involve a consideration of any of the investment objectives, financial situation or needs of any viewer that may receive it. Past performance is not a reliable indicator of future results. Actual results may differ materially from those anticipated in forward-looking or past performance statements. We assume no liability as to the accuracy or completeness of any of the information and/or content provided herein and the Company cannot be held responsible for any omission, mistake nor for any loss or damage including without limitation to any loss of profit which may arise from reliance on any information supplied by TFA Global Pte Ltd.

Bullish rise?GER30 is falling towards the support level, which is a pullback support that aligns with the 23.6% Fibonacci retracement and could bounce from this level to our take profit.
Entry: 23,644.94
Why we like it:
There is pullback support at the 23.6% Fibonacci retracement.
Stop loss: 23,351
Why we like it:
There is a pullback support that aligns with the 50% Fibonacci retracement.
Take profit: 24,369.29
Why we like it:
There is a pullback resistance level.
Enjoying your TradingView experience? Review us!
Please be advised that the information presented on TradingView is provided to Vantage (‘Vantage Global Limited’, ‘we’) by a third-party provider (‘Everest Fortune Group’). Please be reminded that you are solely responsible for the trading decisions on your account. There is a very high degree of risk involved in trading. Any information and/or content is intended entirely for research, educational and informational purposes only and does not constitute investment or consultation advice or investment strategy. The information is not tailored to the investment needs of any specific person and therefore does not involve a consideration of any of the investment objectives, financial situation or needs of any viewer that may receive it. Kindly also note that past performance is not a reliable indicator of future results. Actual results may differ materially from those anticipated in forward-looking or past performance statements. We assume no liability as to the accuracy or completeness of any of the information and/or content provided herein and the Company cannot be held responsible for any omission, mistake nor for any loss or damage including without limitation to any loss of profit which may arise from reliance on any information supplied by Everest Fortune Group.

Technical Analysis WeeklyGermany 40 is in a neutral range after avoiding a major breakdown, trading at 23,503 near the VWAP of 23,616. RSI at 44.9 indicates indecision. Support is at 22,866, resistance at 24,366.
Wall Street remains bullish but is now in a correction phase, trading at 47,515 above the VWAP at 46,903 but below former highs. RSI at 56.9 suggests a resumption of bullish momentum. Support is at 45,592, resistance at 48,214.
UK 100 continues to trend bullishly but is rebounding inside a correction phase. Price is at 9,707, just above the VWAP of 9,667. RSI at 54.7 reflects neutral momentum. Support is 9,439, with resistance at 9,895.
GBP/USD is in a bearish correction phase - rebounding after a breakdown from its former range, with price at 1.3232 just above VWAP at 1.3155. RSI of 56.2 hints at mild rebound potential. Support is at 1.3043, resistance at 1.3267.
EUR/USD continues within a neutral range, having not taken out significant formers lows, trading at 1.1626 slightly above VWAP of 1.1574. RSI at 58.8 signals modest bullish bias. Support is 1.1497, resistance at 1.1652.
USD/JPY is undergoing a pullback within its bullish trend after testing multi-year highs, trading at 155.12 under the VWAP of 155.50. RSI at 50.8 reflects balanced momentum. Support is at 153.35, resistance at 157.66.
Gold is rallying again after breaking out of a triangle pattern but is still in a correction phase below former highs within its bullish trend, trading at 4,256 above VWAP of 4,117. RSI at 66.3 signals continued strength. Support lies at 3,986 with resistance at 4,256.
Brent Crude remains in a neutral range, having avoided a breakdown below the key 6,000 figure, trading at 6,310 on top of its VWAP of 6,300. RSI at 49.3 indicates balanced conditions. Support is at 6,140, with resistance at 6,481.

DAX Expanding Wedge Long Setup — Bottom Retest + False BreakDAX is trading inside a broadening/expanding wedge within a larger uptrend. Price has recently swept the lower boundary and faked below a short-term trendline, showing signs of a downside trap.
DAX CALL FOR BUYGermany is showing a strong resistence with a solid economy and industry , making this year a year of resistence and potetil loss , but the comeback is hard ; take you position once the price get out of the zone where buyer are waiting

DAX Wave Analysis – 27 November 2025- DAX reversed from support area
- Likely to rise to resistance level 24000.00
DAX index recently reversed from support area between the support level 23000.00 (lower border of the sideways price range inside which the price has been moving from June) and the lower daily Bollinger Band.
The upward reversal from this support area stopped the previous minor impulse wave C of the intermediate ABC correction (4) from July.
Given the clear daily uptrend, DAX index can be expected to rise to the next resistance level 24000.00.
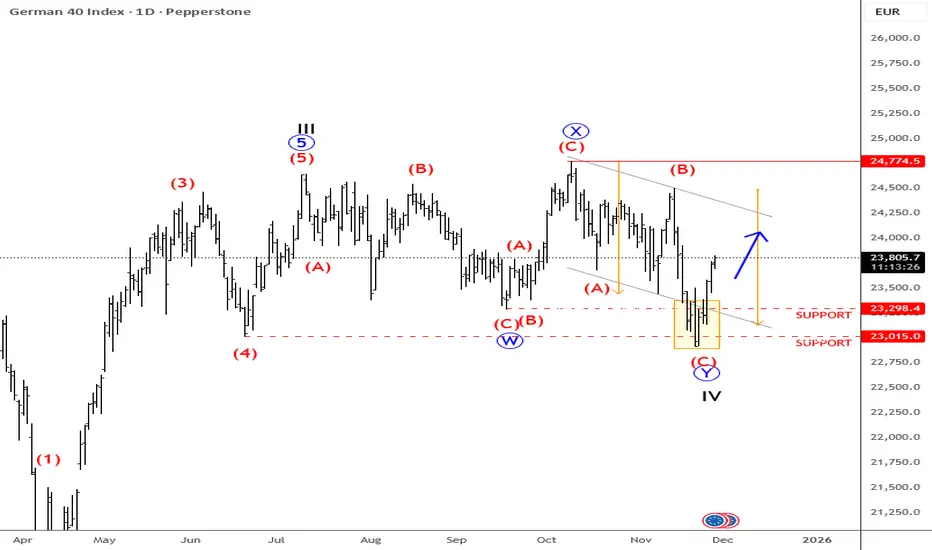
DAX: When Chopy Price Action Calls Next Clear Move German DAX was very non-directional, basically since June of 2025 and what I see is some very nasty moves on both sides of the market, but what got my attention recently is that the price has stopped at key support levels around 23k to 23300 area, from where we can see a very interesting and strong rebound.
What is most important is that this rebound is coming after only three waves down from all-time highs, so it can be part of a WXY complex correction here in a fourth wave. Of course there can be some other labelings as well, but with any approach you will probably come out with the same idea that this whole price action in this five to six month range is corrective, and whenever we see a correction we know that sooner or later it should be fully retraced, meaning the price could already be headed back toward the highs from current levels.
So I think that as long as we hold 23k, there can be some potential opportunities on intraday retracements on smaller time frames.
GH
$DAX dip to go longDAX moved as per plan since last week (). A nice re-test of the descending trendline and a 600 pts move higher. Probably a quiet trading day today but 23610 presents a good opportunity to go long off to 23970, confluence of algo levels.

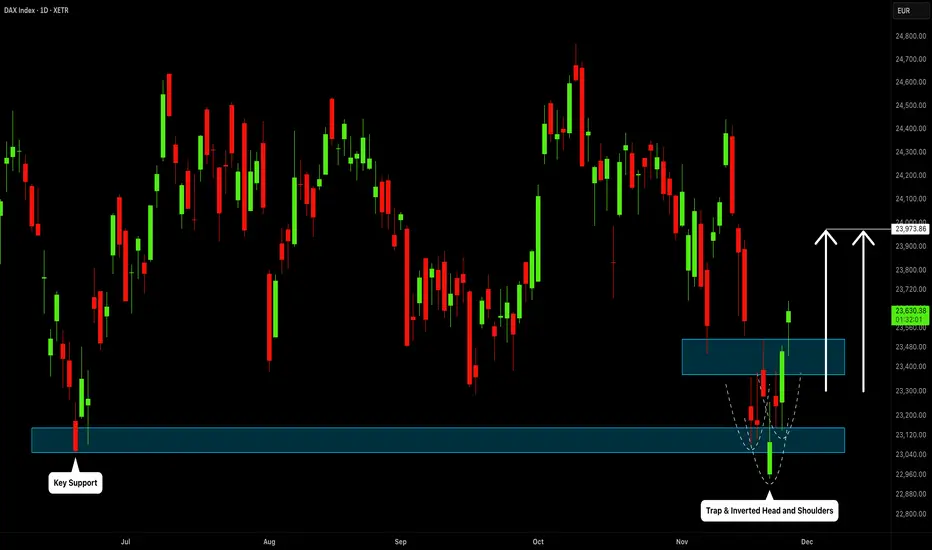
DAX INDEX: Finally Bullish?!
I see a confirmed bearish trap on DAX index
after a test of a key historic support.
An inverted head & shoulders pattern formation
and a bullish violation of its neckline provide strong
signal.
I expect a recovery at least to 24000 now.
❤️Please, support my work with like, thank you!❤️
DAX40 support at 23445The DAX remains in a bullish trend, with recent price action showing signs of a breakout within the broader uptrend.
Support Zone: 23446 – a key level from previous consolidation. Price is currently testing or approaching this level.
A bullish rebound from 23446 would confirm ongoing upside momentum, with potential targets at:
23950 – initial resistance
24140 – psychological and structural level
24380 – extended resistance on the longer-term chart
Bearish Scenario:
A confirmed break and daily close below 23446 would weaken the bullish outlook and suggest deeper downside risk toward:
23350 – minor support
23200 – stronger support and potential demand zone
Outlook:
Bullish bias remains intact while the DAX holds above 23446. A sustained break below this level could shift momentum to the downside in the short term.
This communication is for informational purposes only and should not be viewed as any form of recommendation as to a particular course of action or as investment advice. It is not intended as an offer or solicitation for the purchase or sale of any financial instrument or as an official confirmation of any transaction. Opinions, estimates and assumptions expressed herein are made as of the date of this communication and are subject to change without notice. This communication has been prepared based upon information, including market prices, data and other information, believed to be reliable; however, Trade Nation does not warrant its completeness or accuracy. All market prices and market data contained in or attached to this communication are indicative and subject to change without notice.

DAX40 reachi8ng resistance at 23550The DAX40 is currently trading with a bearish bias, aligned with the broader downward trend. Recent price action shows a retest of the support, suggesting a possibility of a temporary relief rally within the downtrend.
Key resistance is located at 23550, a prior consolidation zone. This level will be critical in determining the next directional move.
A bearish rejection from 23550 could confirm the resumption of the downtrend, targeting the next support levels at 23093, followed by 22800 and 22580 over a longer timeframe.
Conversely, a decisive breakout and daily close above 23550 would invalidate the current bearish setup, shifting sentiment to bullish and potentially triggering a move towards 23790, then 23980.
Conclusion:
The short-term outlook remains bearish unless the DAX40 breaks and holds above 23550. Traders should watch for price action signals around this key level to confirm direction. A rejection favours fresh downside continuation, while a breakout signals a potential trend reversal or deeper correction.
This communication is for informational purposes only and should not be viewed as any form of recommendation as to a particular course of action or as investment advice. It is not intended as an offer or solicitation for the purchase or sale of any financial instrument or as an official confirmation of any transaction. Opinions, estimates and assumptions expressed herein are made as of the date of this communication and are subject to change without notice. This communication has been prepared based upon information, including market prices, data and other information, believed to be reliable; however, Trade Nation does not warrant its completeness or accuracy. All market prices and market data contained in or attached to this communication are indicative and subject to change without notice.

Is the DAX Preparing for a Monster Rally? The Structure Says So.The DAX continues to follow a well-defined Elliott Wave structure across the higher time frames. Following the completion of Wave 1 at the prior cycle top, the subsequent corrective phase retraced efficiently into the 0.618 Fibonacci region, establishing a structurally sound Wave 2 low. Since then, price has progressed through a multi-year impulsive advance, with internal subdivisions aligning cleanly with higher-probability Fibonacci extensions.
Current price action is positioned within the latter stages of an extended Wave 3 sequence, where the 2.618 extension zone presents a significant confluence region for a potential medium-term top. A controlled corrective phase is expected thereafter, forming Wave 4 before the index resumes its structural bullish trajectory toward the projected Wave 5 completion.
This long-term framework remains valid as long as structural lows are preserved, with the broader trend supporting continued upside over the coming cycles.
⚠️ Disclaimer
This analysis is provided for educational purposes only and does not constitute financial advice. Trading financial markets involves risk, and you are solely responsible for your own investment decisions. Always conduct your own research and use proper risk management.
If you found this analysis valuable, leave a like, drop your thoughts in the comments, and follow for more structured market insights.

Navigating the 23,200 Battleground – Squeeze Before the Surge?🇩🇪 GER40 Navigating the 23,200 Battleground – Squeeze Before the Surge? | 25 Nov
Live Spot: 23,215.0 | European Open Session | 09:43 UTC+4
━━━━━━━━━━━━━━━━━━━━━━━━━━━━━━
🔍 Structural Context
The German index finds itself locked within a compression zone after Friday's aggressive run toward 23,300. Price is now coiling tightly beneath overhead supply, with sellers capping advances near the upper Bollinger envelope. The broader Dow Theory structure remains constructive – higher highs and higher lows on the daily chart confirm an intact uptrend, though intraday momentum shows hesitation.
📊 Timeframe Dissection
5M/15M: Choppy price action oscillating between 23,180 and 23,260. RSI hovering at midline (48-52 range), indicating indecision. Scalpers should await a clean break of this micro-range.
30M: A subtle bullish flag materializing post last week's rally leg. Pole measured at 180 points suggests a breakout target near 23,440.
1H: VWAP stationed at 23,205 – acting as the session's equilibrium line. Price trading marginally above signals mild buyer control.
4H: Ichimoku reveals price riding above the Kumo cloud with Chikou Span confirming bullish alignment. However, flat Senkou Span B hints at consolidation ahead.
🎯 Critical Price Architecture
Upside Barrier: 23,280 – 23,350 (supply shelf + 1.618 Fib extension zone)
Downside Floor: 23,120 – 23,050 (demand pocket + rising 21 SMA confluence)
🔮 Wave & Pattern Synthesis
From an Elliott lens, GER40 appears mid-flight within wave of a five-wave impulse originating from early November lows. The corrective wave terminated cleanly at 22,900, and current price behavior suggests accumulation before the next thrust. Gann time analysis points to potential acceleration post 10:30 UTC today.
Wyckoff interpretation aligns with Phase D markup – signs of strength evident as price absorbs selling pressure without meaningful retracement.
━━━━━━━━━━━━━━━━━━━━━━━━━━━━━━
💎 Primary Setup – Long Momentum Play
Entry Zone: 23,180 – 23,210 (demand retest)
Stop Loss: 23,090 (below structural floor)
Target 1: 23,320 (initial resistance)
Target 2: 23,420 (flag projection)
R:R Ratio: ~1:2.8
💎 Secondary Setup – Fade at Resistance
Entry: 23,340 – 23,360 (on exhaustion candle)
Stop Loss: 23,410
Take Profit: 23,220
━━━━━━━━━━━━━━━━━━━━━━━━━━━━━━
⚠️ Session Caution: German IFO data release could inject volatility. Pre-position with reduced size until post-news price discovery completes.
Discipline over prediction. Execute the plan. 🎯

Technical Analysis WeeklyGermany 40 has continued higher over the past week but remains inside its broader range, trading at 24,075 above the VWAP of 23,499. RSI at 57.8 indicates increasing momentum. Support is found at 22,855, with resistance matching the current high at 24,075.
Wall Street continues in a bullish trend and is retesting all time highs, in what could see the sideways correction continue or a breakout. Price is trading at 47,947 above its VWAP of 46,853. RSI at 60.6 reflects growing bullish sentiment. Support is at 45,454, with resistance at 48,253.
UK 100 remains in a bullish trend but is still in a corrective phase. It’s trading at 9,659, just above its VWAP of 9,622. RSI at 49.6 suggests neutral momentum. Support lies at 9,478, while resistance is at 9,757.
GBP/USD continues its near term rebound but the bigger picture is one of a down-sloping price range. It trades at 1.3317, well above the VWAP of 1.3203. The RSI of 61.3 supports the upward momentum. Support sits at 1.3018, and resistance is at 1.3388.
EUR/USD sits at the top of its short term range, in the middle of its longer term sideways range. It trades at 1.1650, above the VWAP at 1.1592. The RSI at 60.0 confirms strengthening momentum. Support is at 1.1500, with resistance at 1.1693.
USD/JPY remains in a bullish trend but is undergoing a correction. It trades at 155.33, slightly under the VWAP at 156.88. The RSI at 54.1 shows moderate momentum. Support is at 154.38 and resistance at 157.28.
Gold has tracked sideways since breaking back over 4200, with upside momentum supported by an uptrend line, currently trading at 4,204 above its VWAP of 4,146. RSI at 60.2 indicates continued buying strength. Support is at 4,020, resistance at 4,272.
Brent Crude is still trading sideways with a slight bias lower. Price is 6,303, sitting just under the VWAP of 6,436. RSI at 48.9 shows muted enthusiasm. Support is at 6,153 and resistance at 6,436.
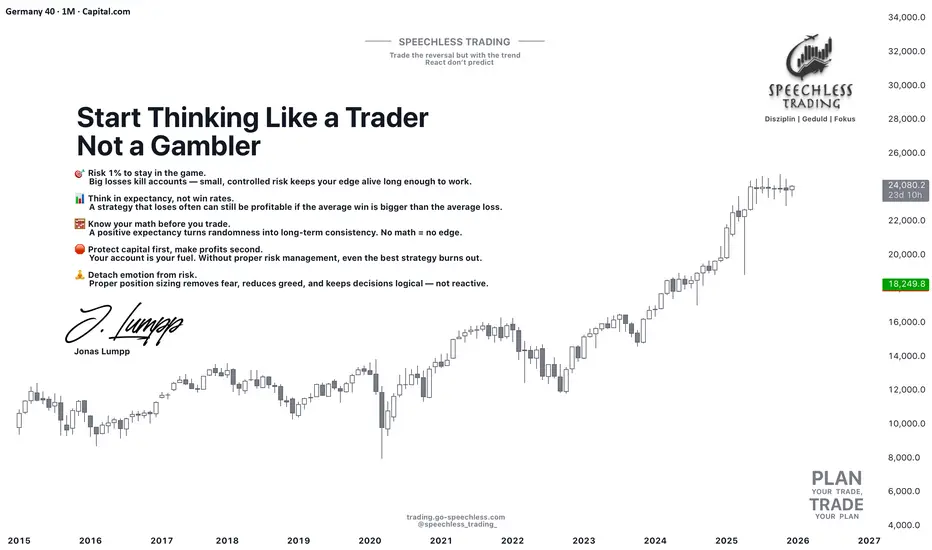
Risk Management Basics 95% of Traders IgnoreWhen traders try to improve their results, they often jump straight to indicators, new setups, or refined entries.
But here’s the uncomfortable truth:
Most traders don’t fail because of their strategy — they fail because they don’t control their risk.
Let’s break down the two fundamentals that separate professionals from the 95%:
1️⃣ The 1% Rule: Your Built-In Survival System
Most beginners risk 5–20% per trade.
Professionals risk a maximum of 1%. Why?
Because the goal isn’t to win every trade — the goal is to stay in the game long enough for your edge to play out.
Risking only 1% means:
✔ A losing streak won’t destroy your account
✔ Your emotions stay stable and rational
✔ Your system has room to unfold statistically
✔ You avoid the #1 account killer: overexposure
Here’s the key mindset shift:
Risk management is not about fear — it’s about increasing your probability of long-term profitability.
2️⃣ Positive Expectancy: The Math Behind Winning Traders
Most traders judge a setup based on the last one or two trades.
Professionals evaluate it based on expectancy — the average profit per trade across a large sample.
Here’s a simple example:
Win rate: 40%
Average win: +60 pips
Average loss: –30 pips
Expectancy =
(0.4 × 60) – (0.6 × 30) = +6 pips per trade
Meaning:
You can lose more trades than you win — and still be profitable.
This is the principle beginners never understand.
A system with positive expectancy + 1% risk per trade becomes extremely powerful.
You stop caring about individual losses and start thinking in probabilities, not emotions.
The Truth Most Traders Miss
➡️ Risk management is the strategy.
➡️ Expectancy matters more than your win rate.
➡️ Risking 1% won’t make you rich fast — but it will prevent you from blowing up.
➡️ Trading becomes easier when you remove the illusion of certainty.
If traders spent more time understanding expectancy and risk instead of chasing “perfect setups,” half of their frustration would disappear overnight.
Thanks for reading — and have a disciplined start to your trading week!
If you found this post valuable, let me know in the comments.
I might create a full series on applied risk management and expectancy modeling.
Jonas Lumpp
Speechless Trading
Disclaimer: This tutorial is for educational purposes only and does not constitute financial advice. Its goal is to help traders develop a professional mindset, improve risk management, and make more structured trading decisions.
Germany 40 (DAX) – Daily TF Sell Limit at ResistanceGermany 40 (DAX) – Daily TF Sell Limit at Resistance
Germany 40 has been moving in a broader upward channel but is now approaching a key daily resistance zone where price has previously rejected.
Momentum on the recent rally is slowing, showing signs of exhaustion near resistance.
Daily Resistance Zone: A strong supply area where price reversed multiple times.
Sell Limit Area: Positioned slightly below the main resistance to catch early rejection.
Stop Loss: Above the resistance / above previous daily swing high.


Technical Analysis WeeklyGermany 40 looks bearish with a possible breakdown from its current trading range. Trading at 23,283 and below the VWAP of 23,710, RSI at 39.7 supports a more negative sentiment. Support lies at 22,917, while resistance is at 24,504.
Wall Street remains bullish but is now in a correction phase, trading at 46,237 under the VWAP at 46,953. RSI at 42.2 suggests weakening momentum and potential for deeper pullback. Support is at 45,684, resistance at 48,223.
UK 100 continues to trend bullishly but has entered a correction phase. Price is at 9,567, beneath the VWAP of 9,686. RSI at 45.3 reflects neutral to soft momentum. Support is 9,456, with resistance at 9,915.
GBP/USD remains bearish and in a sideways correction. Price is 1.3122, slightly below the VWAP at 1.30914 and broken support at 1.3150. RSI of 38.6 suggests limited rebound potential. Support is 1.3034, resistance at 1.3208.
EUR/USD continues in a bearish leg of an otherwise neutral market, having not broken down past major support. The price is 1.1548 right at the VWAP. RSI at 44.7 indicates ongoing indecision. Support sits at 1.1470, resistance at 1.1638.
USD/JPY holds a bullish impulse structure, trading at 157.41 above the VWAP of 156.85, however there was a bearish engulfing candlestick at resistance from the January peak. RSI at 68.4 - down from very overbought levels signals slowing upwards momentum. Support is at 152.18, resistance at 157.41.
Gold remains in a correction of its bullish trend, trading at 4,069 just above VWAP of 4,068.94. The correction is contracting, which will lead to a resumption of the trend or an extended correction. RSI at 51.0 indicates balanced momentum. Support is 3,916 with resistance at 4,196.
Brent Crude has broken down to its lowest levels since October but remains above the critical $60 level, with price at 6,191 below VWAP at 6,357. RSI at 40.3 reflects downside pressure. Support is 6,105 and resistance is 6,553.