Russell 2000: Massive Breakout or Brutal Rejection?1) Technical Analysis
The Russell 2000 (RUT) has reached a major multi-year resistance zone at 2450–2550 — a level that rejected price repeatedly since 2021.
Key observations:
• A massive long-term Cup Pattern is visible, and the price is now at the top of the cup.
• Initial rejection is visible, indicating selling pressure around the same historical zone.
• SMA50 is holding as dynamic support.
• Momentum is weakening → risk of correction if breakout fails.
2) Forward Scenarios
Bullish Scenario (Breakout Case)
If price closes above 2550, the giant Cup breaks out and a strong bull run can begin.
Targets:
• Target 1: 2650
• Target 2: 2750
• Target 3: 2850 (Cup Pattern target)
Stop-Loss (Bullish):
• Below 2445
• Breakdown of SMA50 = trend weakening
Bearish Scenario (Rejection Case)
If price fails again at this historically powerful resistance:
Targets:
• Target 1: 2320
• Target 2: 2280
• Target 3: 2135 (major support)
Stop-Loss (Bearish):
• Close above 2550
3) Fundamental Quick View
RUT represents small-cap companies which are heavily tied to interest rates, credit conditions, and regional banks.
Summary:
• Upcoming Fed easing in 2025–26 → strong positive catalyst
• Stabilizing regional banks → reduced systemic risk
• Revenue growth still slower than large caps → breakout requires strong catalysts
• Needs macro confirmation: rate cuts, better liquidity, or earnings growth
Fundamental conclusion:
Medium-term outlook improving, but a breakout still requires confirmation.
Trade ideas

US Small Caps (Russell 2000) Vs Ethereum (ETH) CHART ANALYSIS & BIAS
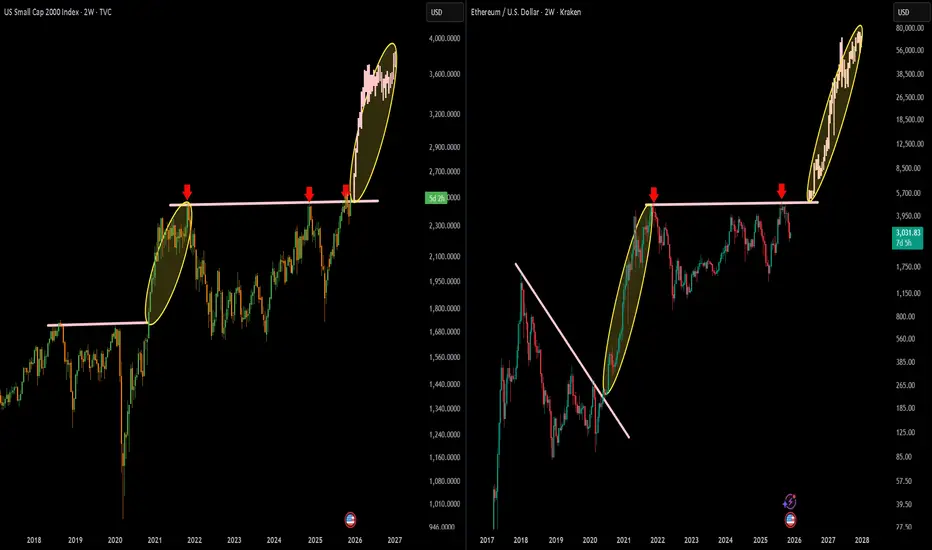
I am comparing US Small Caps (Russell 2000) on the left with Ethereum (ETH) on the right.
Both charts show identical structural behavior:
A long multi-year accumulation / resistance zone
A clean breakout
A vertical markup phase immediately after reclaiming the key level
Strong momentum continuation inside the yellow ellipse
My comparison highlights that ETH tends to follow macro-risk assets, especially small caps, during high-liquidity phases.
📈 LEFT CHART – RUSSELL 2000 (Small Caps)
Key Observations:
Multi-year resistance around 2,350–2,400 (pink line) rejected price multiple times.
When broken in 2020–2021, price exploded +41.79% (highlighted region).
Current breakout (2025) is replicating the same behavior:
Strong impulse
Consecutive bullish candles
No meaningful retracement yet
Risk-on money rotating back into small caps
Macro Implication
Small caps pump when liquidity returns → very bullish signal for crypto.
📈 RIGHT CHART – ETHEREUM (ETH/USD)
Key Observations:
Clean downtrend break in 2020 triggered a +2,264% mega rally (your highlighted zone).
ETH is now doing the same pattern:
Broke a multi-year neckline around $3,950–$4,000
Strong breakout continuation
Vertical markup phase identical to 2020 run
Market Structure
ETH is:
✔ In price discovery mode
✔ Above all major resistances
✔ Showing strong momentum after multi-year accumulation
✔ Mirroring small-cap breakout behavior
📌 FINAL BIAS (COMBINED MACRO + TECHNICAL)
🔥 My Bias is STRONGLY BULLISH for ETH (and crypto overall).
Why?
Macro liquidity rotation → small caps leading = historically extremely positive for crypto.
ETH repeating its 2020 breakout structure → identical vertical markup formation.
Multi-year resistance reclaimed → ETH enters the expansion phase of bullish cycle.
No real resistance above until $7k–$8k based on structure.
Confluence between traditional risk assets & ETH confirms the breakout strength.
🎯 Short-Term Bias (Next Weeks)
Bullish continuation
Possible shallow pullbacks but structure is aggressively upward
Targets: $4,800 → $5,700 → $7,000
🎯 Mid-Term Bias (Cycle Outlook)
ETH mirrors its previous cycle: strong markup phase
Potential targets: $10,000–$14,000 within cycle expansion
US2000 Momentum Rebuilds After Triangular MA Retest🚀 US2000 Bullish Setup – Triangular MA Pullback Play (Layered Entry Blueprint) 🚀
✨ Asset: US2000 – Small-Cap U.S. Index
📅 Trade Style: Day / Swing
🎯 Bias: Bullish Continuation confirmed through Triangular Moving Average Pullback
📌 Trade Plan – Clean & Clear
📈 Bullish Structure Confirmed
The price retest on the Triangular Moving Average shows buyers stepping in aggressively, signalling a strong continuation phase. This is where momentum traders and swing players gain the best advantage.
🧠 Thief Strategy – Layered Limit Entries (Multi-Order Method)
To manage volatility + trap liquidity like a pro, we use layered buy limits.
🔽 Buy Limit Layers (Flexible Based on Your Style):
2470
2480
2490
2500
(Feel free to add more layers based on your own capital, risk model, or spread environment.)
This layered technique helps you:
⚡ Catch deeper pullbacks
⚡ Reduce average entry cost
⚡ Beat market whipsaws
⚡ Accumulate position silently like a true OG
🛑 Stop Loss – Safety First
SL: 2450
Dear Ladies & Gentlemen (Thief OGs), adjust this SL as per your strategy, risk appetite, and volatility conditions.
This is not a forced SL — your account, your rules.
🎯 Target – Exit with Profits, Not with Ego
Our take-profit sits near:
TP: 2570
Why?
🔼 Moving averages above are acting as a strong dynamic resistance zone
🔼 Market nearing overbought territory
🔼 Potential bull trap zone, so escape elegantly with profits
Again, OGs — your TP is your own choice. Manage your bag with discipline.
📊 Market Psychology & Structure Insight
The US2000 typically reacts faster to sentiment compared to big indices like SPX or NASDAQ because small-caps absorb liquidity shocks quicker.
This bullish pullback presents a classic “buy the dip into MA” play — a favourite among swing traders.
🌐 Related Pairs To Watch (Correlation Keynotes)
💵 SP:SPX / AMEX:SPY (S&P 500)
Strong positive correlation
If SPX is bullish, US2000 usually follows with stronger momentum
Watch SPX’s 4H trend for confirmation
📈 NASDAQ:NDX / NASDAQ:QQQ (NASDAQ 100)
When tech rallies, small-caps often catch delayed momentum
A strong NASDAQ risk-on pulse boosts US2000 sentiment
📉 TVC:DXY (U.S. Dollar Index)
Inverse correlation
Weak DXY boosts equities (US2000 included)
If DXY drops, small-cap indices often pump harder
TVC:VIX (Volatility Index)
Direct risk-sentiment indicator
Falling VIX = bullish for US2000
Rising VIX = be cautious with new entries
💼 TVC:DJI (Dow Jones)
Large caps lead in stability
When Dow is stable/bullish → risk-on spillover increases small-cap flows
📝 Final Thought
This setup suits traders who love structured pullbacks, clean MA-based momentum, and layered entries. Manage risk, scale smart, and take profit with intention — not emotion.

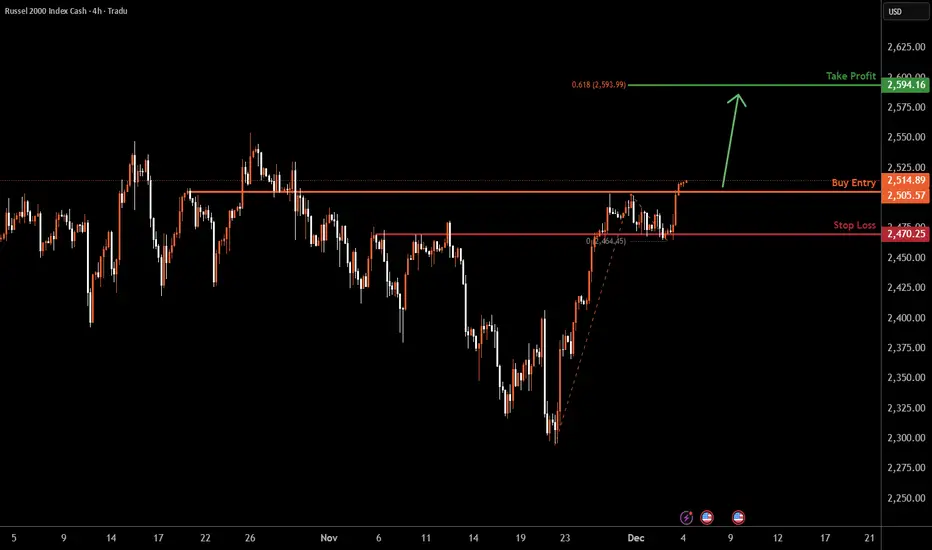
US2000 H4 | Bullish Momentum To ExtendMomentum: Bullish
Price has reacted well off the buy-entry level, which also aligns with an overlap support level.
Buy Entry: 2,513.55
Overlap support
Stop Loss: 2,470.25
Overlap support
Take Profit: 2,594.16
61.8% Fibonacci projection
High Risk Investment Warning
Stratos Markets Limited (tradu.com ), Stratos Europe Ltd (tradu.com ):
CFDs are complex instruments and come with a high risk of losing money rapidly due to leverage. 70% of retail investor accounts lose money when trading CFDs with this provider. You should consider whether you understand how CFDs work and whether you can afford to take the high risk of losing your money.
Stratos Global LLC (tradu.com ): Losses can exceed deposits.
Please be advised that the information presented on TradingView is provided to Tradu (‘Company’, ‘we’) by a third-party provider (‘TFA Global Pte Ltd’). Please be reminded that you are solely responsible for the trading decisions on your account. Any information and/or content is intended entirely for research, educational and informational purposes only and does not constitute investment or consultation advice or investment strategy. The information is not tailored to the investment needs of any specific person and therefore does not involve a consideration of any of the investment objectives, financial situation or needs of any viewer that may receive it. Past performance is not a reliable indicator of future results. Actual results may differ materially from those anticipated in forward-looking or past performance statements. We assume no liability as to the accuracy or completeness of any of the information and/or content provided herein and the Company cannot be held responsible for any omission, mistake nor for any loss or damage including without limitation to any loss of profit which may arise from reliance on any information supplied by TFA Global Pte Ltd.
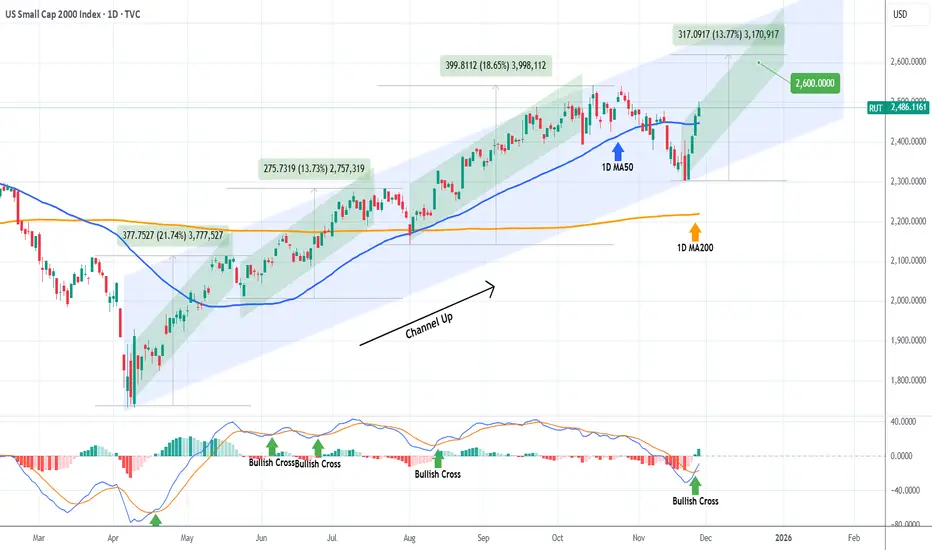
RUSSELL targeting 2600 on this Bullish Leg.Russell 2000 (RUT) has been trading within an 8-month Channel Up since the April 07 market bottom and following its latest correction (Bearish Leg), it recovered this week its 1D MA50 (blue trend-line), having already started the new Bullish Leg.
The minimum rise a Bullish Leg had within this pattern has been +13.73%. As a result, we expect the current one to hit at least 2600. Notice also the 1D MACD Bullish Cross, which has always been a confirmation of a new rally.
---
** Please LIKE 👍, FOLLOW ✅, SHARE 🙌 and COMMENT ✍ if you enjoy this idea! Also share your ideas and charts in the comments section below! This is best way to keep it relevant, support us, keep the content here free and allow the idea to reach as many people as possible. **
---
💸💸💸💸💸💸
👇 👇 👇 👇 👇 👇
Russell 2000 will start outperforming NasdaqIMO the reversal is here for technology companies. Smaller companies will start outperforming Mega Caps. This will be because investors are looking for higher returns by taking more risk.
Smaller companies have a higher potential stock price appreciation but are more risky.
In 2000, this RUT/NASDAQ ratio reversal marked the top in the Nasdaq. I think we are close but might still have room to grow.
Oct-Nov 2025 Top?

R2Klooking at this chart I feel like too many threw in the towel too quick .
A little over 18 hours left for the weekly things seem very bullish.

Russell 2000 >>>> NASDAQWill the RUT Russell 2000 start outperforming the Nasdaq?
Look at 2000. The market top was at the reversal point. Nasdaq crashed faster than small caps.

3 SESSION SETUP HORN WITH PARALEL CANAL INSIDE REVERSAL3 session horn with paralel canal inside patern in patern

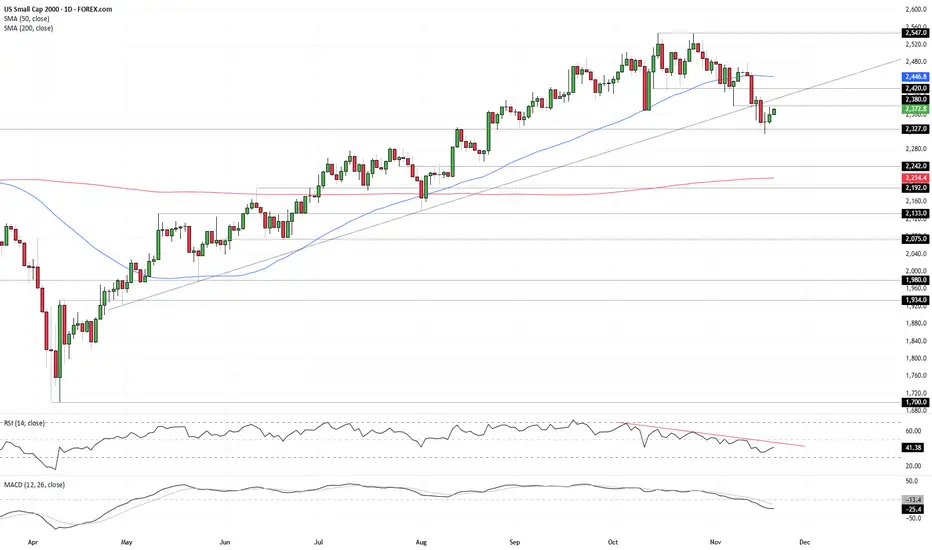
Momentum Weak Despite Nvidia BoostShould small-cap U.S. equities be rallying because AI giant Nvidia just delivered another blowout earnings update? Sure, risk sentiment has improved, and continued AI investment comes with some immediate broader economic benefits, but the move still comes across as a little suspect, especially with the prospect of near-term Fed rate cuts dwindling by the day. While the price signals for our small-cap contract are pointing to upside risks, momentum indicators are not confirming, suggesting selling into strength may be the way to play it, especially if we see a reversal pattern.
Looking at the daily chart, we see a clear morning star bullish reversal pattern printed this week, with follow-through buying after the Nvidia results. However, as was the case in the prior session, the price has been unable to take out 2380 so far, marking the low struck on November 7. It’s only a minor level, but it has seen price action on either side of it this month, making it relevant when assessing setups.
Despite the bullish price signal, RSI (14) and MACD remain firmly bearish. RSI continues to trend lower beneath 50, indicating downside pressure remains even if it’s weakened a touch in recent days. MACD also sits in negative territory, having already crossed the signal line from above in late October. It too is showing signs of turning, but for now the combined message remains one where selling into strength may be the better way to play it.
Should the price be unable to breach and hold above 2380, shorts could be considered beneath the level with a stop above for protection, targeting 2327 support initially. Should that and Tuesday’s low give way, 2275 or 2242 screen as other downside targets.
Of course, if the price can push above and hold 2380, longs could also be considered, allowing for a stop to be placed beneath to protect against reversal. Such a move may see momentum indicators tilt neutral rather than bearish. If that were to occur, the merits of long trades would be improved. 2400, where the price was capped prior to the latest leg lower, looks as an appropriate initial target, with the 50DMA the next after that.
Good luck!
DS
RUSSEL2000-SHORTSMONTHLY-pull buck phase
CONTEXT-Daily SIBI
entries should be on h1/5mnts depending on your trading style

Small Caps Look VulnerableBe it the longest government shutdown in history, the largest increase in October layoffs since 2003, the increasingly unconvincing price action, shifting momentum picture, or the descending triangle it’s coiling in, the purest cyclical play in the U.S. equity index universe—the U.S. small caps 2000 contract—looks vulnerable to downside.
2420 is where bulls and bears are currently slugging it out, marking support that’s held since mid-October. While the price continues to bounce from the level, the moves are becoming increasingly small, hinting that downside may loom.
A break and close beneath 2420 could see shorts established with a stop above to guard against reversal, targeting 2370 support—an area that’s consistently attracted buyers since September.
RSI (14) is trending lower and sits beneath 50, indicating building downside pressure. MACD is entering negative territory after crossing the signal line from above, suggesting directional risks are skewing lower even if the signal remains neutral for now.
Good luck,
DS

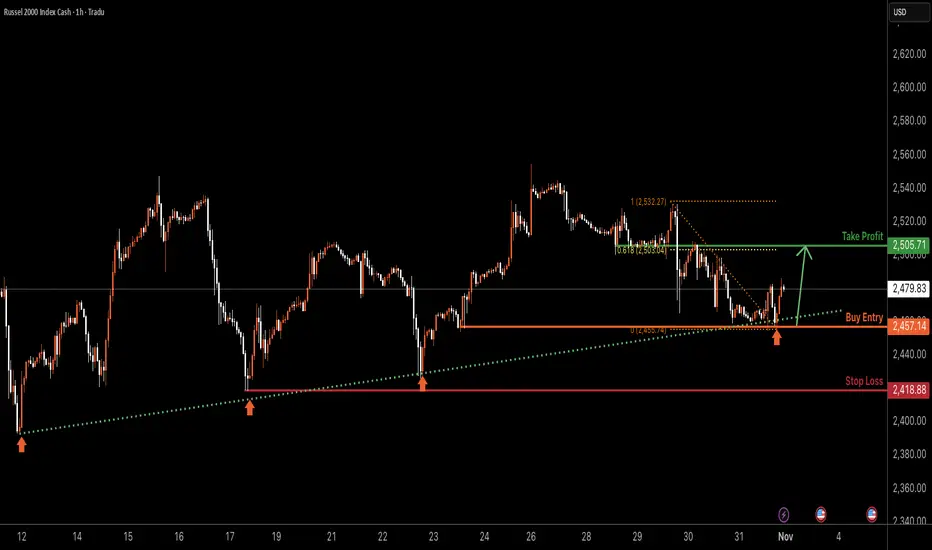
US2000 H1 | Bullish Bounce OffBased on the H1 chart analysis, we can see that the price has bounced off the buy entry, which is a pullback support and could rise from this level to the upside.
Buy entry is at 2,457.14, which is a pullback support.
Stop loss is at 2,418.88, which is a multi-swing low support.
Take profit is at 2,505.71, whic is an overlap resistance that aligns with the 61.8% Fibonacci retracement.
Stratos Markets Limited (tradu.com ):
CFDs are complex instruments and come with a high risk of losing money rapidly due to leverage. 68% of retail investor accounts lose money when trading CFDs with this provider. You should consider whether you understand how CFDs work and whether you can afford to take the high risk of losing your money.
Stratos Europe Ltd (tradu.com ):
CFDs are complex instruments and come with a high risk of losing money rapidly due to leverage. 70% of retail investor accounts lose money when trading CFDs with this provider. You should consider whether you understand how CFDs work and whether you can afford to take the high risk of losing your money.
RUSSELL 25-year Channel Up giving a Sell Signal soon.Russell 2000 (RUT) has been trading within a 25-year Channel Up since the March 2000 High, which was the Top of the A.I. Bubble. Since then it only broke once during the 2008 Housing Crisis. Once recovered, it has used all standard macro levels of Support as short, medium and long-term buy entries respectively, with those being the 1M MA50 (blue trend-line), the 1M MA100 (green trend-line) and the 1M MA200 (orange trend-line).
The April 2025 rebound, which is the market's most recent rally, took place right on the 1M MA100. The index is however approaching the 0.236 Fibonacci level of the Channel Up, which since the 2000 High, has provided almost all rejection points, being the strongest Sell Signal (exception 2021, which was the mega-pump recovery following the March 2020 COVID flash crash).
As you can see, the market has historically started a correction on the 2nd test/ rejection on the 0.236 Fib. Out of those 3 corrections, two of them took place after the index broke above the 0.236 Fib and one just below it. All however have pulled-back to at least the 0.382 (blue) Fib. The key here however is to determine the exact High so that you can draw the 0.382 Fib retracement.
The only condition that most likely won't be fulfilled (as it happened on all previous cases), is that the 1M RSI most likely won't break above the 70.00 overbought level before the correction happens. So there's question mark there.
As for our Target, we expect at least 2230 (Fib 0.382) to get hit around mid 2026.
-------------------------------------------------------------------------------
** Please LIKE 👍, FOLLOW ✅, SHARE 🙌 and COMMENT ✍ if you enjoy this idea! Also share your ideas and charts in the comments section below! This is best way to keep it relevant, support us, keep the content here free and allow the idea to reach as many people as possible. **
-------------------------------------------------------------------------------
💸💸💸💸💸💸
👇 👇 👇 👇 👇 👇

US2000 H1 | Potential Bearish Drop Off US2000 has rejected the sell entry at 2,506.12, which is an overlap resistance and could drop from this level to the downside.
Stop loss is at 2,543.41, which is a swing high resistance.
Take profit is at 2,426.26, which is a multi swing low support.
Stratos Markets Limited (tradu.com ):
CFDs are complex instruments and come with a high risk of losing money rapidly due to leverage. 68% of retail investor accounts lose money when trading CFDs with this provider. You should consider whether you understand how CFDs work and whether you can afford to take the high risk of losing your money.
Stratos Europe Ltd (tradu.com ):
CFDs are complex instruments and come with a high risk of losing money rapidly due to leverage. 70% of retail investor accounts lose money when trading CFDs with this provider. You should consider whether you understand how CFDs work and whether you can afford to take the high risk of losing your money.

Where are we going Russell?I’ve been watching the Russell 2000 (small-cap index) and something feels different this time.
It’s pushing into new highs and the setup suggests we might be on the verge of a real breakout. I’m talking about +20% upside in the coming weeks or months , and not as a distant dream, but as a plausible scenario.
For years the market has toyed with the “ Magnificent 7 ” and passive funds dumping money into the same handful of stocks .
Small-caps were left behind.
But when so many assets are crowded into a few names, it only takes one meaningful shift for the tide to turn. I’m seeing early signs that investors might finally rotate out of mega-caps and into the under-owned smaller stocks. If that happens, the Russell could catch a strong tail-wind and lower Interest rates are also important for Small caps.
On the flip side, I’m keeping one ear open for red flags. If the breakout fails, say, due to a macro twist (rates stay high, growth slows) or passive flows reverse back into large caps, then this move could turn into a bul trap . The chart is showing potential, yes, but momentum can evaporate just as fast if volume doesn’t follow or support this breakout.
So here’s how I’m playing it: I¡ve bought the Russell above that resistance zone, expecting a +15 to 20% move. If instead we see a heavy rejection and roll-over, I’ll be ready to step aside and change my mind. Small-caps are exciting territory, but also unforgiving if the thesis collapses.
This could be the moment when smaller stocks shine again. Or it could be the moment the market reminds us how tricky false breakouts are.
What is your vision in IG:RUSSELL ?

Russell breaks outThe Russell has broken out of its short-term triangle continuation pattern to the upside. If the breakout holds, we could see a run to new all-time highs above 2547 from here. Key support around 2500 has held for now.
Risk appetite remains elevated as markets head into a critical window packed with potential rate cuts, tech earnings, and diplomatic progress between the US and China. The upcoming Trump–Xi meeting has added an extra layer of enthusiasm after Trump signaled possible tariff relief. Confidence in the AI theme continues to drive the rally, with Nvidia’s historic $5 trillion valuation amplifying bullish sentiment across tech-heavy benchmarks like the Nasdaq 100 and S&P 500. But now even the small caps index of 2000 US stocks - the Russell - is joining the rally.
By Fawad Razaqzada, market analyst at FOREX.com

Can the Russell 2000 Lead the Next Bull Wave Above Resistance?📊 RUSSELL 2000: The Ultimate Small-Cap Breakout Blueprint 🚀💰
🎯 Market Overview: IWM Russell 2000 Index Analysis
The Russell 2000 (RUT/IWM) is setting up for what could be a chef's kiss momentum play! 🧑🍳✨ We're tracking a bullish continuation setup backed by triangular moving average confluence and a classic pullback-to-breakout pattern. Small-caps are flexing, and this technical structure screams opportunity for swing and day traders alike.
📈 The Trade Setup (Swing/Day Strategy)
Bias: 🟢 BULLISH
Confirmation: Triangular moving average pullback + volume expansion
Key Level to Watch: 2550.0 (Overbought resistance zone breakout)
🎯 Entry Strategy: Layered Scaling Approach
Primary Entry: Post-breakout above 2550.0 ✅
⚡ Pro Tip: Set price alerts on your platform to catch the breakout in real-time without staring at charts all day!
Layered Entry Levels (Scaling In):
🔹 2500.0
🔹 2510.0
🔹 2520.0
🔹 2530.0
🔹 2540.0
This scaling approach allows you to build your position gradually while managing risk like a pro. 🧠💼
🛑 Risk Management Zone
Stop Loss: 2480.0 🔴
⚠️ Disclaimer: This is MY stop-loss based on technical structure. YOU manage your own risk tolerance! Trade smart, not reckless. Your capital, your rules. 💯
🎯 Profit Target Zone
Target: 2610.0 🎯💰
This zone represents confluence of:
Strong historical resistance
Overbought territory
Potential bull trap zone (watch for exhaustion!)
⚠️ Profit-Taking Note: Lock in gains as we approach target. Don't get greedy—pigs get fed, hogs get slaughtered! 🐷🔪 This is MY target, but YOU decide when to secure profits based on YOUR strategy.
🔗 Related Markets & Correlation Watch
Keep an eye on these correlated assets for confirmation:
Direct Exposure:
AMEX:IWM (iShares Russell 2000 ETF) - Primary tracking vehicle
TVC:RUT (Russell 2000 Index Futures)
Correlation Plays:
AMEX:SPY (S&P 500) - Broad market sentiment gauge
NASDAQ:QQQ (Nasdaq-100) - Tech/growth sector correlation
AMEX:DIA (Dow Jones) - Large-cap comparison
Key Correlation Note: Russell 2000 typically outperforms during risk-on environments and underperforms large-caps during risk-off. Watch for small-cap premium expansion as confirmation of bullish thesis. When IWM/IWM/
IWM/SPY ratio rises, small-caps are leading—bullish for RUT! 📊🔥
Economic Indicators:
TVC:DXY (US Dollar Index) - Inverse correlation (weak dollar = small-cap strength)
TVC:TNX (10-Year Treasury Yield) - Interest rate sensitivity
Regional bank stocks (small-cap economy proxy)
🔑 Key Technical Points
✅ Triangular MA Pullback Complete - Classic retest of support
✅ Volume Profile - Accumulation zone established
✅ 2550.0 Resistance - Break and hold = explosive upside
✅ Risk/Reward Ratio - ~1:1.5+ (70 points risk / 110+ points reward)
✅ Timeframe Alignment - Multi-timeframe confluence supporting the move
⚡ The Thief's Edge: Why This Setup Works
Small-caps are the wild horses of the market—volatile, fast, and rewarding when you ride the trend! 🐎💨 The Russell 2000 represents domestic US growth plays, making it hyper-sensitive to:
Economic optimism cycles
Federal Reserve policy shifts
Risk appetite rotations
This setup capitalizes on momentum continuation after a healthy pullback. We're not catching falling knives—we're riding tested support into breakout territory! 🎯
🧠 Trading Psychology Corner
Remember, folks: The market doesn't care about your entry price. It only cares about supply and demand. Manage risk, scale into winners, and cut losers fast. This isn't financial advice—this is a battle-tested framework for market participants who understand probability over certainty. 🎲📉📈
🙏 Support the Analysis!
✨ If you find value in my analysis, a 👍 and 🚀 boost is much appreciated — it helps me share more setups with the community!
#Russell2000 #RUT #IWM #SmallCaps #TechnicalAnalysis #SwingTrading #DayTrading #Breakout #TriangularMA #MomentumTrading #StockMarket #IndexTrading #TradingStrategy #ChartAnalysis #PriceAction #SupportAndResistance #BullishSetup #TradingView #MarketAnalysis #RiskManagement
Stay sharp, trade smart, and let's catch this wave together! 🌊💰

Russell 2000: Is the lagging small-cap about to charge higher?Russell 2000 is the laggard, while the S&P 500, Nasdaq, and Dow scale new record highs.
Could small caps be next to break out?
While all major US equity indices are hitting new all-time highs, the Russell 2000 is still consolidating just below resistance. This sets up a pivotal moment for traders as the Fed decision looms and Q4 earnings heat up.
Price is holding above the lower trendline of a potential ascending triangle pattern, with buyers defending support and momentum building for a potential breakout above peak resistance.
RSI on a daily basis sits in the mid-50s (neutral), but with room for renewed upside if a breakout occurs. Alternatively, a reset down to oversold could lead to a short-term decline of around 5% to the prior bottom.
But October’s strong earnings and increased bets on Fed rate cuts provide a positive tailwind for small caps this quarter.
Watch for a shift in flows from big tech and mega-caps to small caps if market breadth improves post-Fed.
Keep an eye on the top, as a breakout could open the door to new all-time highs and fresh momentum for the Russell 2000. Don’t miss the rotation potential as Q4 trading picks up.
This content is not directed to residents of the EU or UK. Any opinions, news, research, analyses, prices or other information contained on this website is provided as general market commentary and does not constitute investment advice. ThinkMarkets will not accept liability for any loss or damage including, without limitation, to any loss of profit which may arise directly or indirectly from use of or reliance on such information.

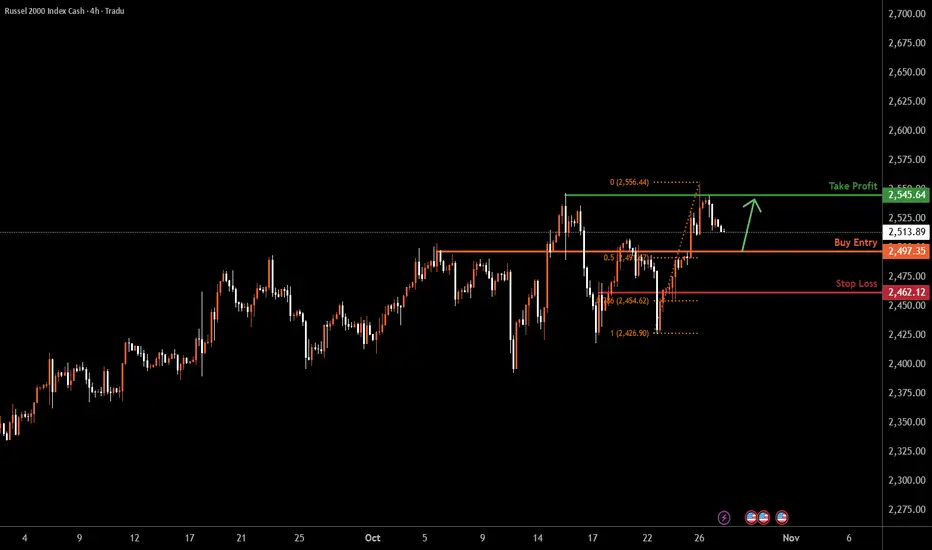
US2000 H4 | Bullish Bounce Off Key SupportUS2000 is falling towards the buy entry, which is an overlap support that aligns with the 50% Fibonacci retracement and could bounce from this level to the upside.
Buy entry is at 2,497.81, which is an overlap support that aligns with he 50% Fibonacci retracement.
Stop loss is at 2,462.12, whic is a pullback support that aligns with he 78.6% Fibonacci retracement.
Take profit is at 2,545.64, which is a multi swing high resistance.
Stratos Markets Limited (tradu.com ):
CFDs are complex instruments and come with a high risk of losing money rapidly due to leverage. 68% of retail investor accounts lose money when trading CFDs with this provider. You should consider whether you understand how CFDs work and whether you can afford to take the high risk of losing your money.
Stratos Europe Ltd (tradu.com ):
CFDs are complex instruments and come with a high risk of losing money rapidly due to leverage. 70% of retail investor accounts lose money when trading CFDs with this provider. You should consider whether you understand how CFDs work and whether you can afford to take the high risk of losing your money.
Ethereum VS. Russell 2000 Russell 2000 index and Ethereum charts follow a strikingly similar pattern.
Both assets peaked in November 2021 and then entered a prolonged correction. Interestingly, both formed major lows around April 2025.
The Russell 2000, just before breaking through the 2021 ATH resistance area, retested the demand zone, just as CRYPTOCAP:ETH is currently doing.
This similarity suggests that Ethereum could be poised for a strong breakout, following in the footsteps of the Russell 2000.
History is sometimes more than just a coincidence…

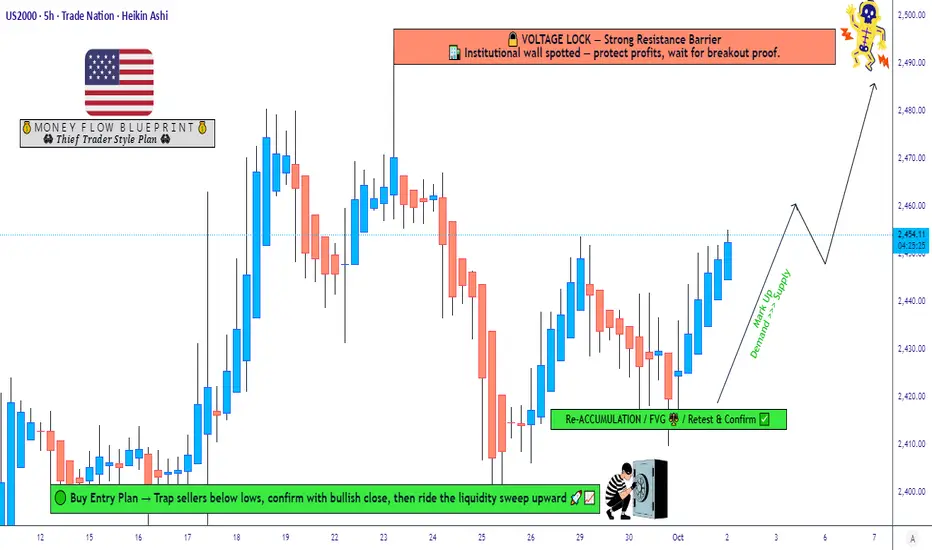
Can Small Caps Outperform as US2000 Approaches Resistance?📊 US2000 Index – Market Wealth Strategy Map (Swing/Day Trade)
Ladies & Gentlemen (Thief OG’s) – here’s a fresh layering entry plan for US2000 with a bullish outlook. This is my playful "Thief Strategy" style — multiple entries, multiple chances, and yes… multiple exits too. 😎
🔑 Plan: Bullish Bias
💸 Entry (Layering Style):
Limit Buy Orders: 2430 / 2440 / 2450
You can expand layers further depending on your own risk appetite.
👉 This layered entry style (a.k.a. Thief Strategy) spreads out execution points to reduce risk of missing the move.
🛡️ Stop Loss (SL):
Thief SL parked at 2410
⚠️ Note: This is my risk level. Please set your SL according to your own money management.
🎯 Target (TP):
2490 → “Voltage Lock” Zone ⚡ (Strong resistance barrier + overbought levels + possible trap area).
⚠️ Note: Not financial advice. I’m sharing my target, but your TP is your choice — secure profits as you see fit.
📌 Correlation Watchlist / Related Pairs:
OANDA:SPX500USD (S&P 500) → often leads the broader market sentiment.
TVC:DJI (Dow Jones 30) → check rotation between large caps vs small caps.
NASDAQ:NDX (Nasdaq 100) → tech moves can spill over into Russell small caps.
TVC:VIX (Volatility Index) → higher volatility can impact layered entries & SL triggers.
Correlation tip: When SP:SPX and NASDAQ:NDX are pumping together, US2000 often follows with strong momentum. But if TVC:VIX spikes, layered buys can get trapped near support levels.
📖 Key Notes:
Layering helps spread entries across multiple levels to avoid emotional panic buys.
The "Voltage Lock" resistance at 2490 is my escape zone. Don’t marry the trade — date it, profit, and leave. 💍➡️💵
This is a strategy style I use — not a recommendation. Trade safe.
✨ “If you find value in my analysis, a 👍 and 🚀 boost is much appreciated — it helps me share more setups with the community!”
📌 Disclaimer: This is a Thief Style Trading Strategy — shared just for fun & educational purposes. Not financial advice.
#US2000 #Russell2000 #SP500 #NASDAQ100 #DowJones #ThiefStrategy #SwingTrade #DayTrading #IndexTrading #TechnicalAnalysis
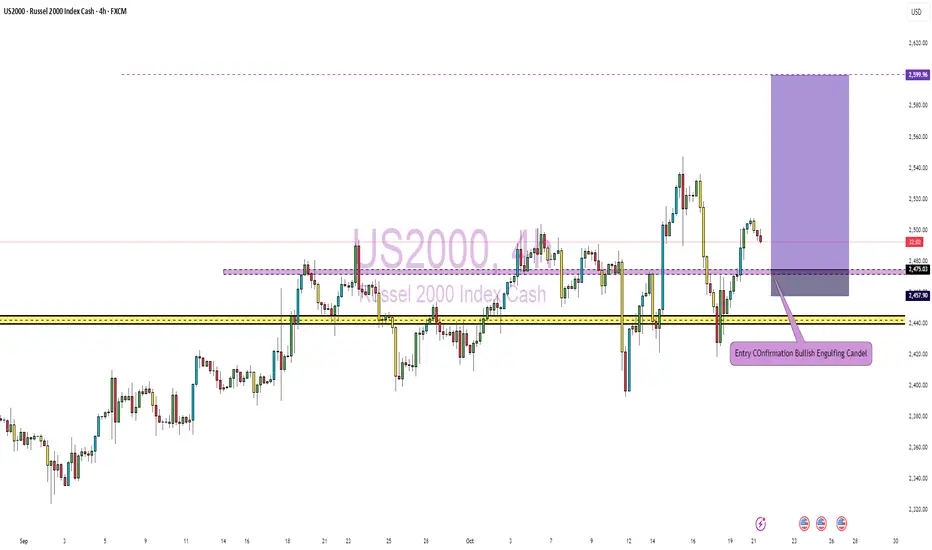
US2000 – Bullish Continuation Setup Confirmed on 4H ChartThe US2000 (Russell 2000 Index) is showing a clear sign of bullish continuation after forming a Bullish Engulfing Candle on the daily timeframe. This candle acts as a strong entry confirmation signal, indicating that buyers are stepping back into control following a period of consolidation.