US30 H1 | Bearish Reversal Off Pullback ResistanceThe price is rising towards the sell entry at 47,761.94, whichis a pullback resistance that aligns with the 50% Fibonacci retracement and could reverse from this level to the downside.
Stop loss is at 48,079.25, which is a multi-swing high resistance.
Take profit is at 47,337.75, which is a pullback support that is slightly above the 50% Fibonacci retracement.
Stratos Markets Limited (tradu.com ):
CFDs are complex instruments and come with a high risk of losing money rapidly due to leverage. 68% of retail investor accounts lose money when trading CFDs with this provider. You should consider whether you understand how CFDs work and whether you can afford to take the high risk of losing your money.
Stratos Europe Ltd (tradu.com ):
CFDs are complex instruments and come with a high risk of losing money rapidly due to leverage. 70% of retail investor accounts lose money when trading CFDs with this provider. You should consider whether you understand how CFDs work and whether you can afford to take the high risk of losing your money.
Trade ideas

Us30-reversal pattern spotted
-will be scalping since there's no break and retest
-shorts will be my investment


US30 Bullish Breakout!
HI,Traders !
#US30 is trading in a strong
Uptrend and the price made a
Bullish breakout of the key
Horizontal level of 46718.2
So we are bullish biased
And we will be expecting a
Further bullish move up !
Comment and subscribe to help us grow !

DowJoned bullish breakout supported at 47260Key Support and Resistance Levels
Resistance Level 1: 48085
Resistance Level 2: 48255
Resistance Level 3: 48500
Support Level 1: 47260
Support Level 2: 47040
Support Level 3: 46880
This communication is for informational purposes only and should not be viewed as any form of recommendation as to a particular course of action or as investment advice. It is not intended as an offer or solicitation for the purchase or sale of any financial instrument or as an official confirmation of any transaction. Opinions, estimates and assumptions expressed herein are made as of the date of this communication and are subject to change without notice. This communication has been prepared based upon information, including market prices, data and other information, believed to be reliable; however, Trade Nation does not warrant its completeness or accuracy. All market prices and market data contained in or attached to this communication are indicative and subject to change without notice.

US30 - Intraday Playbook for NY Session 27/10/2025Here’s my structured 15M game plan heading into the US session today. We’re currently sitting inside a bullish trend, but we’re also at a point where price could either continue higher or shift momentum if key demand levels fail. So I’m prepared for both bullish continuation and a possible bearish reversal scenario.
✅ Overall Trend Context:
Higher highs / higher lows remain intact on the 4H / 1H.
Recent bullish leg may need a liquidity sweep / pullback before continuation.
Key intraday structure levels are now clearly defined.
📈 Bullish Continuation Scenario (Primary Bias)
I’ll look for long setups if price pulls back into demand zones and shows bullish rejection.
⚠️ Valid only while price holds above 47,200.
✅ Long Zone #1: 47,300 – 47,350 (first demand / shallow pullback zone)
✅ Long Zone #2: 47,150 – 47,200 (deeper liquidity pool)
Bullish Confirmation Triggers (15M or 5M):
Rejection wick from demand
Bullish engulfing / candle flip
Break of minor 5M structure after tap
🎯 Bullish Targets:
TP1: 47,450 (reaction zone)
TP2: 47,500 – previous high
TP3: 47,600+ if momentum extends
📉 Bearish Reversal Scenario (Alternate Plan)
I will only shift bearish if price breaks below the key higher-low level.
🔻 Bearish bias becomes active if we break & hold below 47,200.
✅ Plan: Wait for a break → retest of 47,200 – 47,250 as resistance → look for rejection
(5M / 15M bearish engulfing, failed reclaim, or lower high confirmation)
🎯 Bearish Targets:
TP1: 47,050 – first liquidity pocket
TP2: 46,900 – prior swing low / demand zone
TP3: 46,750 – deeper structural support
📍 Key Notes
✅ I won’t chase anything at market open — I’ll wait for liquidity grab and confirmation.
❌ No longs if 47,200 breaks decisively and turns into resistance.
❌ No shorts while above 47,200 unless a clear fakeout rejection occurs at 47,500.

DowJones key support at 47260Key Support and Resistance Levels
Resistance Level 1: 48085
Resistance Level 2: 48255
Resistance Level 3: 48500
Support Level 1: 47260
Support Level 2: 47040
Support Level 3: 46880
This communication is for informational purposes only and should not be viewed as any form of recommendation as to a particular course of action or as investment advice. It is not intended as an offer or solicitation for the purchase or sale of any financial instrument or as an official confirmation of any transaction. Opinions, estimates and assumptions expressed herein are made as of the date of this communication and are subject to change without notice. This communication has been prepared based upon information, including market prices, data and other information, believed to be reliable; however, Trade Nation does not warrant its completeness or accuracy. All market prices and market data contained in or attached to this communication are indicative and subject to change without notice.

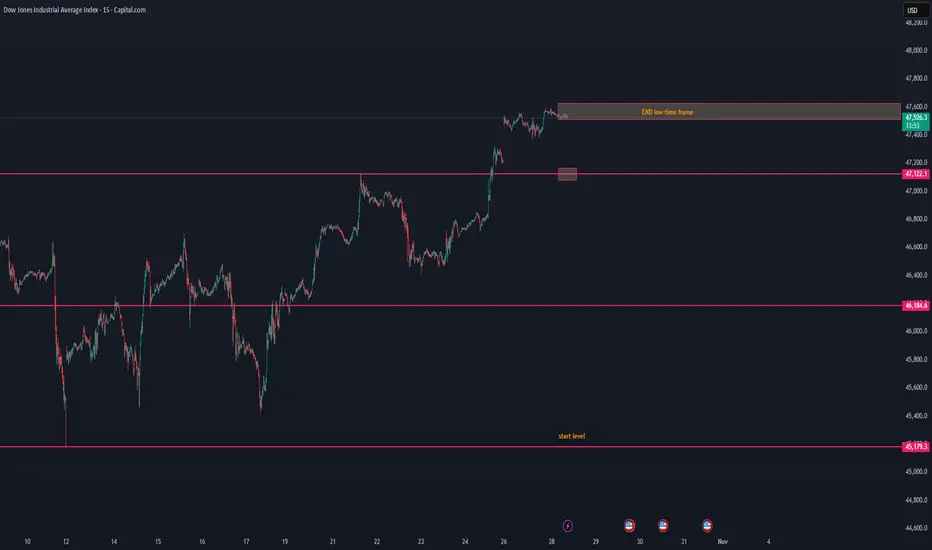
US30 lost its low time frame — possible breakdown aheadUS30 lost its low time frame — possible breakdown ahead ⚠️
US30 has lost its low time frame structure, showing early signs of weakness after the recent push to 47.5K.
The current price action suggests that momentum is fading, and sellers may start to take control.
📉 Short-term view:
Structure break below 47.5K zone confirms loss of bullish control.
The next visible support area sits around 47.1K, followed by 46.1K.
With time, price could continue to drift down toward the start level near 45.1K if buyers fail to defend.
📊 Observation:
Volume has started to cool off, and price is trading below the short-term EMA range — a typical setup before a gradual downward retrace.
💬 Summary:
US30 lost its low time frame momentum and looks to break down step by step toward the start level zone. We’ll monitor if buyers can react near 47.1K or if this becomes a broader correction phase.
DowJones at pivotal trading zoneKey Support and Resistance Levels
Resistance Level 1: 48085
Resistance Level 2: 48255
Resistance Level 3: 48500
Support Level 1: 47260
Support Level 2: 47040
Support Level 3: 46880
This communication is for informational purposes only and should not be viewed as any form of recommendation as to a particular course of action or as investment advice. It is not intended as an offer or solicitation for the purchase or sale of any financial instrument or as an official confirmation of any transaction. Opinions, estimates and assumptions expressed herein are made as of the date of this communication and are subject to change without notice. This communication has been prepared based upon information, including market prices, data and other information, believed to be reliable; however, Trade Nation does not warrant its completeness or accuracy. All market prices and market data contained in or attached to this communication are indicative and subject to change without notice.

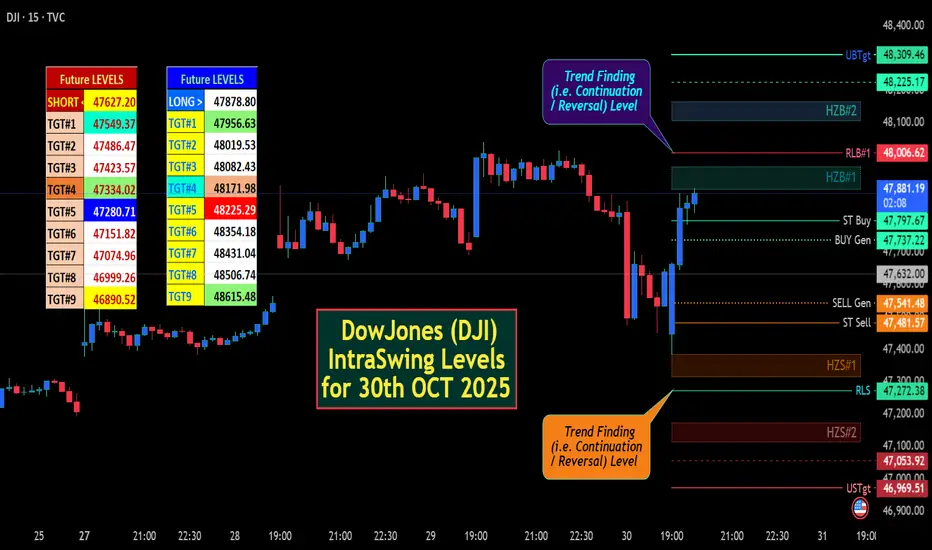
DowJones (DJI) IntraSwing Levels for 30th OCT 2025✍🏼️ "FUTUREY Levels" mentioned in BOX format.
🌡️Plot Levels Using 3 Min, 5 Min Time frame in your Chart for Better Analysis
L#1: If the candle crossed & stays above the “Buy Gen”, it is treated / considered as Bullish bias.
L#2: Possibility / Probability of REVERSAL near RLB#1 & UBTgt
L#3: If the candle stays above “Sell Gen” but below “Buy Gen”, it is treated / considered as Sidewise. Aggressive Traders can take Long position near “Sell Gen” either retesting or crossed from Below & vice-versa i.e. can take Short position near “Buy Gen” either retesting or crossed downward from Above.
L#4: If the candle crossed & stays below the “Sell Gen”, it is treated / considered a Bearish bias.
L#5: Possibility / Probability of REVERSAL near RLS#1 & USTgt
HZB (Buy side) & HZS (Sell side) => Hurdle Zone,
*** Specialty of “HZB#1, HZB#2 HZS#1 & HZS#2” is Sidewise (behaviour in Nature)
Rest Plotted and Mentioned on Chart
Color code Used:
Green =. Positive bias.
Red =. Negative bias.
RED in Between Green means Trend Finder / Momentum Change
/ CYCLE Change and Vice Versa.
Notice One thing: HOW LEVELS are Working.
Use any Momentum Indicator / Oscillator or as you "USED to" to Take entry.
⚠️ DISCLAIMER:
The information, views, and ideas shared here are purely for educational and informational purposes only. They are not intended as investment advice or a recommendation to buy, sell, or hold any financial instruments. I am not a SEBI-registered financial adviser.
Trading and investing in the stock market involves risk, and you should do your own research and analysis. You are solely responsible for any decisions made based on this research.
"As HARD EARNED MONEY IS YOUR's, So DECISION SHOULD HAVE TO BE YOUR's".
Do comment if Helpful .
In depth Analysis will be added later (If time Permits)
US30: Bulls Are Winning! Long!
My dear friends,
Today we will analyse US30 together☺️
The recent price action suggests a shift in mid-term momentum. A break above the current local range around 47,765.31 will confirm the new direction upwards with the target being the next key level of 47,916.63 and a reconvened placement of a stop-loss beyond the range.
❤️Sending you lots of Love and Hugs❤️

US30 Double topDouble top with multipal Divergence
Going for Short
Sell stop
47261.0
SL: 48101
TP: 46420
RRR 1:1

US30 Technical Breakdown – 10/30/2025
📍 US30 Technical Breakdown – 10/30/2025
US30 cooled off after a strong rally last week 🔥 Price printed a local high around 47,800, then started retracing as momentum slowed. The index is now testing the 47,500–47,400 support zone, sitting right around the EMAs — a crucial spot for bulls to defend 👀
📊 Market Behavior:
🔹 Higher highs and higher lows still intact (bullish structure)
🔹 EMAs starting to flatten → possible short-term pullback
🔹 Buyers defending 47.4K area so far
📌 Key Levels:
🔹 Resistance Zones:
47,790 → recent high / intraday resistance
48,000 → major breakout level
48,200 → continuation target
🔹 Support Zones:
47,400 → EMA & structure support
47,100 → previous breakout zone
46,520 → demand base
🧠 Bias:
Bullish overall ⚡
➡️ Above 47,800 → breakout continuation toward 48,200+
⬅️ Below 47,400 → short-term correction back toward 47,100

Possibility of uptrend It is expected that the upward trend will continue and the index will advance to the specified resistance levels. Otherwise, a correction to the support area will be possible, and then a change in the trend scenario will be likely.

possibility of uptrend It is expected that after some fluctuation, an upward trend will form and advance to the resistance range. As long as the price fluctuates above the support range, an upward trend is likely.

US30 Massive Short! SELL!
My dear friends,
Please, find my technical outlook for US30 below:
The instrument tests an important psychological level 47206
Bias - Bearish
Technical Indicators: Supper Trend gives a precise Bearish signal, while Pivot Point HL predicts price changes and potential reversals in the market.
Target - 46982
Recommended Stop Loss - 47329
About Used Indicators:
Super-trend indicator is more useful in trending markets where there are clear uptrends and downtrends in price.
Disclosure: I am part of Trade Nation's Influencer program and receive a monthly fee for using their TradingView charts in my analysis.
———————————
WISH YOU ALL LUCK

DowJones bullish reaction to US 3% Inflation dataKey Support and Resistance Levels
Resistance Level 1: 47156
Resistance Level 2: 47285
Resistance Level 3: 47413
Support Level 1: 46450
Support Level 2: 46270
Support Level 3: 46126
This communication is for informational purposes only and should not be viewed as any form of recommendation as to a particular course of action or as investment advice. It is not intended as an offer or solicitation for the purchase or sale of any financial instrument or as an official confirmation of any transaction. Opinions, estimates and assumptions expressed herein are made as of the date of this communication and are subject to change without notice. This communication has been prepared based upon information, including market prices, data and other information, believed to be reliable; however, Trade Nation does not warrant its completeness or accuracy. All market prices and market data contained in or attached to this communication are indicative and subject to change without notice.

US30 (Dow Jones) Technical Breakdown – 10/24/2025📍 US30 (Dow Jones) Technical Breakdown – 10/24/2025
US30 bouncing strong off the 46,500 demand zone and reclaiming EMAs 📈 Bulls showing strength again, but price now pressing into a major resistance area near 46,830–46,900, where it’s been rejected multiple times 🔥
📊 Market Behavior:
🔹 EMAs flipped bullish after a clean higher low
🔹 Price retesting key structure at 46.8K
🔹 Buyers defending the 46.5K region aggressively
📌 Key Levels:
🔹 Resistance Zones:
46,830 → current intraday cap
46,900 → breakout confirmation
47,100 → bullish continuation target
🔹 Support Zones:
46,520 → local demand
46,300 → EMA retest zone
45,550 → major higher-timeframe support
🧠 Bias:
Bullish ⚡
➡️ Above 46,900 → bullish breakout toward 47,100+
⬅️ Below 46,500 → possible correction back to 46,300

Dow Gains on Earnings Optimism and Shutdown Resolution Hopes.Fundamental approach:
- The Dow Jones index advanced this week, supported by strong corporate earnings optimism and hopes for a government shutdown resolution.
- Major earnings reports from technology companies may lead the gains, with IBM scheduled to report Q3 earnings on Wed, 22 Oct, with expectations for AI-driven growth. Additionally, 3M (MMM) is scheduled to report Q3 earnings on Tue, 21 Oct, before market open.
- Fed Governor Christopher Waller provided a dovish signal, noting inflation was "not a barrier to rate cuts."
- This sentiment pushed US Treasury yields lower, with the 10-year note falling below 4.00%, offering support to equities amid the data uncertainty.
- Investors also focused on the potential end to the federal government shutdown, which has created data blackouts for key economic releases, with National Economic Council Director Kevin Hassett indicating the shutdown could end this week.
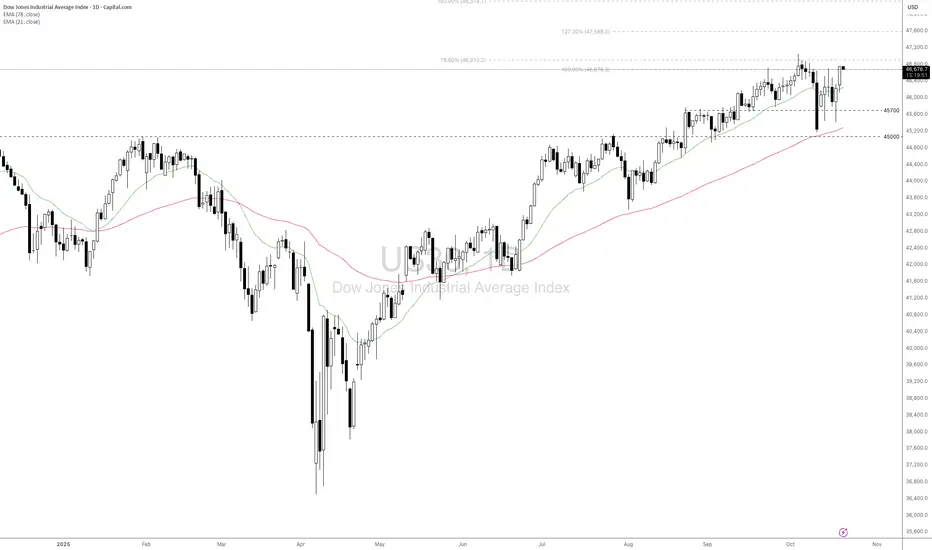
Technical approach:
- US30 is testing the previous all-time high at around 47000. The index is above both EMAs, indicating a strong bullish movement.
- If US30 breaches above 47000, the index may advance to test 127.20% Fibonacci Extension at 47590.
- On the contrary, staying below EMA21 may prompt US30 to retest the support at 45700.
Analysis by: Dat Tong, Senior Financial Markets Strategist at Exness
US30By the end of the week, a minor upward movement is expected in the index to form the second high node, after which, to complete the current upward cycle, the price will decline to levels around 45,600. This is a personal analysis, and naturally, the responsibility for any trading decisions rests solely with the individual.

Dow Jones Swing Trade Setup – Is 48,000 the Next Stop?📈 US30 "Dow Jones Industrial Average" CFD: Thief's Wealth Strategy Map (Swing/Day Trade) 🚨
🎯 Swing/Day Trade Setup: US30 (Dow Jones Industrial Average CFD)
Get ready to sneak into the market with the Thief Strategy — a cheeky, layered limit-order approach to steal profits from the Wall Street shadows! 😎 This bullish plan is designed for swing or day trading, with a professional yet playful vibe to maximize your market heist. Let’s break it down! 🕵️♂️
🧠 Trade Idea: Bullish Heist on US30 🚀
Asset: US30 (Dow Jones Industrial Average Index CFD)
Market: Wealth Strategy Map (Swing/Day Trade)
Outlook: Bullish 📈
Strategy: The Thief Strategy — using multiple buy limit orders in a layered entry style to catch the best price levels. Think of it as setting traps for profits! 🕸️
📝 The Thief’s Plan: Layered Entry & Key Levels
🔑 Entry Strategy:
Deploy multiple buy limit orders to layer your entries like a master thief:
🎯 46,500
🎯 46,600
🎯 46,700
🎯 46,800
Pro Tip: Feel free to add more layers based on your risk appetite or market conditions. The more traps, the merrier! 😜
Flexible Entry: You can enter at any price level within this range, but layering helps you average into the position like a sneaky pro.
🔐 Stop Loss (SL):
Set at 46,300 — the Thief’s escape hatch! 🚪
Note: Dear Ladies & Gentlemen (Thief OGs 🕶️), this SL is my suggestion, but it’s your heist! Adjust based on your risk tolerance and account size. Only risk what you can afford to lose!
🎯 Take Profit (TP):
Primary target: 47,600 — a juicy profit zone before the Police Barricade (resistance) at 48,000.
Why 47,600? This level avoids the overbought trap and potential reversal at 48,000, where strong resistance and market shenanigans may lurk. 🕵️♂️
Note: Thief OGs, this TP is my call, but you’re the boss! Take profits at your own discretion and secure the bag. 💰
🔍 Why This Setup? Key Analysis Points
Market Context: The US30 is showing bullish momentum, supported by recent economic data and market sentiment (check social posts and financial news for real-time vibes).
Technical View:
The layered entry approach leverages potential pullbacks within a bullish trend, maximizing your entry efficiency.
The 46,300 SL is placed below key support to protect against sudden reversals.
The 48,000 level acts as a major resistance (overbought zone + psychological barrier), making 47,600 a safer TP.
Risk Management: The Thief Strategy spreads risk across multiple entry points, reducing the impact of volatility spikes.
💹 Related Pairs to Watch (Correlated Assets in USD)
To boost your market awareness, keep an eye on these correlated assets:
SP:SPX (S&P 500 Index CFD): Moves closely with US30 due to shared exposure to U.S. large-cap stocks. A bullish US30 often aligns with SPX strength. 📈
PEPPERSTONE:NAS100 (Nasdaq 100 Index CFD): Tech-heavy index that can amplify or diverge from US30 moves. Watch for tech sector momentum. 💻
FX:USDJPY (Forex Pair): A stronger USD often supports bullish US equity indices like US30. Monitor for USD strength or Yen weakness. 💵
Key Correlation Insight: If SP:SPX and PEPPERSTONE:NAS100 show similar bullish patterns, it reinforces the US30 setup. Conversely, a sharp USDJPY drop could signal caution for US indices.
⚠️ Disclaimer
This Thief Style trading strategy is just for fun and educational purposes! 😜 Trading involves risks, and past performance doesn’t guarantee future results. Always conduct your own analysis, manage risk wisely, and only trade what you can afford to lose.
✨ If you find value in my analysis, a 👍 and 🚀 boost is much appreciated — it helps me share more setups with the community!
#US30 #DowJones #ThiefStrategy #SwingTrading #DayTrading #Bullish #TechnicalAnalysis #TradingView #WealthStrategy

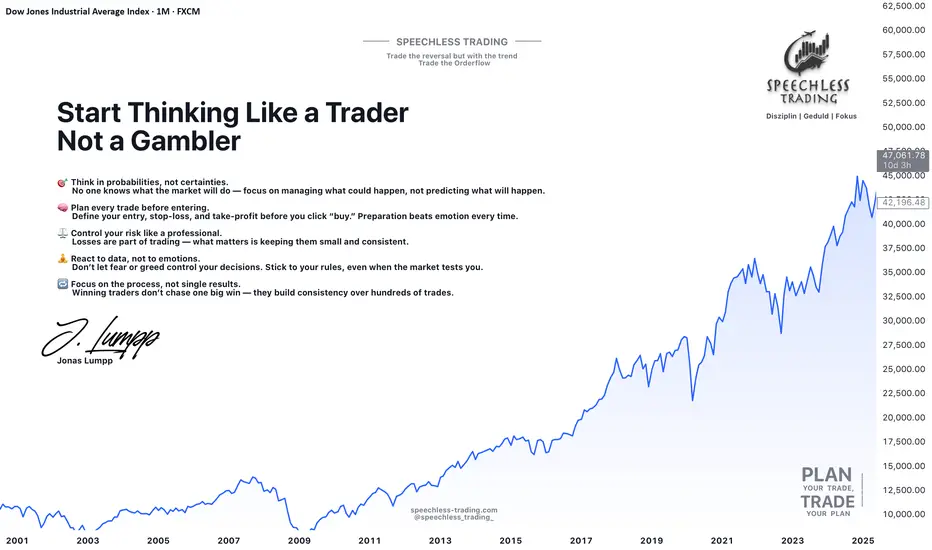
Start Thinking Like a Trader – Not a Gambler.Most people don’t lose in trading because they lack knowledge — they lose because they think the wrong way.
They chase signals, follow the noise, and react emotionally to every candle. They trade out of fear when the market drops, and out of greed when it rises. They believe the next trade will finally make everything right.
But real trading doesn’t work like that.
A real trader knows: the market owes you nothing. Every trade carries uncertainty. You can’t control outcomes — only your decisions.
That’s why traders think in probabilities, not certainties. They understand that a single trade means nothing, but consistent execution over time means everything.
Professional traders don’t rely on luck.
They plan every move before entering:
-> They define their entry and exit.
-> They set a stop-loss to protect their capital.
-> They accept that losses are part of the business, not a reflection of their skill.
Risk control is the foundation — without it, even the best strategy will fail.
Because the goal is not to win every trade. The goal is to stay in the game long enough for your edge to play out.
Think like a trader:
-> Focus on the process, not just the result.
-> React to what you see, not what you feel.
-> Stay calm, even when the market tests your patience.
-> Be consistent, even when emotions push you off balance.
-> Keep learning — the best traders are lifelong students of the market.
Trading isn’t gambling. It’s a business built on discipline, strategy, and mindset.
And once you truly start thinking like a trader, you’ll realize: you don’t need to predict the market — you just need to prepare for it.
Thanks for reading, and have a great start to your trading week!
Let us know in the comments if you found this post valuable - and we might create a full series on applied trading psychology.
Jonas Lumpp
Speechless Trading
Disclaimer: This tutorial is for educational purposes only and does not constitute financial advice. Its goal is to help traders develop a professional mindset, improve risk management, and make more structured trading decisions.
uptrend Given the failure of the resistance area, the consolidation above the resistance area is expected to continue the upward trend to the specified resistance levels.
