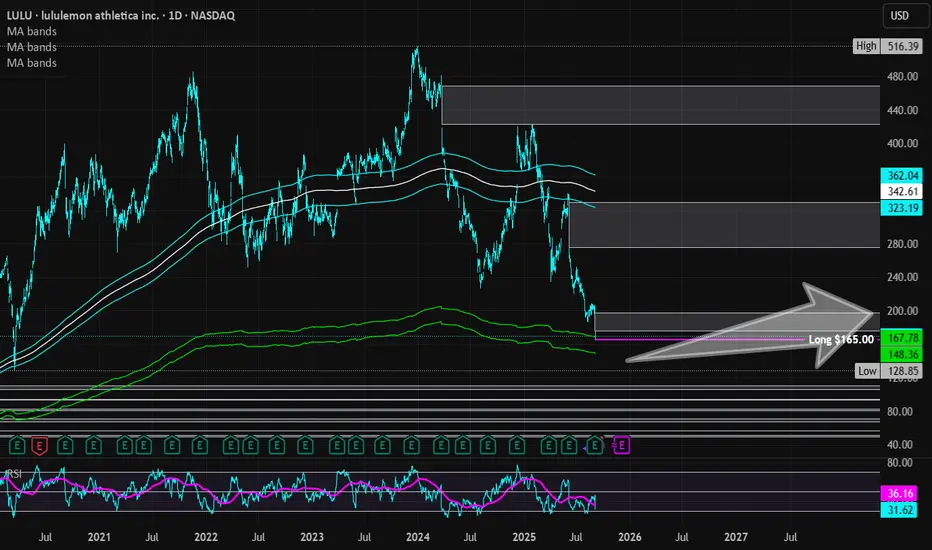
Lululemon Athletica | LULU | Long at $165.00Lululemon $NASDAQ:LULU. If you don't think the US is in a recession, examine most retail stocks right now. But this doesn't mean doom and gloom are here from a US government/news narrative - in fact, the complete opposite. AI and tech are solely propping up the US stock market ... but pay no attention to the issues behind the curtain! Once interest rates start dropping, trading and investing are going to get wild before the cracks open up.
Okay, off my soap box...
NASDAQ:LULU entered by "crash" simple moving average zone (green lines) today after earnings. Competition is finally catching up to the company, but expansion into China and other foreign areas *may* revive them in the next 1-2 years. While most analysts are relatively bullish, I'll stay centered. I wouldn't be surprised if the stock dips into the $140's and $150's in the near-term. Bigger news will have to come out for me to stay long-term, but I'm holding here or even lower. Additional entries will be made in the $140's-$150's to swap out the position I just made at $165.00 for the future.
Thus, at $165.00, NASDAQ:LULU is in a personal buy zone with the risk of a continued drop to the $140's and $150s. Christmas rally potential...
Targets into 2028:
$185.00 (+12.1%)
$197.00 (+19.4%)
33L trade ideas
LULU eyes on $166.34: Golden Genesis Fib may hold Earnings Dump LULU earnings report apparently was disappointing.
It dumped down to a Golden Geneiss fib at $166.34
Look for a hold/consolidation here then recovery.
.
See "Related Publications" for previous Plots at KEY levels.
==================================================
.

Head and Shoulders PatternLululemon’s chart looks extremely bearish. It’s make or break for this stock. A breakdown of its current support would confirm the break of the neckline in a Head and Shoulders pattern. The 1:1 extension of the move could send the stock price down another 50%, towards $130. Yikes!
The 5 Wave supercycle ended at the Head, around $520. The stock then crashed in an abc correction, rejected at the golden ratio at $420. We are now hanging onto support, $234 is the last hope before potential calamity.
That might seem dramatic but all it would take is for tariffs to eat into the profits and the company will be under significant margin pressure. The technicals and fundamentals don’t look great.
Be careful buying the dip on here. It looks like a falling knife. I’d rather be short, but currently have no position.
Not financial advice, do what’s best for you.

LULU Earnings Alert: Big Beat Potential! 208Call Plays
🚀 **LULU Earnings Trade Setup (2025-09-04)** 🚀
**Market Bias:** **Moderate Bullish** 📈
**Confidence:** 72% ✅
**Trade Idea:**
🎯 **Instrument:** LULU
🔀 **Direction:** LONG CALL
💵 **Strike:** \$208.00
📅 **Expiry:** 2025-09-05 (Weekly)
💰 **Entry Price:** \$12.10
📈 **Profit Target:** \$36.30 (200%+ return)
🛑 **Stop Loss:** \$6.05 (50% of premium)
📏 **Size:** 1 contract
⏰ **Entry Timing:** Pre-earnings close (AMC on 2025-09-04)
**Rationale:**
* Strong fundamental beat history: 100% last 8 quarters 💪
* Durable margins & high earnings quality 🏆
* Asymmetric upside if modest beat + guidance lift ⚡
* Risk: IV crush & binary guidance shock ⚠️
**Key Levels:**
* Support: \$185–\$190 🛡️
* Resistance: \$208–\$215 🔝
* Expected gap on beat: \~\$215–\$220
* Expected move (implied): \~9–11%
**Risk/Reward:**
* Max loss: \$1,210
* Reward potential: \$2,420 → **2:1+ asymmetric upside**
* Breakeven: \$217.10
**Execution Notes:**
* Use **limit orders or algo** to reduce slippage
* Exit **by market open post-earnings** or at profit/stop targets
* IV crush expected: 30–50% ⚡
**Options Liquidity:**
* 205 call OI: 1,205 ✔️
* Ask/Bid: 12.10 / 11.85
* Sufficient for single-leg trade
📊 **Trading JSON (for exact execution)**
```json
{
"instrument": "LULU",
"direction": "call",
"strike": 208.0,
"expiry": "2025-09-05",
"confidence": 72,
"profit_target": 36.30,
"stop_loss": 6.05,
"size": 1,
"entry_price": 12.10,
"entry_timing": "pre_earnings_close",
"earnings_date": "2025-09-04",
"earnings_time": "AMC",
"expected_move": 9.5,
"iv_rank": 0.75,
"signal_publish_time": "2025-09-04 14:33:52 UTC-04:00"
}
``

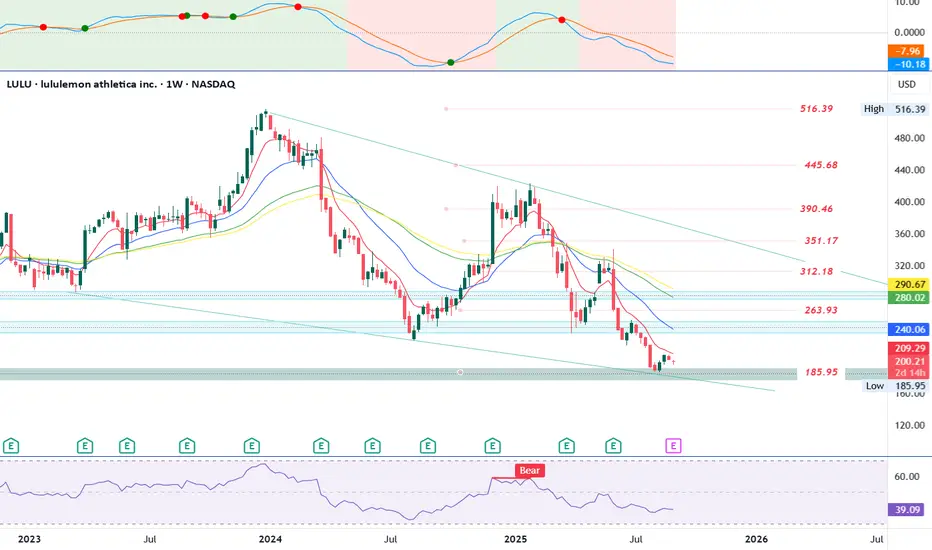
LULU at Critical Support – Bounce or Breakdown Post-Earnings?Trend Overview:
LULU has been in a clear downtrend since its peak near $516, forming consistent lower highs and lower lows.
Price is currently in the $200–$209 zone, sitting just above the long-term support area around $186.
Support & Resistance Levels:
Immediate Support: $200 → $186 (critical support).
Overhead Resistance: $240 (short-term), $263.9 (Fib zone), $290–312 (EMA cluster + horizontal supply).
Major Resistance: $351 → $390 → $445.
Indicators:
PMO (top grid): Still bearish, both lines sloping down, no crossover yet.
RSI (bottom grid): At 39, weak but not extremely oversold. Suggests pressure remains, though a short-term bounce is possible if support holds.
Bullish Case:
A rebound could come from the $200–$186 support zone, targeting $240–$264 initially.
For medium-term trend change, bulls need a decisive reclaim above $290–312.
Bearish Case:
A clean break below $186 would confirm another leg down, with risk toward the $150–160 zone.
Until price clears $264–$290, the broader trend remains bearish.
Earnings Catalyst:
Results are due on September 4th. Earnings could act as a volatility trigger. Staying cautious into results is important, as a surprise to the downside could break $186 support, while a strong beat could fuel a sharp bounce.
Risk/Reward Assessment (Long Side):
Entry Zone: $200–$186 support offers defined risk for a potential long.
Stop-Loss: Below $185.95 (structural invalidation).
Upside Targets: $240 (short-term), $263–$290 (swing).
Risk/Reward Ratio: Roughly 1:2 to 1:3 if entering near $190–200 with targets at $240–263.
Summary:
Trend remains bearish, but LULU is testing long-term support where risk/reward favors cautious long entries, provided stops are respected.
If $186 breaks, long setups are invalidated.
With earnings on Sep 4, traders should be careful as volatility may swing price sharply in either direction.
LULU ShortLULU remains in a downtrend overall, defined by a series of lower highs and lower lows since late July. The last Break of Structure (BOS) occurred near $186, where price broke beneath the prior low, confirming bearish continuation. A temporary Change of Character (CHoCH) appeared on the upside in mid-August when price rallied above a short-term high, but it failed to follow through, meaning sellers still control the broader structure.
Supply & Demand Zones
Above current price, the nearest supply zone lies around $202–$204, where price previously stalled and sellers quickly forced a rejection. This indicates strong overhead supply. Further up, the $212–$214 zone also remains heavy resistance, where price dropped sharply during the prior selloff. On the downside, demand around $194–$196 has provided temporary support, with buyers stepping in modestly, but the reaction was weak compared to earlier selling pressure. The deeper zone at $185–$188 is more important, as it’s where sellers last broke structure, and a retest there may lead to continuation lower.
Price Action in the Marked Region
Price is currently trading near $200, just below a fresh supply area. The candles show rejection wicks and fading momentum, suggesting that sellers are defending this level. If this rejection holds, a move back into the $194–$196 demand is likely, with a strong chance of continuation toward $185 and potentially into the $178 target zone marked on the chart. If instead price breaks and holds above $204, this bearish outlook weakens significantly.
Trade Bias & Outlook
The current bias is bearish. The expected direction is lower, with the key downside target near $178.
Invalidation level: A decisive close above $204 would flip the outlook bullish, as it would show buyers absorbing overhead supply.
Momentum & Candle Behavior
Momentum favors sellers, as recent rallies have been corrective and weaker compared to impulsive selloffs. Current price action shows rejection at supply with smaller-bodied candles, a bearish signal. Unless buyers show strong follow-through above $202–$204, momentum continues to favor sellers.

$LULU ER PLAN Current Price: $202.20 (as of August 29, 2025)
Trading Idea: Bearish Put
Rationale: LULU’s 51.1% YTD decline and bearish analyst revisions (19 downward) suggest challenges in consumer spending, with an 8.6% expected move ($17.39).
Strategy: Buy an ATM put at the $202.50 strike, expiring mid-September. Target $190-$195 if guidance disappoints.
Risk: Strong international growth could spark a rebound. Limit losses to 50% of premium.
Recheck: The price fell 1.4% from $205.08, reinforcing the bearish bias. The put strategy aligns with the downtrend.

Lulu multiple bullish signals Check the chart im not in the mode to explane the detail , check multiple details in the chart 📈

Bearish on LULULULU seems to giving a bearish correction and is in its C wave down. It's giving a small flag right now which upon break should continue the down move.

Getting ready for the run!- NASDAQ:LULU is getting ready for the reversal run!
- beaten down name YTD, cheapest valuation in a decade.
- international expansion will work out in the long run despite creating capex headwins in the shorter timeframe
Lulu $260 first targetBought the Oct 17 260C little close dated but 1.3B in cash good margins looking pretty oversold here the turn around could be violent. I'm assuming there will be some good news on the upcoming earnings sept 4. getting wallstreets attention lately lets see if they can get a good squeeze, has to stay above 200.

LULU Downtrend Intact — $260 is the Reversal KeyLULU is currently testing the $198 level, which aligns with the 0.618 Fibonacci retracement — a historically strong support zone. If the stock manages to build a solid base here, it could pave the way for an upward move. In the near term, price action may hover between $186 and $210, as buyers and sellers battle for control.
From an accumulation standpoint, $198 is an attractive entry for gradual buying, but I’d prefer to see clear evidence of base-building to confirm that buyers are stepping in. The real confirmation of strength comes if LULU breaks above $260, as that would mark the first Higher High (HH) and signal a true reversal from the ongoing downtrend.
Right now, the chart still shows a series of Lower Lows (LL), which keeps it in a bearish structure. For a genuine trend reversal, LULU needs to first form a Higher Low (HL) and then push into a Higher High (HH) — with $260+ being the key trigger. Until then, it’s more of a wait-and-watch zone.

LULU to $337I'm personally not a buyer of LULU, but if anyone else is interested, this is exactly the area to buy. It's also a good trade for a relatively quick move back over $200.
Should move pretty easily back up to $337 resistance.
Good luck!

LULU - Updated analysis and what to look out forWe have a pretty clear HTF zone to look out for below - $130-$160 - in which we will need to see how price holds up. I cannot imagine a drop below there - that would make this completely undervalued - and I will be looking for long trades when we arrive there and see the LTF algorithms playing out.
Until then,
Happy Trading :)

Yoga Pants, Tariffs, and Upside: The $LULU BetLululemon NASDAQ:LULU - My Investment Thesis 👖
Hey team,
I've been keeping an eye on NASDAQ:LULU for a while, and I'm finally going to pull the trigger.
In this market of overhyped MAG 7 stocks, Lululemon dropped 62% since its high in Dec. 2023 until now.
Here's why I'm into LULU:
Revenue has been growing every year for 5 years. Still, the stock is at its lowest in 5 years.
Growth has been slower in the US but good in Asia.
Net income has also been growing over the last 3 years.
P/E ratio is at 13, the lowest in many years.
Stock is also beat up because of the tariffs.
Analysts at Morningstar put its fair value at $305 (now $193, giving it an upside of 58%).
Product Innovation: New franchises like Daydrift, Shake It Out, and Align No Line have been well-received and will continue to drive sales.
Lululemon recently announced an expansion into India for 2026, with plans to open a physical store and a partnership with Tata CLiQ, the e-commerce arm of India’s largest business conglomerate, Tata Group. India can be a huge market for Lulu.
There's also intense competition and margin erosion.
Saying this, I kinda see people around me less excited about Lululemon products.
Technical Analysis:
My EVaR - Entropic Value at Risk - is in a low risk area.
RSI is oversold.
Price has been under the 200 MA for too long.
I'm going to proceed with caution on this one, and allocate approximately. 0.5% of my portfolio into it.
Quick note: I'm just sharing my journey - not financial advice! 😊

LULU into supportLulu is on sale as its just come into an area it has only sold at, 3 other times out of the past 5 years. As you can see by the Orange line, LULU has been holding this area of support for the past 5 years. This is a great buying opportunity. A close below the line on a weekly basis would stop out of the trade

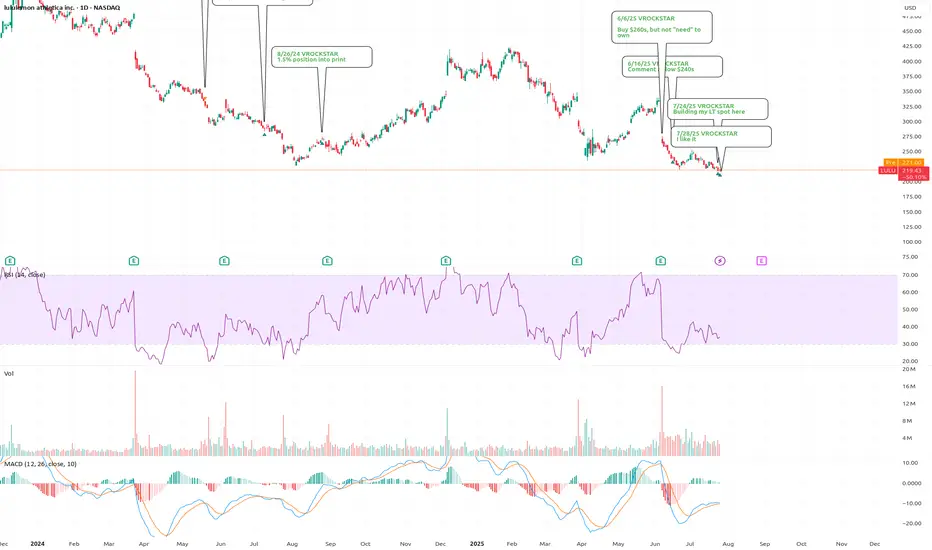
7/28/25 - $lulu - and goodbye7/28/25 :: VROCKSTAR :: NASDAQ:LULU
I like it
Apparently i can't post my thoughts anymore w/o it being flagged. so what's the point?
And i don't play stupid games and win stupid prizes... so goodbye public notes. ez decision.
Also... purely technical analysis will go the way of AI. So beware. Learn to think independently without just drawing lines on charts like 99.999% of content here. there r other places where people post more thoughtful fundamental analysis.
in the meanwhile this is the chart i thought might be helpful for anyone looking at $lulu. i literally post this for the last time... because, well, i think it's a helpful data pt.
the chart i'm trying to post now the 3rd time...
V
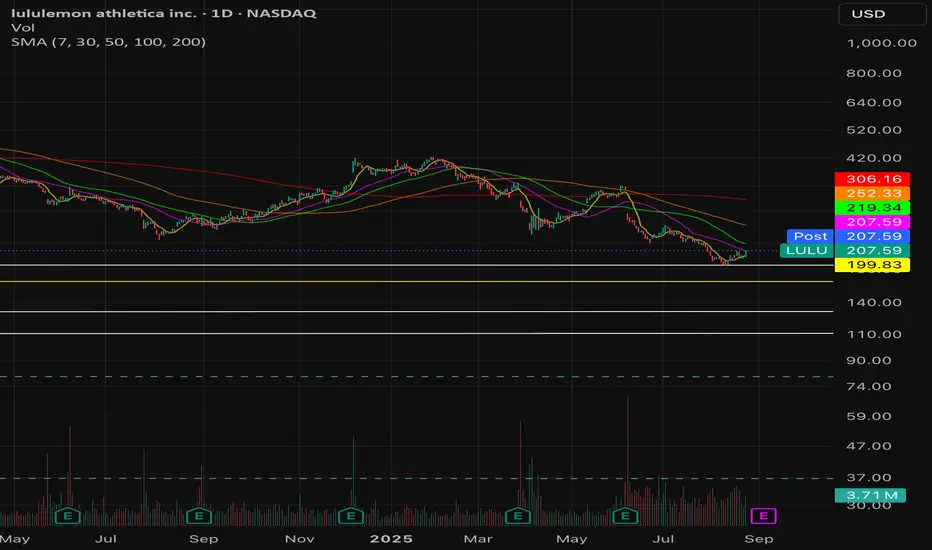
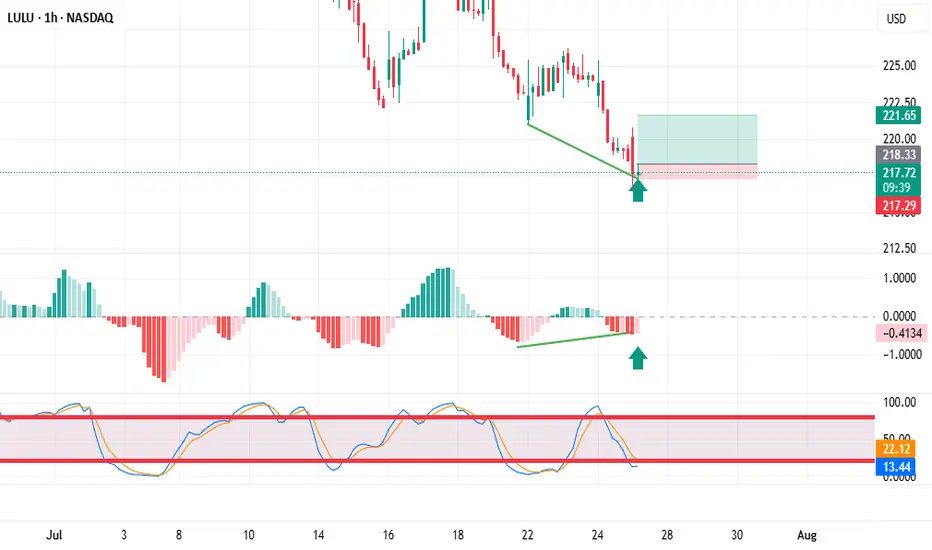
Trading stocks using Dr. Elder's "Three Screen Method"The first thing I do is check the weekly chart. Here I see excellent price divergence relative to the MACD indicator
Then I switched to the daily chart and saw the same excellent divergence as on the weekly chart.
The hourly chart also showed excellent divergence. placed a pending buy order above the candle marked with an arrow.
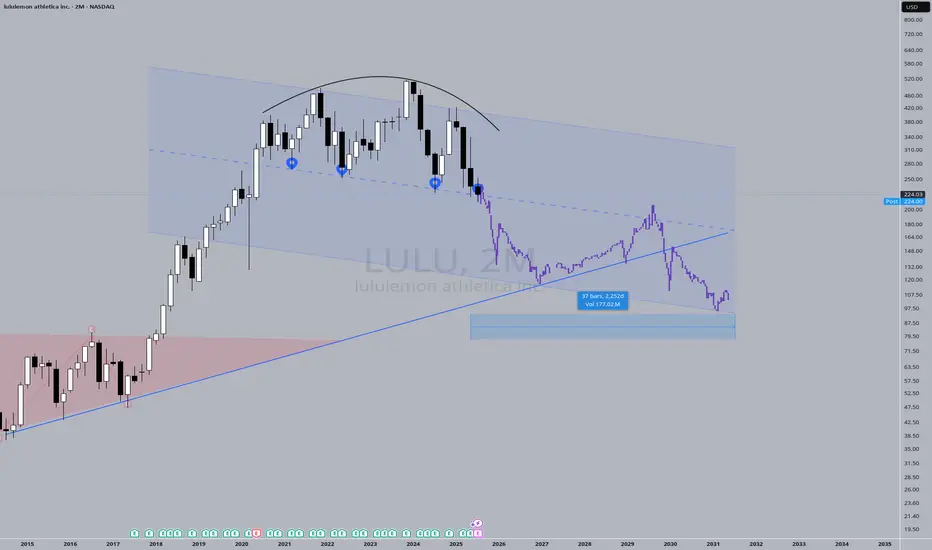
Mega-ultra macro LULU takePrice action has "knocked" on the support door FOUR times. It's got to give sometime soon. Fashion brands come and go, I think LULU has had it's time to shine, now it's time for another brand to emerge and take its place.
I say "Mega-ultra macro" to recognize the absurdity of a 6-year guess. The probability of accurately predicting price action for a 6-year window is low. But here's a prediction anyway.
Going to HonoLULULululemon shares fell almost 20% after the company warned tariffs and consumer caution would hurt profits.
Here are some of my bold statements about this:
Tariffs are sector-wide, not Lululemon-specific
Nearly all premium athletic and apparel brands—Nike, Adidas, Under Armour, VF Corp (The North Face), Alo Yoga, Vuori—rely on Asia-based manufacturing, especially China and Vietnam.
This means everyone faces the same cost inflation, and no brand gains a unique cost advantage from the tariff hit.
Lululemon has superior margin cushion
LULU has ~58–59% gross margins, which is well above peers like Nike (~44%) or Under Armour (~46%).
This gives Lululemon more flexibility to absorb or pass on costs than competitors.
Loyal customer base allows for price elasticity
Lululemon’s brand power, community focus, and premium positioning give it pricing power. Consumers are often less price-sensitive.
Modest price increases (e.g. $5–10 on leggings) may not meaningfully affect demand—especially compared to fast fashion retailers.
And some points about performance of the business:
Forward P/E now ~18×, down from its historical 30–35× range—this marks a meaningful valuation discount relative to its growth profile
International comparable sales surged: +39% in China, +25–36% in rest-of-world markets recently
Executed ~$1 billion in stock repurchases recently, with ample remaining capacity—supports EPS and investor confidence
Multiple firms (Bernstein, Raymond James, TD Cowen, Needham, Baird) maintain Buy/Outperform ratings with targets in the $420–475 range
For LULU´s 1Q official report visit: corporate.lululemon.com

LULU Weekly Bearish Setup – 7/21/2025
📉 LULU Weekly Bearish Setup – 7/21/2025
💥 RSI Breakdown | 📉 Institutional Bearish Flow | 💰 Premium Risk-Reward
⸻
🧠 Multi-Model Consensus Summary
🟥 RSI: Daily 36.1 / Weekly 29.9 – Bearish Momentum Confirmed
📉 Volume: Consistent sell pressure across models
📊 Options Flow: Mixed signals, but bearish price action dominates
⚠️ Conflicting flow ≠ bullish reversal… yet.
⸻
🎯 TRADE IDEA – LULU $220 PUT
💥 Direction: Bearish
🧾 Strike: $220 Put
📆 Expiry: July 25, 2025
💵 Entry: $1.33
🛑 Stop: $0.80 (≈40% loss cap)
🎯 Target: $1.95 (≈50% gain)
📈 Confidence: 65%
⏰ Entry Time: Market Open (Monday)
⸻
📎 Why it Works:
✅ RSI Collapse across timeframes
✅ Bearish price action confirmed by volume
✅ Favorable IV and gamma setup
🚫 No trade suggested by some models = opportunity in the noise
⸻
📊 TRADE_DETAILS
{
"instrument": "LULU",
"direction": "put",
"strike": 220.00,
"expiry": "2025-07-25",
"confidence": 0.65,
"profit_target": 1.95,
"stop_loss": 0.80,
"size": 1,
"entry_price": 1.33,
"entry_timing": "open",
"signal_publish_time": "2025-07-21 12:45:12 EDT"
}
⸻
🔥 #OptionsTrading #LULU #BearishSetup #WeeklyTrade #PutOptions #TradingStrategy #MarketMomentum #RSI
📍 Save this setup, share with your trading group, and set alerts!

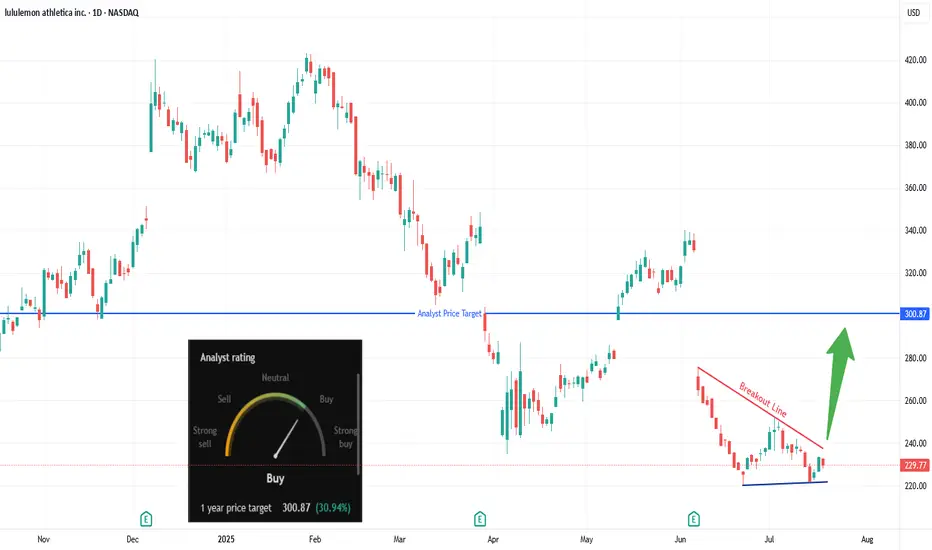
Are Bulls Quietly Loading Up on LULU?Trade Summary 📝
Setup: Descending wedge forming after sharp drop; price testing breakout line.
Entry: Above $240.
Stop‑loss: Below $220 swing low/support.
Targets: $260 , $293–$301 (analyst target).
Risk/Reward: ~3:1 (tight stop, multi-level upside).
Technical Rationale 🔍
Key Signal #1: Descending wedge/bullish reversal pattern; oversold bounce.
Key Signal #2: Bullish divergence forming on recent lows; higher low established.
Context: Daily chart; aggressive sellers losing momentum as wedge tightens.
Catalysts & Context 🚦
Recent gap down created potential “magnet” for gap fill upside.
Surge in unusual OTM call buying last week hints at speculative bullish positioning.
Analyst 1-year target: $300.87 (+30% upside); rating upgraded to Buy.
Watching for sector rotation into consumer discretionary/retail names.
Trade Management Plan 📈
Entry: Only on daily close above $240 breakout line.
Stop‑loss: Initial below $220; trail to breakeven if $260 target hits.
Scaling: Trim at $260, hold partial for $293–$301 extension.
What’s your view? Are you watching LULU? Comment below or vote:
🔼 Bullish
🔽 Bearish
🔄 Waiting for confirmation
*** Follow us now to ensure you don't miss the next big setup ***
Disclaimer ⚠️: Not financial advice. Trade at your own risk.
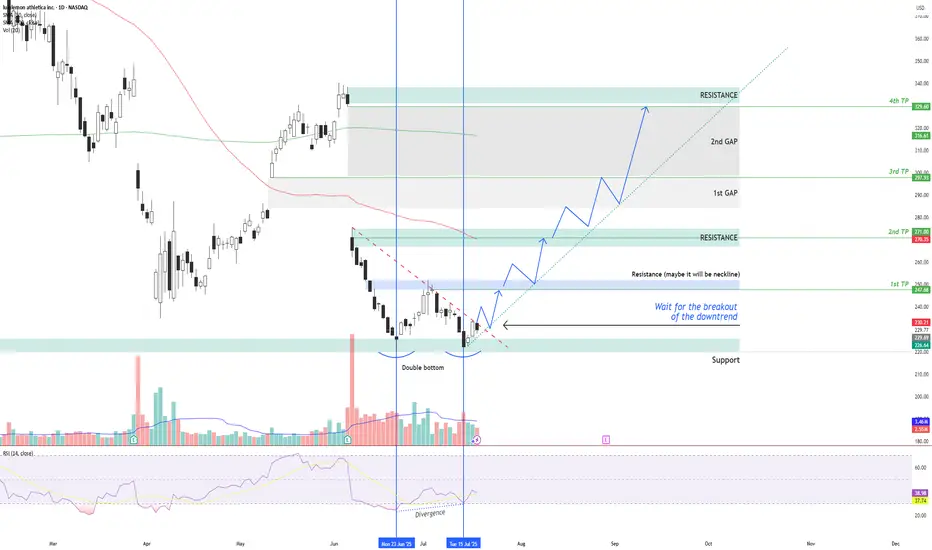
LULU – Double Bottom + RSI Divergence: Multi-Target Setup After LULU NASDAQ:LULU is showing signs of a potential bullish reversal after forming a double bottom structure around the $220 support zone , along with a bullish divergence on the RSI indicator.
Two vertical lines highlight the divergence: while price made a lower low, RSI formed a higher low – indicating a possible momentum shift in favor of buyers.
Currently, price is moving just below a descending trendline, which has been acting as dynamic resistance. The first condition for a long setup is a confirmed breakout above this trendline followed by a successful retest. If that happens, an entry can be considered .
📌 Entry Plan:
Entry: After a breakout and retest of the descending trendline.
1st TP: ~$247 — This level coincides with a local resistance zone, which may act as a neckline of the double bottom.
If price breaks above $247 and retests, it confirms bullish continuation.
📈 Target Structure:
2nd TP: ~$271 — next major resistance zone.
3rd TP: ~$297 — aligns with the first major gap zone.
4th TP: ~$329 — final gap resistance from previous sell-off levels.
This structure allows for scaling into the trade in stages — each breakout and retest offers a new confirmation and extension to the next target zone.
Volume analysis, price action, and RSI momentum all support the probability of a trend reversal — but confirmation is key.
Not financial advice. Always conduct your own research and risk management.