AMD (2025+) Catalysts & Risks: 300 USD PT Bulls🟥 AMD (2025+) Catalysts & Risks: Analyst Views
________________________________________
🔑 Key Catalysts Driving AMD’s Stock Growth (2025+)
🌌 Quantum-Centric Supercomputing with IBM
AMD’s collaboration with IBM to merge CPUs/GPUs with quantum computing promises a whole new class of hybrid architectures. If successful, this could unlock brand-new compute markets in research, defense, and enterprise.
Impact Score: 9.5/10
🏗️ Hyperscaler Traction & Data-Center GPU Gains
AMD’s MI355 and upcoming MI400 accelerators are gaining traction with big cloud players. Even a modest 10% market share in AI GPUs would be transformative for AMD’s revenue mix.
Impact Score: 9/10
📈 Analyst Upgrades & Bullish Price Targets
Wall Street has turned bullish—multiple PT hikes point to 20–40% upside. Analyst enthusiasm often accelerates institutional inflows, reinforcing AMD’s momentum.
Impact Score: 7.5/10
🌍 Global AI Accelerator Growth & Middle East Expansion
AMD is securing multi-billion sovereign AI infrastructure deals in the Gulf (Saudi, UAE). These large-scale contracts validate AMD’s credibility as a true Nvidia alternative.
Impact Score: 8.5/10
💰 Strong Financial Performance & Executive Optimism
Q1 results crushed expectations with revenue and profit growth across data center and AI. Sustained beats strengthen AMD’s credibility and support multiple expansion.
Impact Score: 8/10
🔗 Broad Ecosystem & Strategic Acquisitions
Acquisitions like Xilinx and Silo AI give AMD a richer portfolio spanning FPGAs, AI software, and custom servers (Helios). This positions AMD as more than just a chipmaker—an AI infrastructure player.
Impact Score: 7/10
________________________________________
⚠️ Key Negative Drivers & Risks
🇨🇳 China Export Restrictions
AMD is losing access to a massive end market due to US export rules. This already shaved off ~$1B in projected sales and could worsen with future policy shifts.
Risk Severity: 9/10
📉 Under-whelming AI GPU Sell-In
Past misses on data-center GPU sales remind investors that adoption is not guaranteed. If hyperscalers hesitate, AMD’s AI growth story could stall.
Risk Severity: 7.5/10
💸 Valuation & Excess Rally Risks
Shares are up massively YTD—if results don’t keep pace, profit-taking could spark sharp pullbacks.
Risk Severity: 7/10
⚡ Short-Term Volatility & Earnings Reaction
Even with growth, near-term misses or cautious guidance could swing the stock hard.
Risk Severity: 6.5/10
🥊 Competitive Pressure
Nvidia’s CUDA ecosystem remains deeply entrenched, while custom silicon from hyperscalers (Google TPUs, AWS Trainium) eats into the TAM. AMD is fighting uphill.
Risk Severity: 8/10
________________________________________
📝 Summary Outlook (Sept 2025)
AMD is no longer the underdog—it’s becoming a legitimate AI infrastructure contender. The IBM quantum partnership and hyperscaler adoption of MI400 GPUs could be game-changers. Sovereign AI deals in the Middle East and ecosystem-expanding acquisitions amplify the story.
But execution risk is high—China export bans, entrenched Nvidia dominance, and valuation stretch leave little room for error. Success hinges on AMD proving it can scale its AI GPUs and secure recurring demand.
Rank Catalyst 🚀 Score (0–10)
1⃣ 🌌 Quantum-Centric Supercomputing with IBM 9.5
2⃣ 🏗️ Hyperscaler GPU Adoption (MI355/MI400) 9
3⃣ 🌍 Middle East AI Mega Deals 8.5
4⃣ 💰 Strong Financial Growth 8
5⃣ 📈 Analyst Upgrades & PT Revisions 7.5
6⃣ 🔗 Ecosystem & Acquisitions (Xilinx, Silo AI, Helios) 7
Advanced Micro Devices, Inc. Shs -CAD hedged- Canadian Depositary Receipt Repr Shs Reg S
No trades
AMD0 trade ideas

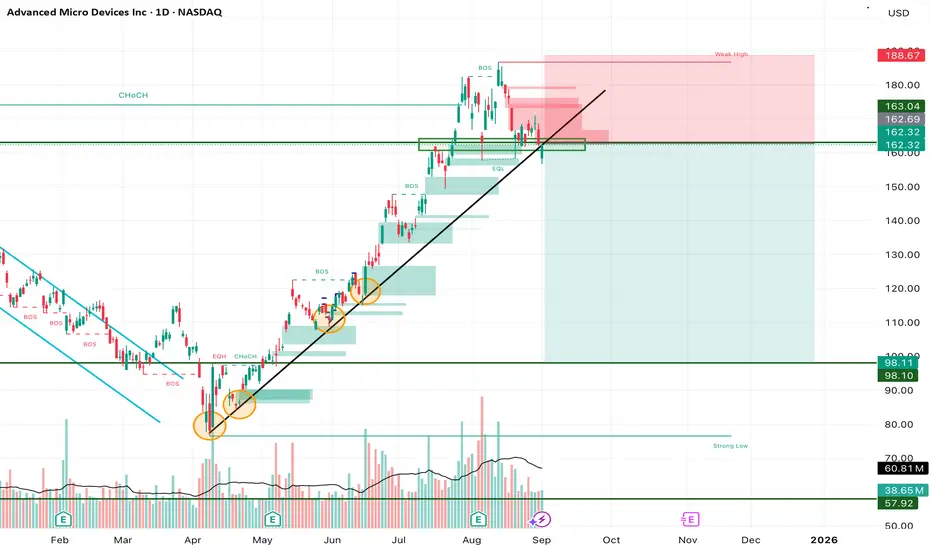
AMD Trendline Break – Short-Term Weakness, Long-Term AI Power PlAMD has broken below its long-standing ascending trendline, which has been respected multiple times since April. This is the first real sign of weakness after months of steady upside. The $162–165 zone, once strong support, is now acting as resistance. Unless bulls can reclaim this area quickly, AMD risks sliding lower toward $150 or even deeper levels.
Technical View:
• Trendline: Broken on daily chart → bearish short-term shift.
• Resistance: $162–165 (former support), $186–187 (weak high).
• Support Levels: $150 psychological, then $135–140 range.
• Indicators: RSI softening, MACD negative, short-term MAs leaning bearish.
Fundamental Backdrop:
Despite this technical weakness, AMD’s long-term story remains strong. HSBC recently upgraded AMD with a $200 price target, citing its MI350 AI chips that rival Nvidia’s Blackwell GPUs. The MI400, due in 2026, could expand GPU sales to $20B by 2028. Melius Research also raised its target to $175, highlighting AMD’s AI trajectory. Fundamentally, AMD is building momentum as a serious competitor in the AI chip race.
Trade Setup (Swing Idea):
• Entry Zone: $162–165 rejection area.
• Stop Loss: Above $188 (weak high).
• Take Profit 1: $150 (psychological level).
• Take Profit 2: $135–140 demand zone.
• Long-Term Accumulation: Any dip below $150 could be a strategic buy for investors with a $175–200 upside target in the AI cycle.
My View:
Short-term, the break of trendline favors bears — I’m watching for a retest of $162–165 to confirm resistance. Medium-term, I see pullback opportunities. Long-term, AMD’s AI roadmap gives conviction that dips should be accumulated rather than feared.
(Not Financial Advice) NASDAQ:AMD
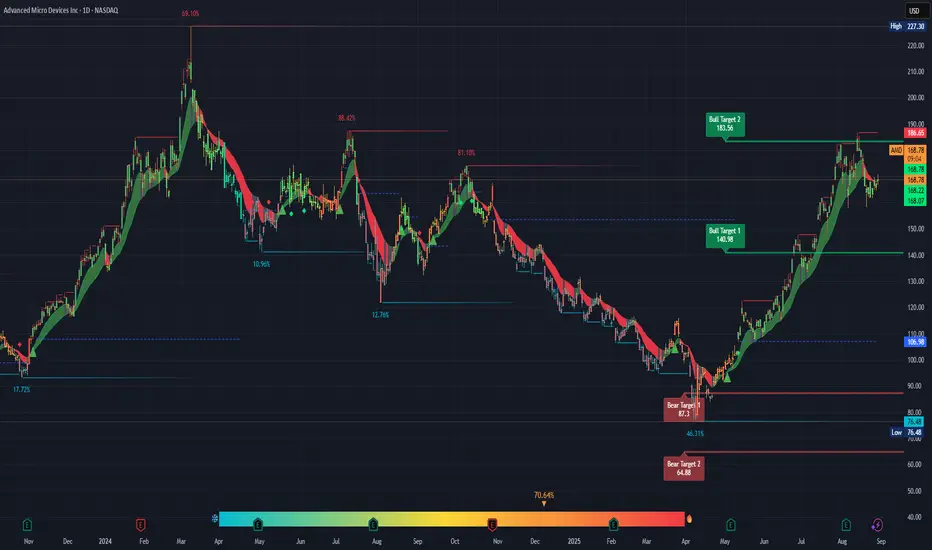
AMD...What's next?The Good (Bullish Side)
Uptrend Recovery: After bottoming near $76 in April 2025, AMD has made a strong rebound, more than doubling into the $180s. That’s a powerful recovery with momentum behind it.
Support Levels: $140.98 (Bull Target 1, now support) held beautifully during the climb. As long as price stays above that zone, bulls remain in control.
EMA Structure: The green ribbon is showing bullish alignment, with short-term EMAs stacked above longer-term ones. Trend is intact despite the pullback.
Targets: Bull target 2 is $183.56. If AMD breaks above $186.65 (recent resistance), it has room to run higher.
The Bad (Bearish Side)
Resistance at $186.65: Price already got rejected at that level. Until AMD closes convincingly above it, this ceiling is heavy.
Lower High Risk: If AMD fails to reclaim $186 and rolls over, it risks forming a lower high — which could signal a deeper retrace.
Macro Weakness: Semi stocks (including AMD) are cyclical. If broader tech/economy cools, AMD can easily retrace to the $140–150 zone.
“Too Good to Be True” Filter
The recent rally from ~$76 to ~$186 is a 142% move in ~4 months. Moves that vertical rarely sustain without corrections. Expect at least some chop or a larger retracement before continuation.
Cost vs. Benefit Analysis
Chasing now (~$168–170): High risk since you’re buying under resistance. Best case you capture a breakout, worst case you eat a $20–30 pullback.
Waiting for confirmation ($186+ breakout): Lower risk entry, but you’ll miss the first 10% of the move.
Buying a retrace to $150–155: Better reward/risk, but you risk missing the run if it never pulls back that far.
✅ Bottom Line: Looking good overall, but this is not a safe buy point. AMD is stuck between resistance and support. Smart money waits for either a breakout above $186 with volume or a dip closer to $150 for better risk/reward.
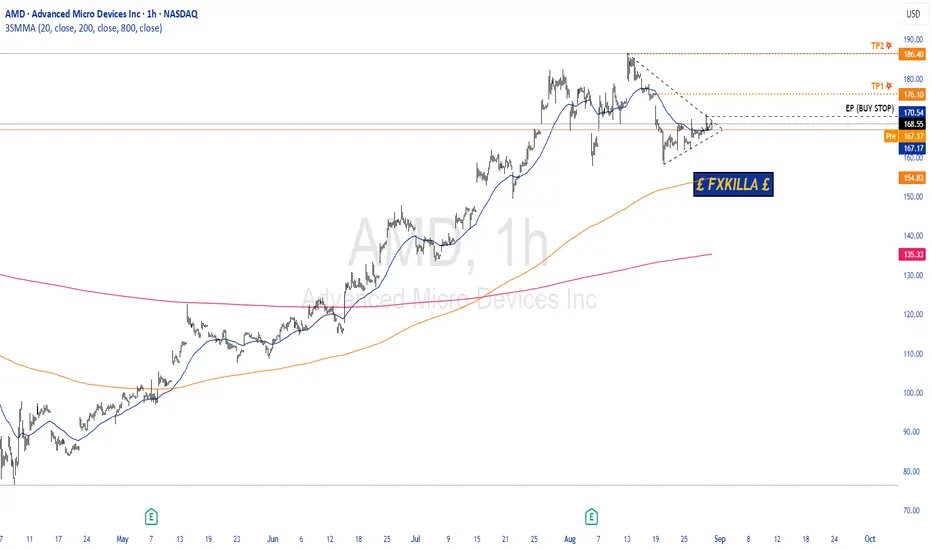
AMD HIGH PROBABILITY SETUP SOON!!🚨 AMD HIGH PROBABILITY BUY SETUP 🚨
* Here we Can See Clearly The Next Potential Move For AMD Coming Hours.
* Keep Your Eyes Close On Your Trading Positions.
* Happy PIP Hunting Traders.
£ FXKILLA £
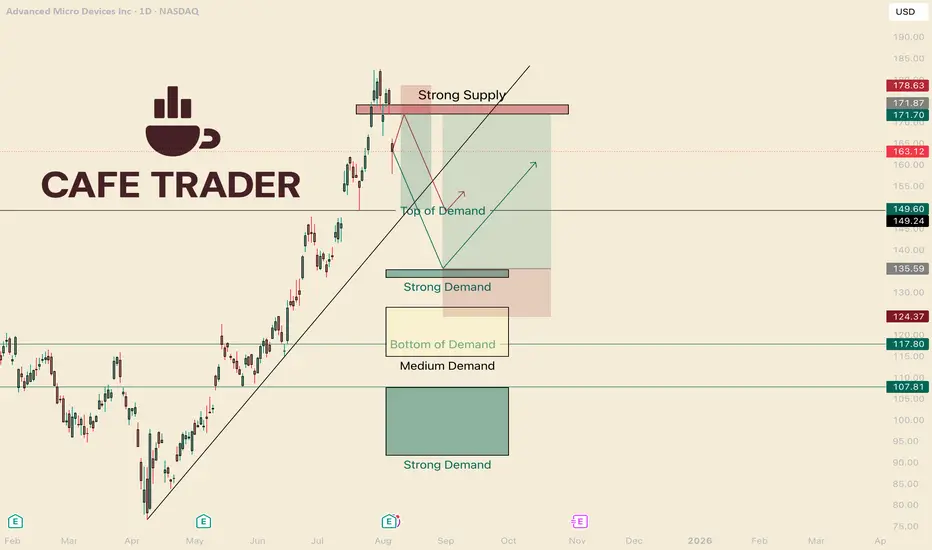
Buy AMD with Confidence. Hello I am the Cafe Trader.
My goal is to help you find great pricing for your long term, and help you finesse your position the markets.
Today we are going to take a closer look at AMD.
As of right now AMD has just peeled off it's highs, gapping down. Is this where buyers are stepping in? Should you buy now? What are some short term plays that can maximize your profits?
CONTEXT
On the Chart I have labeled different levels of Demand. Knowing where the players are (buyers and sellers) can help us be surgical in price and timing.
In my opinion it is best to trade in terms of scenarios. How players react is just as important as Where they react.
For example: Say you are waiting in a long line for coffee. After some time, the line moves very slowly. We can start to ask questions, like "Why is this taking so long? How long will this take?"
"How" is an important question because we would have to examine how fast, or slow, the line is moving. We are in the dark with how big the current players are in the market.
Knowing "How" will help us position ourselves well with the other players. This lines us up for the best pricing, and helps us be able to get out of a position quick if we are wrong.
SHORT TERM
AMD had mixed earnings. This puts pressure on the buyers but they are still in control.
With a new seller inbound It's probable to hit the "Top of Demand" before breaking new highs.
Short Scenario (Red Line)
I think this will touch quick, reject, and then a few days of sideways before the real move down. You can take a Short right in this zone at 172, but if you buy puts, look to get good pricing. If we move up 4% the contracts might be too expensive to swing 3-5 days. I think after the touch, wait two days or so, and then look to get into some options.
Short (shares)
Entry 172
Stop 178.75
TP 150
Short (options)
Entry is after a test of the strong supply, wait a couple days.
Strike price: 160 Strike (or higher)
Premium: 4 to 1 R
$1.50 4-5 days TP $600
$2.50 6-10 days TP $1000
Long Scenario.
If we do not touch the strong supply before going down, This could drop aggressively. Unlike the previous scenario, I am expecting a hot reaction off the strong Demand area.
Long (shares)
Entry 135.50
Stop 124
TP 172
Long (options)
As soon as it touches, same day and next days contracts, 1 - 2 standard deviations outside the money. I think It can get to 140 minimum the same day.
Strike 136-137
Premium: 2.50-3.50 (if you get it cheaper, great!) Really this will depend on if it touches on a Monday, or a Friday lol.
TP 150% - 400%
LONG TERM
These prices should align with your own sentiment and Due Diligence of AMD.
Fair: $149.50 (Top of Demand)
Deal: $133.50 - 135.50 (Strong Demand)
Steal: anything under 108
(2nd Strong Demand)
Don't forget to Boost and follow!
More insight to come, and make sure you check out all my channels.
Much Love and Happy Trading!
@thecafetrader
Must go down to go upI think AMD needs to cool off before it continues further, possibly tapping $160 first before a serious correction. Targets are listed at the strong support ending at $120. RSI printing bearish divergence on multiple time frames
Look at the red line, look at the direction of price. It's still a downtrend.
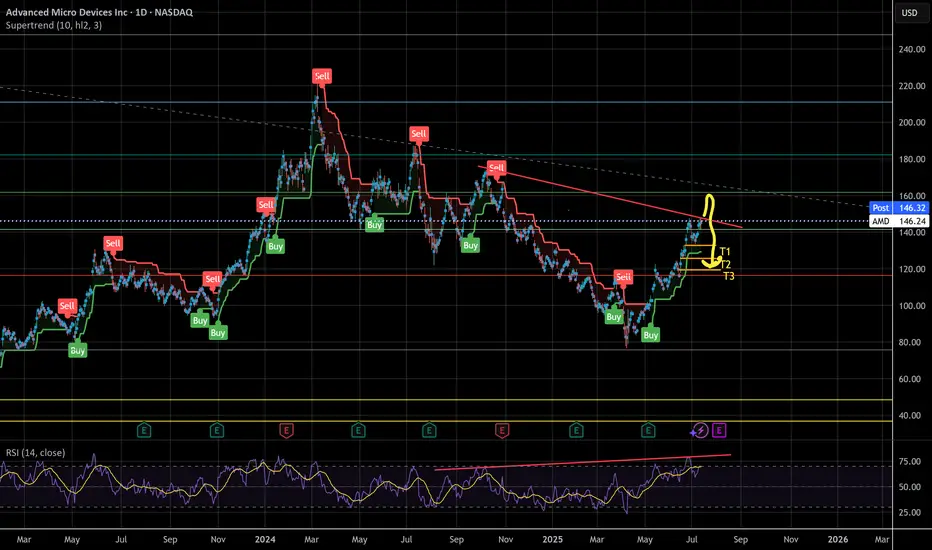
AMDPrice has moved in and out of the target box twice now. The micro pattern hasn't given enough information yet as to what prices immediate intentions are. We have move lower that could very well be the first a wave in wave (C). It could also just be yet another consolidation before we get another slight high to finish intermediate (B). Then you also have the orange count which suggests price is within (5) of ((1)) headed to the yellow 0.786 @ $329.51.
A support line that we need to breach is $157.80. This will just be a clue that a top is in. $149.35 will be the next line of resistance that price needs to break through if it has intentions of moving much lower. Until then, the pressure will remain up.
P.S: MACD supports a top being in on the 4hr chart.

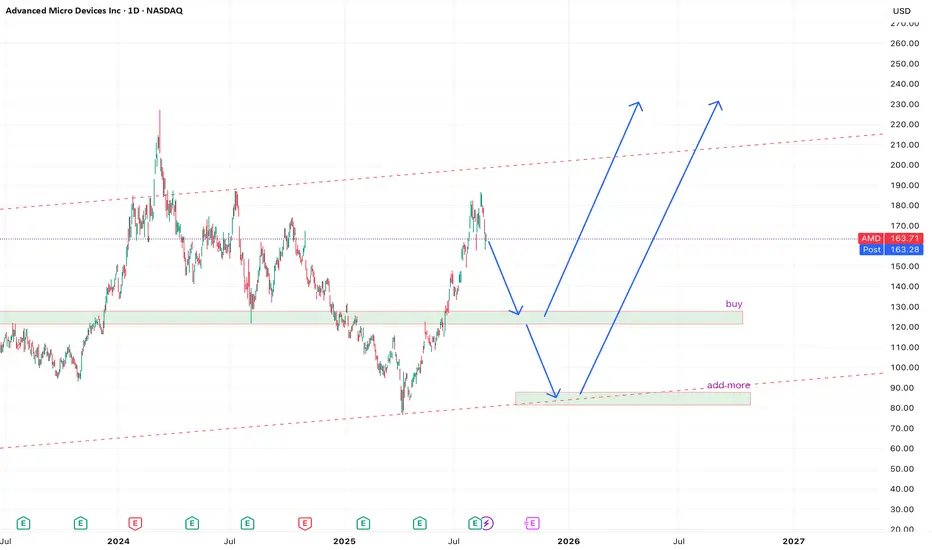
AMD Pullback Opportunity After 70%+ Rally – Watching $111–$120 📈 AMD Update – Strategic Re-Entry Plan
From our original buys at $108, AMD has delivered an impressive 70%+ rally. This strong momentum reflects continued bullish sentiment and growth potential in the semiconductor sector.
We’re now looking to add on a pullback into a confluence support zone between $111 and $120. This level aligns with the:
61.8% Fibonacci retracement
99-day TRAMA
Horizontal support at $120
📍 Entry Zone: $111–$120
🎯 Take Profit Targets: $160 / $220 / $300
❌ Stop Loss: Weekly close below $100
#AMD #NASDAQ #SwingTrade #Fibonacci #TechnicalAnalysis #StockMarket #TradingIdeas

a return to solid buyers presents a cheap =BUY opportunity 1->3 : creates a higher high with number 2
being a solid low , meaning the buyers that
came from here surpassed the sellers from
high number 1
4: a return to the solid buyers
* what do I think will happen :
* a return to solid sellers is always a good idea for
a buy setup
* some negative factors as far as this theory goes would be the bearish divergences on rsi, mfi and accum/dist.
* on a higher high we are potentially returning to a double bottom which is a bullish indication, also we have an overall uptrend which is good
- the chaos theory indicator shows a 63% ofance of follow through to the halfway mark between these sets of zones, at which point we would be much more confident about going long, this also gives us a breakeven and a target point.

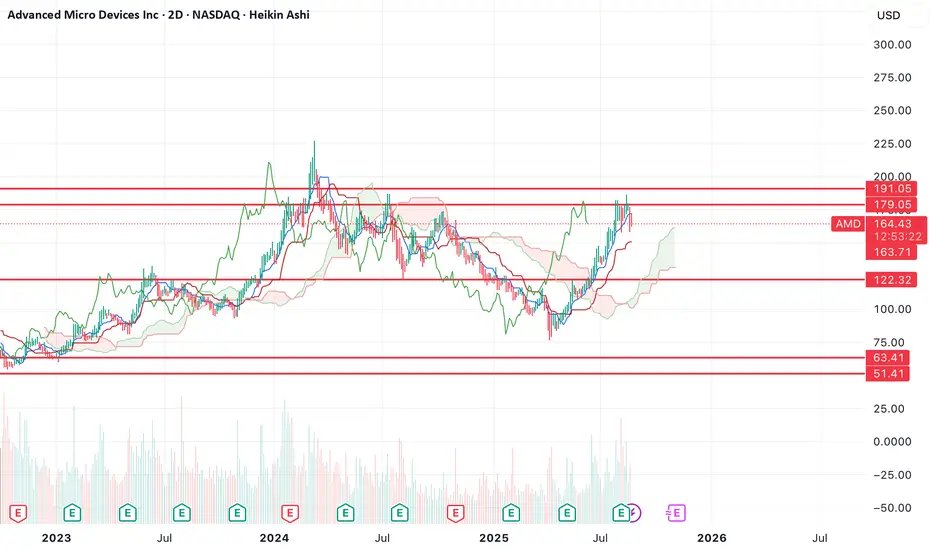
$AMD another HTF lower high? Back to retest lows?While many people are bullish AMD here, I don't think the chart looks that great. The recent rejection here sets up a double top and the possibility for us to go down and retest the lows again.
You can see using Heikin Ashi candles that bearish momentum has already started on the 2D timeframe. You'd need a very strong move higher from here to negate both the double top and the bearish momentum.
The only possibility for the bulls is to break above $191. However, bullish move that goes belows that level will most likely get sold lower.
If price does continue down from here, then I think the most likely outcome is that we test the bottom two supports on the chart before the bullish move starts.
Looking at the chart, it looks to me like the real bull run starts early 2026.
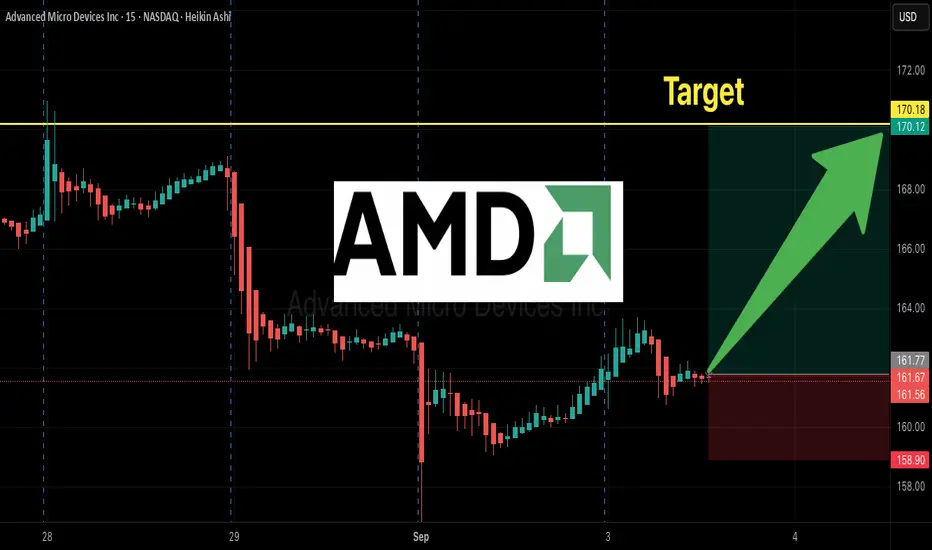
AMD Weekly Call Play – $170 Strike Ready to Explode?
## 🔥🚀 AMD Weekly Options Setup (Sep 3, 2025) 🚀🔥
💎 **High-Risk, High-Reward Call Play!** 💎
### 📊 Market Consensus
* 📈 **Bias:** Moderately Bullish (short-term upside skew).
* 🏦 **Flow:** Institutional heavy call buying (C/P = **2.19**) at \$170 strike.
* 📊 **RSI:** Weekly strong (70.8), Daily weak (43.2) → divergence ⚠️.
* ⏰ **Risk:** Only 2 DTE → Gamma & Theta decay **very high**.
---
### 🎯 Trade Setup
* 🏦 **Instrument:** AMD Weekly Call (Exp 09/05)
* 🚀 **Strike:** \$170
* 💵 **Entry:** \$0.59
* 🛑 **Stop Loss:** \$0.30 (≈50%)
* 🎯 **Target:** \$1.18 (+100%)
* 📅 **Exit Rule:** Close **by Thursday EOD** (don’t hold into Friday gamma).
* 📏 **Size:** 1 contract (keep it small)
* 📈 **Confidence:** 65%
---
### ⚠️ Key Risks
* ⏳ Time decay → Premium can evaporate fast.
* 📉 Weak daily momentum → Possible pullback.
* 🕒 Slippage & spreads → Use **limit orders**.
---
## 📌 Tags (TradingView + SEO Boost)
\#AMD #OptionsTrading #WeeklyOptions #CallOptions #SwingTrade #Breakout #TechStocks #RiskReward #StockMarket #TradingSetup #GammaRisk #ThetaDecay #MomentumTrading
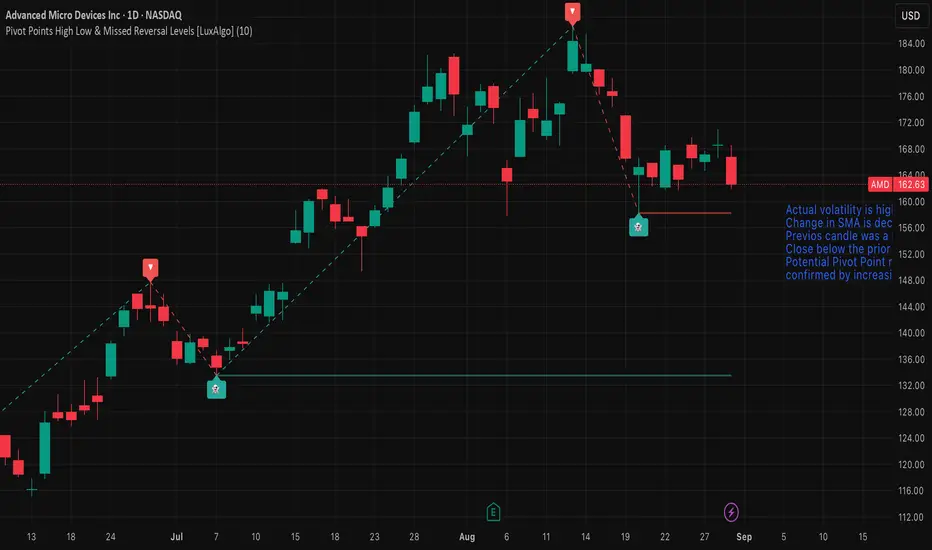
AMD — Watch for Pivot Reversal or Trend ContinuationMarket view
Actual volatility is high, confirmed by the Volatility Bars indicator.
The rate of change in the SMA is decreasing, suggesting momentum is weakening.
The previous candle was a Doji, indicating short-term indecision.
Price closed below the prior day’s low, adding bearish pressure.
A potential Pivot Point reversal is forming.
This reversal setup is confirmed by increasing Convolution Probability, supporting a higher chance of a directional move.
Trade plan
Long (trend continuation): buy on a break above the August 19, 2025 open.
Short (reversal): sell on a break below the pivot reversal at 158.25.
Stop-loss and position sizing: use volatility-based stops (e.g., ATR multiple) and risk no more than a small fixed percentage of capital per trade.
AMD LongLooking at AMD on the 15-minute chart, the broader market structure remains bearish overall, with price forming a series of lower highs and lower lows since the swing high near 186.65, which also marked a Break of Structure (BOS). That BOS confirmed seller dominance at the time. However, a recent Change of Character (CHoCH) around 157.8 signaled the end of the sharp downtrend and the beginning of a recovery phase, as buyers defended key demand and shifted momentum back upward. This suggests that while the macro structure is still heavy, the short-term trend is attempting a reversal.
The key supply zones are clustered between 176–178 and further above at 182–184, where price previously dropped sharply, showing strong selling pressure. These are strong supply levels, as sellers reacted aggressively there. The nearest demand zone sits around 164–166, where buyers stepped in firmly and defended the structure after the CHoCH, marking it as a solid base. Below that, demand extends into the 158–160 range, but that zone would only come into play if the higher demand fails.
Within the marked region, price is currently reacting to the 167 supply area, showing minor hesitation but not heavy rejection yet. Momentum still leans in favor of buyers after the recent higher low was formed. If buyers hold above 166, the likely scenario is a push higher toward the 176 zone, where sellers are expected to re-enter. However, if 166 fails and price breaks back below 164, this short-term bullish setup would be invalidated, and sellers would regain control.
Trade bias: Bullish in the short term
Expected direction: Continuation higher into 176 supply after holding above 166 demand
Invalidation level: A breakdown below 164 would weaken the bullish outlook
Momentum condition: Buyers currently hold the edge with higher lows forming, though supply remains heavy overhead
Price behavior: Controlled upward structure, with buyers gradually reclaiming levels

AMD – Not Chasing, Just WaitingWaiting for a realistic pullback here — not interested in chasing strength. I’ve mapped out two potential entry zones depending on how deep the correction goes. If price pulls back and holds the first key area, I’ll start building the position. If it breaks lower, I’m prepared to add further at the second zone. No need to force anything — just letting the setup come to me.
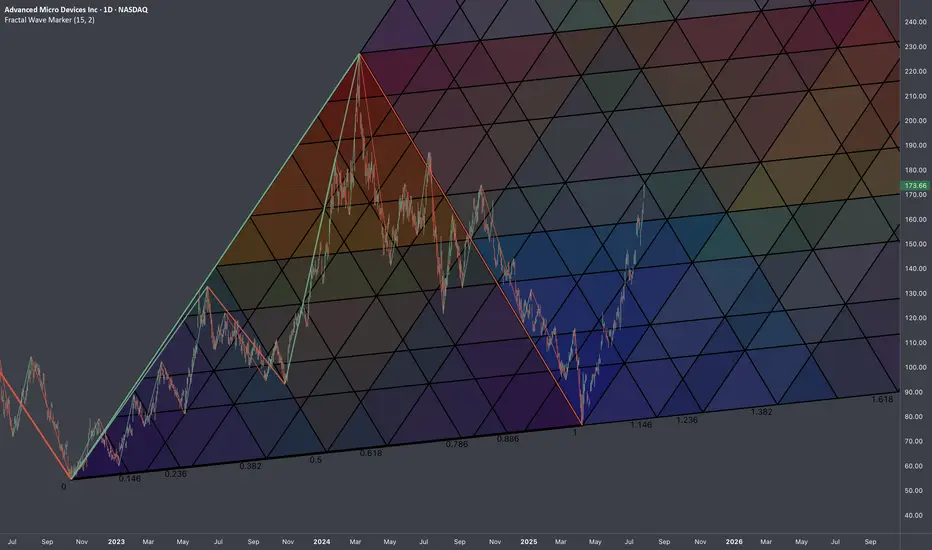
$AMD: Fractal Geometry (Cycle 2022-2025)🏛️ Research Notes
3 Coordinates used for base L-H-L
Fragmented with color spectrum fibs:
Extending structure with same scaling laws:
The chart intended to show objective structure covering unfolding progressions within cycles.
AMD Bottom Band BounceAMD finally putting a doji in on the bottom band. It hasn't hit the bottom band since April then went on a 140% run. Could get a nice bounce here. August tends to be a strong month for NASDAQ:AMD

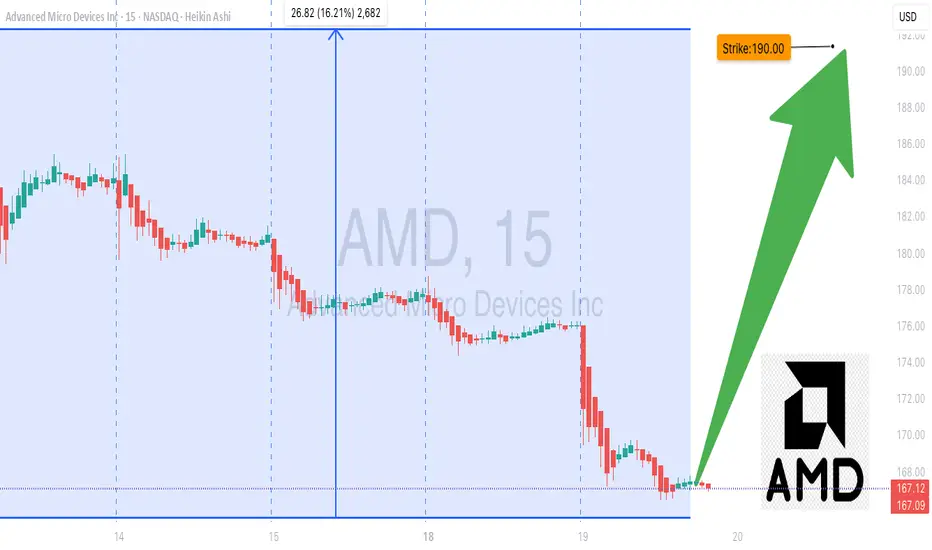
AMD Options Alert: $190 Call Ready to Pop!
# 🚀 AMD Weekly Options Analysis (Aug 19, 2025) 🚀
### **Market Snapshot**
📊 **Daily RSI:** 56.3 ⬇️ (Neutral)
📈 **Weekly RSI:** 85.1 ⬇️ (Potential Reversal ⚠️)
📉 **Volume:** Weak institutional activity (0.6x last week)
🔥 **Options Flow:** Call/Put ratio 1.21 → Moderate Bullish
✅ **Volatility:** Favorable (VIX < 15)
💡 **Overall Bias:** Moderate Weekly Bullish
---
### **Model Breakdown**
| Report | Trend | Volume | Options Flow | Bias |
| -------------------- | ------------------ | ------- | ------------ | ------------------- |
| **Grok/xAI** | NEUTRAL | WEAK 📉 | BULLISH 🔥 | Moderate Bullish 👍 |
| **Gemini/Google** | NEUTRAL/Bearish ⚠️ | WEAK 📉 | BULLISH 🔥 | Neutral/Bearish 🤔 |
| **Claude/Anthropic** | NEUTRAL/Bearish ⚠️ | WEAK 📉 | BULLISH 🔥 | Moderate Bearish 👎 |
| **Llama/Meta** | NEUTRAL ⚠️ | WEAK 📉 | BULLISH 🔥 | Moderate Bullish 👍 |
| **DeepSeek** | NEUTRAL ⚠️ | WEAK 📉 | BULLISH 🔥 | NEUTRAL 🤷 |
✅ **Consensus:**
* Weak volume = concern 🚨
* Low VIX = favorable for options 💎
* RSI signals mixed; overbought caution ⚠️
---
### **💥 Trade Recommendation 💥**
**Strategy:** Cautious Naked Call
* 🎯 **Instrument:** AMD
* 💰 **Strike:** \$190
* 🗓️ **Expiry:** Aug 22, 2025
* 💵 **Entry Price:** \$0.70
* 🎯 **Profit Target:** \$1.05 (50%)
* 🛑 **Stop Loss:** \$0.35
* ⏰ **Entry Timing:** Market Open
* 📈 **Confidence:** 65%
⚠️ **Key Risks:**
* ⏳ Accelerated time decay (3-day expiry)
* 📉 Weak volume may trigger profit-taking
---
### **Trade JSON**
```json
{
"instrument": "AMD",
"direction": "call",
"strike": 190.00,
"expiry": "2025-08-22",
"confidence": 0.65,
"profit_target": 1.05,
"stop_loss": 0.35,
"size": 1,
"entry_price": 0.70,
"entry_timing": "open",
"signal_publish_time": "2025-08-19 09:51:08 UTC-04:00"
}
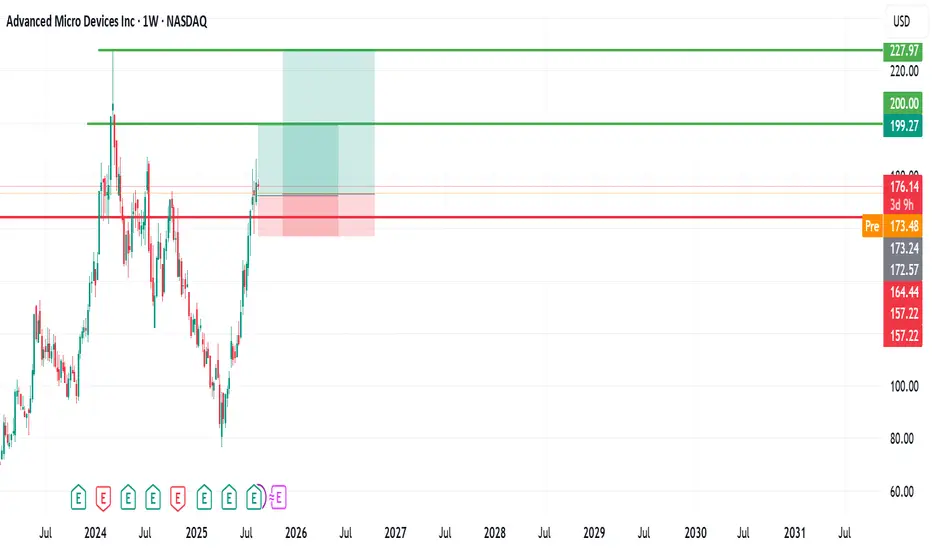
Advanced Micro Devices (AMD) Stock Analysis. My buyAdvanced Micro Devices (AMD) Stock Analysis
AMD, listed on NASDAQ, has generally been on an upward trend. However, the last 2 weeks, the stock experienced a brief flash downturn, dropping to around the $157 level and witnessed a good recovery last week, reaching $186 zone.
Since then, it has pulled back and is currently trading at approximately $176 share.
Outlook:
I remain bullish on AMD with entries from $176 - $172 and anticipate a potential move toward the $200 level, with a longer-term target around its all-time high near $226.
For my entry strategy, I am adding positions at different levels, with an initial entry around $176 and another if it drops further
Position (s) are for a mid- to long-term hold.
Let’s see how it unfolds! If you have any insights or thoughts, please share them in the comments. I’d love to connect with you. Don’t forget to follow, share, and subscribe. Thank you.
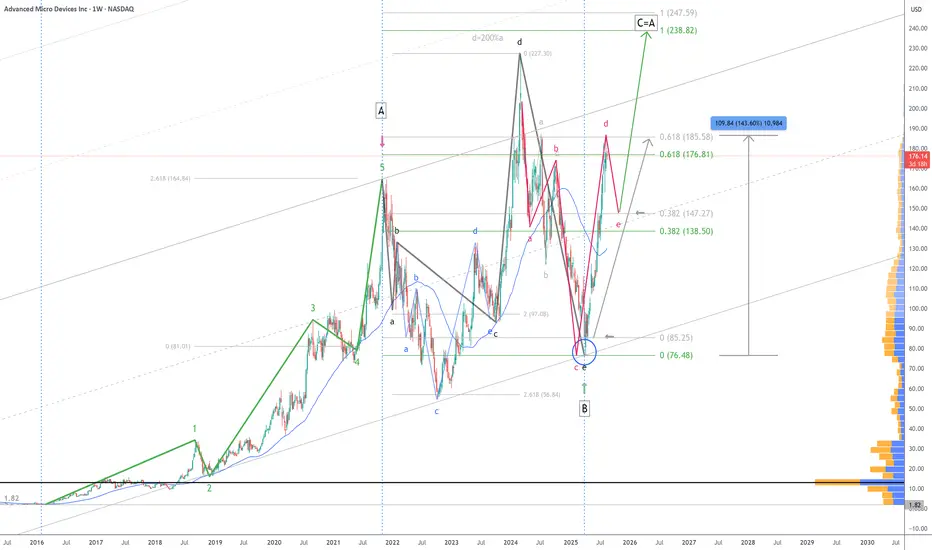
$AMD Analysis: Perfect Hit & One of Many Scenarios! 8/18/2025NASDAQ:AMD hits the 61.8% target of major wave A - up nearly 144% gain in 3 months! 👌
📈 A pause near $148 could complete the red NT (abcde) structure before a potential continuation toward C=A target at $236 or $247
One of many paths... let’s see how it unfolds!
Cheers!
#ElliottWave #AMD #TechnicalAnalysis
AMD Ready to Break Higher – $190 Calls Flashing Opportunity!
# 🚀 AMD Weekly Options Analysis (2025-08-17) – Don’t Miss Out!
### 🔎 Market Overview
AMD’s weekly options landscape shows **strong bullish sentiment**: high call volume and supportive sentiment suggest traders expect upward movement, though some caution arises from declining short-term indicators.
---
### 📊 Key Model Insights
* **Call/Put Ratio:** 2.03 → strong bullish flow
* **Weekly RSI:** 87.8 → extremely bullish momentum
* **Daily RSI:** 59.1 → short-term downward trend, caution advised
* **Volume:** 0.8x last week → declining institutional participation
* **Gamma Risk:** Low → favorable for entering near-term options
---
### 📌 Agreement & Disagreement
* **Agreement:** All models confirm **moderate-to-strong bullish sentiment** due to options flow and low VIX environment.
* **Disagreement:** Some models flag **weak volume**, raising caution, while others remain confident in ongoing bullish trends.
---
### 📊 Recommended Trade
* **Direction:** CALL (Long)
* **Strike:** \$190.00
* **Expiry:** 2025-08-22
* **Entry Price:** \$0.70 (midpoint)
* **Stop Loss:** \$0.35 (50% of premium)
* **Profit Target:** \$1.40 (100% gain)
* **Entry Timing:** Market Open
* **Confidence:** 65%
---
### ⚠️ Key Risks
* Weak volume → reduced institutional conviction
* Declining daily RSI → potential short-term reversals
* Monitor news/events → can affect volatility or price
---
📊 **TRADE DETAILS JSON**
```json
{
"instrument": "AMD",
"direction": "call",
"strike": 190.00,
"expiry": "2025-08-22",
"confidence": 0.65,
"profit_target": 1.40,
"stop_loss": 0.35,
"size": 1,
"entry_price": 0.70,
"entry_timing": "open",
"signal_publish_time": "2025-08-17 09:30:00 EDT"
}
``

AMD One-Day Call Opportunity – Quick Gains Ahead!🚀 AMD \$185 Call – One-Day Bullish Sprint
**Sentiment:** 🟢 *Strong Short-Term Bullish*
* **Daily RSI:** 64.2 📈
* **Weekly RSI:** 88.4 📈
* **Call/Put Volume:** Favoring calls strongly
* **Volume:** Weak (0.8× last week) → watch for support
* **Gamma Risk:** HIGH ⚡ — 1-day expiry
---
### 📊 **Consensus Snapshot**
✅ Majority of models: bullish momentum
⚠️ Weak volume + high gamma → strict risk management required
💡 Entry timing and discipline are critical
---
### 🎯 **Trade Setup**
* **Type:** CALL (Single-leg)
* **Strike:** \$185.00
* **Expiry:** 2025-08-15
* **Entry:** \$2.61 (mid-market)
* **Profit Target:** \$3.90 (+50%)
* **Stop Loss:** \$1.30 (–50%)
* **Confidence:** 70%
* **Trade Size:** 1 contract
* **Entry Timing:** Market open
---
💬 *High-momentum, short-term expiry play — monitor volume and be ready to exit quickly.*
📌 *Not financial advice. DYOR.*
---
**#AMD #OptionsTrading #CallOptions #DayTrading #StocksToWatch #GammaRisk #OptionsFlow #TradingSignals**

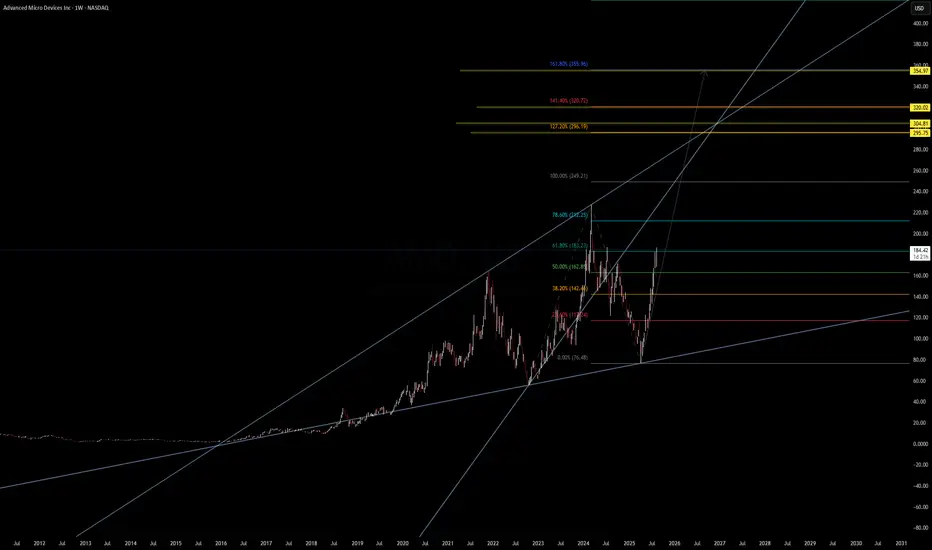
AMD | Weekly Macro Structure – Eyeing Major Fib Extensions AMD | Weekly Macro Structure – Eyeing Major Fib Extensions 🚀
AMD has broken above the 61.8% retracement ($183.23) from its previous cycle and is pushing toward the 78.6% zone ($212.25). This breakout from the mid-channel region signals strong bullish momentum with clean room toward upper Fibonacci extensions.
Key Levels:
Fib Retracements:
61.8% – $183.23 ✅ (broken)
78.6% – $212.25 (next resistance)
Fib Extensions:
127.2% – $296.19
141.4% – $320.02
161.8% – $355.96
200% – $421.94
227.2% – $486.92
Trend Structure:
Long-term ascending channel intact since 2018.
Recent bounce from macro trendline near $76 set a higher low.
Breakout path projects a potential test of $300+ in the mid-term if momentum holds.
Macro & Catalysts:
AI/data center growth remains a key revenue driver, though export restrictions to China could slow short-term upside.
Positive sentiment from recent product launches and strong PC chip recovery.
Watch For:
Pullback retest of $183 support before continuation.
Weekly close above $212 for momentum confirmation toward $250–$320.
📊 Not financial advice. Chart for educational purposes.
AMD: Correct ABC Wave ComingAMD is in its final wave up and expected to reach $190 by the EOW. From there, I am expecting heavy selling volume to begin sometime next week. The A wave of the ABC correction will likely bring AMD down to $163-160 range by as early as next week.
