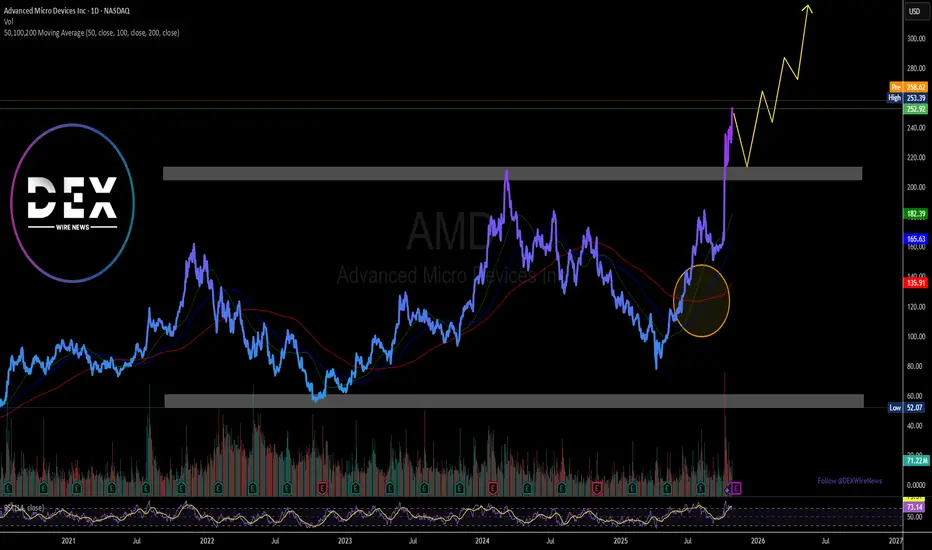
Amd - This is still not over yet!🚀Amd ( NASDAQ:AMD ) can rally another +25%:
🔎Analysis summary:
This month alone, Amd has been rallying another +50%. All of this happened because of an expected rejection at a major confluence of support. Looking at the rising channel pattern though, Amd can still rally another +25% before this rally might actually be over.
📝Levels to watch:
$300
SwingTraderPhil
SwingTrading.Simplified. | Investing.Simplified. | #LONGTERMVISION
Trade ideas

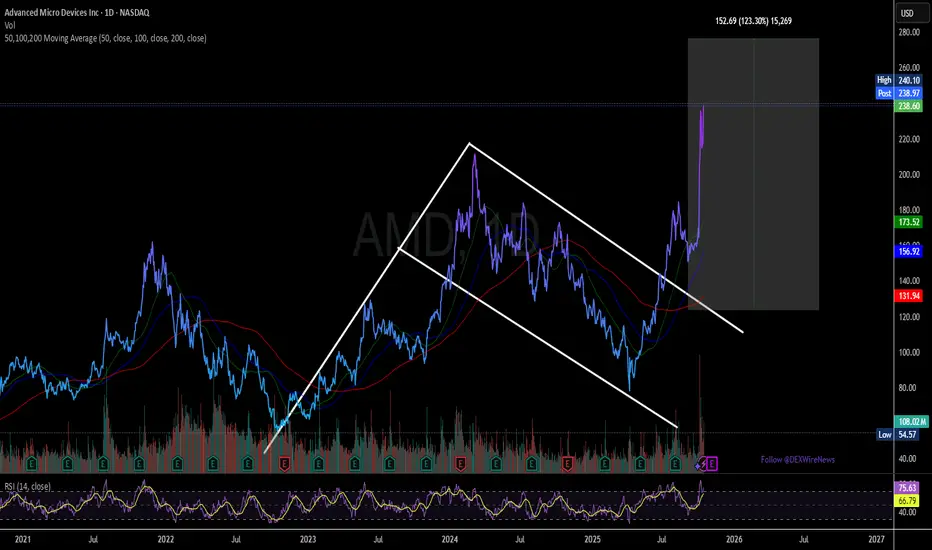
Amd - This is just the beginning!🎈Amd ( NASDAQ:AMD ) breaks out soon:
🔎Analysis summary:
Just a couple of months ago, we witnessed a very strong bullish retest on Amd. Back then the channel continuation remained extremely likely, perfectly playing out until today. But despite the recent parabolic rise, Amd can still rally another +50% according to the chart.
📝Levels to watch:
$200 and $300
SwingTraderPhil
SwingTrading.Simplified. | Investing.Simplified. | #LONGTERMVISION

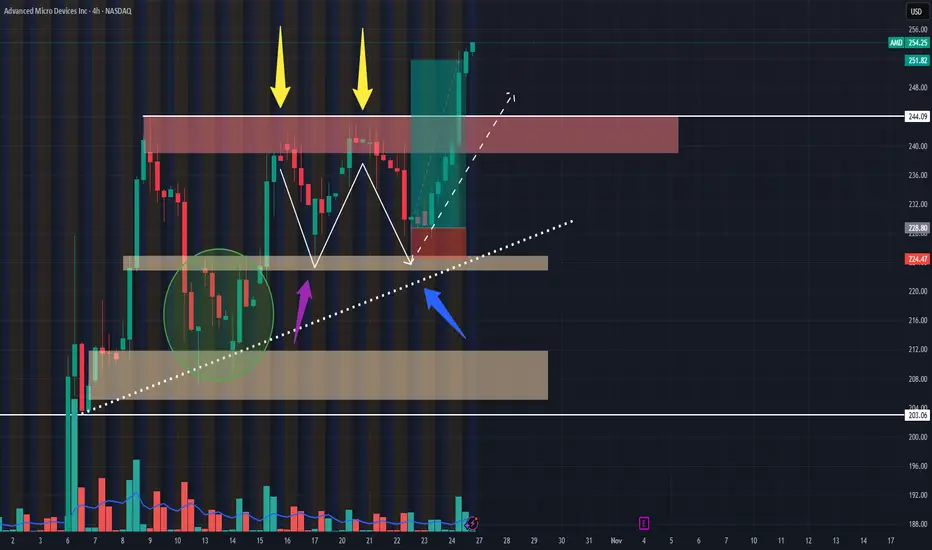
AMD Went Crazy!!! Post Trade Analysis 10/25/24Hello all,
This is my first time posting on here. So, please feel free to leave any questions, advice, or anything else in the comments!
I took this AMD swing trade on the 10/22/25 @ 2:12ish PM CST.
POSITION:
1 $300 Strike Call Exp Nov 7th 2025
Risk: $30 (price takes out low of hammer candle)
Initial PT: Previous highs (Red box) for $75 profit
Final PT: Actively managed since price moved past previous highs ($144 final profit)
WHY I TOOK THE TRADE
1. From the 7th-23rd AMD looked to be forming an ascending triangle pattern on the 1 day and 4HR timeframe.
2. AMD validated 2 support areas to me, which was an ascending support line (Blue arrow) and a demand zone from $222.92 to $225.11 (Purple arrow). In addition to this, price recently broke out from a W pattern (Green bubble) around 10/14 on the 1-4HR time frame (wish I saw it forming sooner lol), which confirmed to me that there was still momentum for the upside.
3. I saw that AMD was potentially forming another larger W pattern on the 1-4HR timeframes (Yellow arrows).
ENTRY Rules:
1. Measure Risk to Reward position, if less than 1.8 to 2.5 R/R, don't take the trade.
2. Wait for price to pull back to area of value (confirmed by multiple touch points.
3. Wait for a strong bullish candle to close 60% or above previous bearish candle (at the demand zone level), to confirm potential price reversal; then enter on the open of the very next candle.
4. Place SL where price invalidates analysis (below bullish hammer candle and demand zone), and PT at most recent highs (or actively manage if price pushes to the upside with momentum).
SUMMARY:
I am glad I took this trade, because it I am still relatively new to trading and I am improving on following my trade plan and TA more.
If anyone has any comments or feedback I would love to chat!
Thank you!
AMD: Wave [iv] Low AMD shares have recently gained upward momentum as anticipated, confirming the low of wave in magenta. In light of this, we have added a new resistance level at $223.50 to the chart. The primary outlook is for the stock to continue completing the magenta five-wave sequence to the upside, thereby finishing the larger magenta wave (1). Afterward, wave (2) is expected to pull price back toward support at $164.53. Alternatively, AMD could see a direct sell-off, which would bring the alternative wave alt.(2) to an early conclusion. In this scenario, wave alt.(1) would already be complete, with a probability of 27%.

AMD clearing a daily tight flag right after a weekly C&HAfter Clearing a Weekly Cup with Handle, AMD is now clearing a tight flag on the daily chart.
Key points at the time of writing.
✣ New bull market cycle running since June 2025
✣ Market Direction is Up 90%
✣ Stock Fundamentals are good with multi-month growth except in December 2024
✣ Recent Open AI deal acted as catalyst to clear recent Cup with Handle base.
✣ Strong Institutional Interest with 2091 Buyers vs 1451 sellers TTM and a ownership of 71%
✣ Stock recently reset it's base count.
✣ TTM Performance is 53%
✣ Earnings due in 2 weeks !
If this tight flag is broken to the upside, it could be a buy opportunity and a confirmation to a more important upside move.

AMD Potential Long. 85% Win Rate. Using the above chart as a Macro indicator you can see that the time to buy AMD has arrived.
Each time the RSI moves to an oversold position in the 3 week we often see great returns. The exception being 2008 where the period was much longer than usual.
Yesterday I finished back testing AMD from 1972 to 2025. I came out with a 85% win rate over those years. I did not use the chart above either as it would have created an unfair bias for my normal trading strategy and rules. 1994-1995ish was the first bad trade and another stumbling block was 2008-2009. As it was very drawn out and stop losses were triggered.
Using the 85% Win Rate strategy and using the above chart shows us the following:
RSI: Tickled the oversold zone. I am sceptical of this as I do not think the move will be a massive one as it barely touched the zone but in previous years we will still see a 30-40% move in similar cases.
Phoenix Bollinger Bands: This indicates that price is where its suppose to be. On lower timeframes it also shows that price does have the potential to expand to 130-140 range.
Strategy: The strategy that I use is indicating that the 2 week buy signal is 2 days away from confirming.
I have the following things to do:
1) Update tomorrow if Buy Signal is confirmed. If was more aggressive I would be buying today but because its only a 85% win rate and not 90%+ like the others I will wait.
2) Regardless if price goes down from here or not. I will start to build a position from tomorrow.
Sorry that I did not post all the charts etc in this one today. I am just a bit busy with my own trades and thought I would try get this out ASAP.
Have a blessed day and Stay Adaptable.

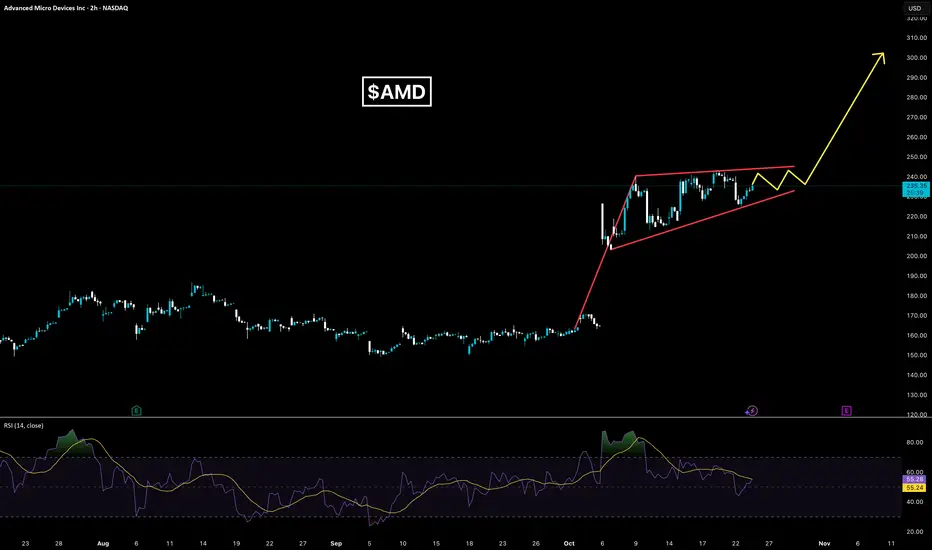
$AMD – Bull Flag Breakout & Momentum StructureNASDAQ:AMD broke out from its bull flag on October 1st, following a two-month consolidation phase that began in August. The breakout opened up a sharp 19% gap, driven by strong volume and follow-through buying pressure — a classic continuation move after months of coiling price action.
Current Structure & Momentum
After a 90% rally YTD, price has now run into congestion near $240, which aligns with prior resistance and psychological round-number supply. Despite that, AMD continues to hold the 8-day moving average, indicating that short-term momentum remains intact and buyers are still in control.
Watch for how price reacts around the 13-day and 21-day MAs:
Holding above the 8-day → momentum intact.
Break below the 13-day → short-term pause or cooling phase.
Decisive close below the 21-day → potential trim/take-profit zone before reassessing.
The trend remains bullish until proven otherwise — let the chart tell its story before making assumptions.
Gap Zone & Risk Levels
The October breakout left a significant unfilled gap, a key reference area for potential re-tests if market sentiment turns.
Gap mid-point (~$186) marks a 50% retrace zone — a logical first level for dip buyers if AI or semiconductor sentiment weakens.
As long as price holds above $205–$210, the breakout structure remains valid.
A full gap fill would only become likely on heavy distribution or macro risk-off rotation across tech.
So far, the gap has not been filled, underscoring the underlying strength of the move.
Volume & Target Projection
Volume supported the breakout, confirming institutional participation and validating the pattern. Using a 1:1 flagpole measured move, the projected target for the breakout sits around $275 — which also aligns with the next visible volume-profile node on higher timeframes.
Summary
✅ Trend: Bullish continuation
✅ Momentum: Holding 8-day EMA → strong
⚠️ Risk line: Close below 21-day MA → trim/reevaluate
🎯 Target: ~$275 (flagpole 1:1 projection)
📊 Gap zone: Watch $186–$205 for any retrace reactions
Final Notes
Momentum remains in AMD’s favor as long as short-term EMAs hold and sector sentiment supports the move. Watch how the stock behaves into $240 — acceptance above turns that zone into potential new support, opening the path to $260–$275.
For educational and technical analysis purposes only.
#Stocks #Crypto #TA #Semiconductors #NASDAQ NASDAQ:AMD
$AMD Seeing a clear path to $300 NASDAQ:AMD Bull flag pennant. Absolutely gorgeous setup here.
Any news involving AI deals/partnerships or strong forward guidance with earnings next month and we fly.
Keep it on your radar!
AMDechnical Analysis – AMD (NASDAQ: AMD)
Current Price Action:
AMD is trading around $158.57, after rebounding strongly from the recent bottom.
The stock has broken out of the short-term downtrend line, which is a bullish signal.
Major Trend:
The chart shows a long-term uptrend (black trendline), which has been respected since 2018.
Each correction has formed higher lows, confirming AMD’s overall bullish structure.
Support Levels & Buy Zone:
Key support zone: $115–$95 (highlighted as the “waiting correction buy zone”).
If AMD retraces to this area, it would provide a high-probability buying opportunity aligned with the major trend.
Stronger support lies at $72, marked as the stop-loss level if long-term structure fails.
Resistance & Target Levels:
Immediate resistance is around $160–$180.
A breakout above this zone could lead to acceleration toward the previous all-time high ($229), which is the major upside target.
If $229 is cleared, AMD could enter a new bullish cycle toward uncharted highs.
Trend Outlook:
Short-term: Potential pullback from current levels due to overextension, with a likely retest toward $130–$115 before continuation.
Mid-term: As long as the stock stays above $95, the bullish trend remains intact.
Long-term: Target remains at $229 (new high), provided the uptrend is sustained.
Risk Management:
Aggressive traders may hold at current levels, but best R:R entries are in the $115–$95 correction zone.
Stop-loss: $72 to protect against a major trend reversal.
Conclusion
AMD remains in a major long-term uptrend with strong bullish momentum. Current levels ($158) are closer to resistance than ideal entry points, so a correction into $115–$95 would be the most favorable buying opportunity. Long-term investors can target $229, while keeping $72 as the invalidation level.

AMD could see further downsidePreviously, before the 10 Oct crash, I posted here () that AMD is timed for a pullback with $213 as a price to sell puts off.
It worked perfectly. NDX looked tired to the upside, thus, possible further pullback underway, with $195/$200 as price targets based on my confluence of algo levels.

AMD - Bullish on Volume and Potential AI I like the volume chart on AMD on this Monthly timeframe, with a consistent growth curve.
AMD also may play a role in the developing AI framework.
Also on chart price can be seen to have broken above the strongest resistance in green.
Monthly chart
Advanced Micro Devices, Inc. (AMD) Gearing For A BreakoutThe share price of Advanced Micro Devices, Inc. (NASDAQ: NASDAQ:AMD ) is setting sail for a 50% breakout albeit market condition is overbought.
Sitting with an RSI of 73, Advance Micro Devices (AMD) shows continuous bullish momentum with the daily price chart indicating a golden cross pattern- this is an interception between the 50day-MA and the 200-day MA indicating bullish momentum building.
In another news, - Advance Micro Devices (NASDAQ: AMD) today announced the completion of the agreement to divest the ZT Systems U.S.-headquartered data center infrastructure manufacturing business to Sanmina (NASDAQ: SANM).
About AMD
Advanced Micro Devices, Inc. operates as a semiconductor company worldwide. It operates in three segments: Data Center, Client and Gaming, and Embedded. The company offers artificial intelligence (AI) accelerators, x86 microprocessors, and graphics processing units (GPUs) as standalone devices or as incorporated into accelerated processing units, chipsets, and data center and professional GPUs; and embedded processors and semi-custom system-on-chip (SoC) products, microprocessor and SoC development services and technology.
Trading $AMD to the $250 in the next 6 monthsCloud & Data Center Partners
Amazon EC2, Google Cloud, and Microsoft Azure: These major cloud providers integrate AMD’s EPYC processors into their infrastructure, offering scalable and efficient computing solutions.
Dell Technologies, Hewlett Packard Enterprise (HPE), Lenovo, Supermicro, and Cisco: These OEMs design and manufacture servers powered by AMD's processors, catering to enterprise and high-performance computing needs.
IBM: In August 2025, AMD and IBM announced a collaboration to develop scalable, open-source platforms, combining IBM's quantum computing innovations with AMD's high-performance computing and AI accelerators.
🧠 AI & High-Performance Computing (HPC)
OpenAI: During AMD's "Advancing AI" event in June 2025, OpenAI announced its intent to utilize AMD's upcoming MI400 chips for its AI infrastructure.
Meta, xAI, Oracle, Microsoft, Astera Labs, and Marvell Technology: These companies are collaborating with AMD to integrate its AI chips into their platforms, enhancing AI capabilities across various applications.
Liquid AI: AMD led a $250 million funding round for Liquid AI, a startup specializing in generative AI. This partnership aims to optimize Liquid AI's models using AMD's hardware.
🎮 Gaming & Consumer Electronics
Sony (PlayStation): AMD and Sony are working together on "Project Amethyst," an initiative to enhance gaming graphics and gameplay using AI technology across platforms, including PlayStation and PC.
11 bit studios: AMD has partnered with this Polish game developer to optimize future games like "Frostpunk 2" and "The Thaumaturge" for AMD hardware, incorporating technologies like FidelityFX Super Resolution 3.
🧪 Research & Development Collaborations
Absci Corporation: AMD has formed a collaboration with Absci to advance AI-driven drug discovery, leveraging AMD's computational power to enhance research capabilities.
Micron Technology: AMD and Micron share a vision of enabling and supporting customers with leading computing, memory, and storage solutions, collaborating on development and enablement to provide high-performance, secure, and efficient customer deployments.
🌐 Global & Strategic Collaborations
HUMAIN: AMD and HUMAIN have formed a strategic collaboration, investing up to $10 billion to deploy 500 megawatts of AI compute capacity over the next five years, aiming to power AI workloads across various markets.
ZT Systems & Sanmina: AMD has reached an agreement to sell the server-manufacturing division of ZT Systems to Sanmina for $3 billion, while retaining control of ZT's AI systems design business, strengthening U.S.-based production of AI data center systems.

Advanced Micro Devices Stock Broke Out of a Bullish Flag TodayThe price of Advanced Micro Devices, Inc. (NASDAQ: NASDAQ:AMD ) has broken out of a falling wedge pattern gaining roughly 9% today. With the daily price chart showing a golden cross pattern the stock is poised to reach the $270 pivot and beyond amidst growing interest.
The surge reflects recent optimism about AMD’s expanding role in the AI chip market, fueled by new partnerships, including a significant deal to supply chips to Oracle’s cloud infrastructure and collaborations with AI leaders like OpenAI.
Moreover, the investors’ confidence is also boosted by recent positive commentary by analysts, who also raised their price targets on AMD stock.
About Advanced Micro Devices, Inc.
It operates in three segments: Data Center, Client and Gaming, and Embedded. The company offers artificial intelligence (AI) accelerators, x86 microprocessors, and graphics processing units (GPUs) as standalone devices or as incorporated into accelerated processing units, chipsets, and data center and professional GPUs; and embedded processors and semi-custom system-on-chip (SoC) products, microprocessor and SoC development services and technology, data processing units, field programmable gate arrays (FPGA), system on modules, smart network interface cards, and adaptive SoC products.
Be careful with AMD!!! Likely reason for the target increase: Rapid growth in the field of artificial intelligence and strong demand for advanced chips, especially in competition with Nvidia.
So if you pay attention to the AMD chart you can see that the price has formed a Ascending Pennant which means it is expected to price move as equal as the measured price movement.( AB=CD )
NOTE: wait for break of the FLAG .

AMD - Wonderful ascending triangle formationFundamentals are great, earnings in 16 days likely to outperform. Pair that with a bullish ascending triangle out of a textbook and you have a bull entry like no other.

What would be the potential?Lookin a the possible bullish flag set up with 510-65% gain potential in the next 4 months!
Hello trader, for tomorrow 10/17/25 AMD: 234.56In recent days, the market has been indecisive, making trading more complicated than it is.
A quick initial bullish entry would be above 234.00 to 240.00. If there is a bearish rejection at 240.00, we could have another bullish entry above 242.00/244.00.
Bearish entry below 231.00/230.00 for added security if the market favors us.
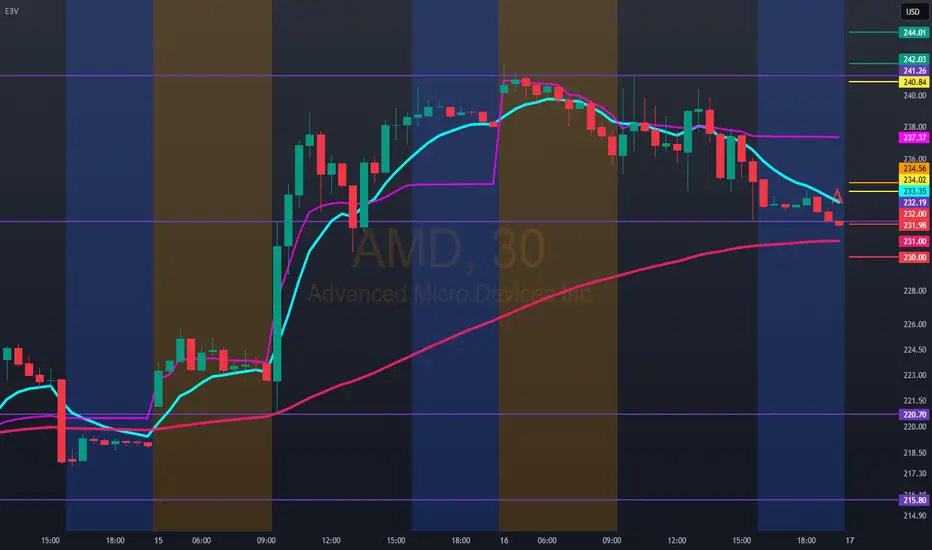
AMD Friday Setup – Oct. 17Bulls Guard the Trend Channel as Gamma Tightens Near $233 ⚡️”
📊 Multi-Timeframe Breakdown
🕒 1. Daily Chart – Macro Structure (“The Why”)
AMD remains one of the cleanest momentum structures among large-cap semis. The broader uptrend channel from May is still intact, with price trading near the midline between $225 and $245.
Despite Thursday’s 1.6% dip, AMD’s daily structure shows no breakdown — just a healthy retest of support within the rising parallel channel.
MACD remains strongly bullish, though the histogram is flattening — a sign of short-term consolidation after an extended run. Stoch RSI is cooling from overbought territory, suggesting buyers are taking a breather before potentially resuming control.
Macro Bias: Bullish continuation unless price closes below $225, where the lower channel and 21EMA converge.
Key Levels:
* Support: $225 → $218 → $207
* Resistance: $244 → $250 → $260
⏰ 2. 1-Hour Chart – Active Market Structure (“The Setup”)
The 1-hour chart highlights a short-term CHoCH after AMD’s run toward $244, now retracing toward intraday support at $232–$234.
The stock has respected its ascending intraday trendline drawn from the $210 base, with structure still forming higher lows despite minor pullbacks.
MACD is cooling from a high momentum phase but remains above zero, suggesting a pause — not a reversal. Stoch RSI is dipping into the lower range, which could reset for a new push if buyers defend $232.
If AMD holds above the HVL ($233) zone, it may build a base for a renewed breakout toward $238–$244 by Friday’s session close.
Key Levels:
* Support: $233 → $230 → $225
* Resistance: $238.5 → $241.9 → $244.0
💹 3. 15-Min Chart – Intraday Execution (“The How”)
AMD’s 15-min structure shows a clear CHoCH → BOS sequence during Thursday’s session, followed by a descending wedge correction — a potential bullish reversal setup if momentum shifts early Friday.
The MACD histogram has compressed tightly near zero, while Stoch RSI is curling up from oversold levels — early hints of reversal behavior.
The 15M structure is well aligned with the 1H support at $232. A reclaim above $235 with volume could confirm a short-term bullish reversal into the mid-$240s.
Scalp Play Idea:
* Bullish Setup: Enter above $235, target $238.5 → $241.5, stop below $232
* Bearish Setup: Break below $231.5, target $227.5 → $225, stop above $234.5
📈 4. GEX (Gamma Exposure) Chart – Dealer Positioning (“The Fuel”)
Friday’s gamma map shows heavy dealer concentration near $233–$238, which explains AMD’s tight compression zone.
* Highest Positive GEX / Call Resistance: $240–$245
* Put Support: $225 → $215
* Gamma Flip Pivot: $233 (current HVL)
* IVR 65 | IVx avg 74.7 | Call Flow 41.4%
Dealers are slightly short gamma around the current price, suggesting potential volatility expansion if AMD breaks out of the $230–$238 box.
A move above $238 could trigger dealer hedging upward — accelerating toward $244 — while a sustained break under $230 opens downside gamma to $225.
🎯 Final Outlook
AMD’s Friday setup leans constructive despite the intraday pullback. As long as $232–$233 holds, bulls maintain control within the ascending channel.
If price reclaims $235+ early in the session with momentum confirmation, expect continuation toward $238–$244, possibly tagging the upper gamma wall before weekly expiry.
However, losing $230 with volume could drag AMD into the $225 liquidity pocket — still within the macro bullish structure but offering a reset opportunity for next week’s rebound.
Watch for a liquidity sweep under $232 followed by a reclaim — that’s the ideal Friday scalp trigger for intraday longs.
Disclaimer:
This analysis is for educational purposes only and not financial advice. Always manage risk and follow your plan.

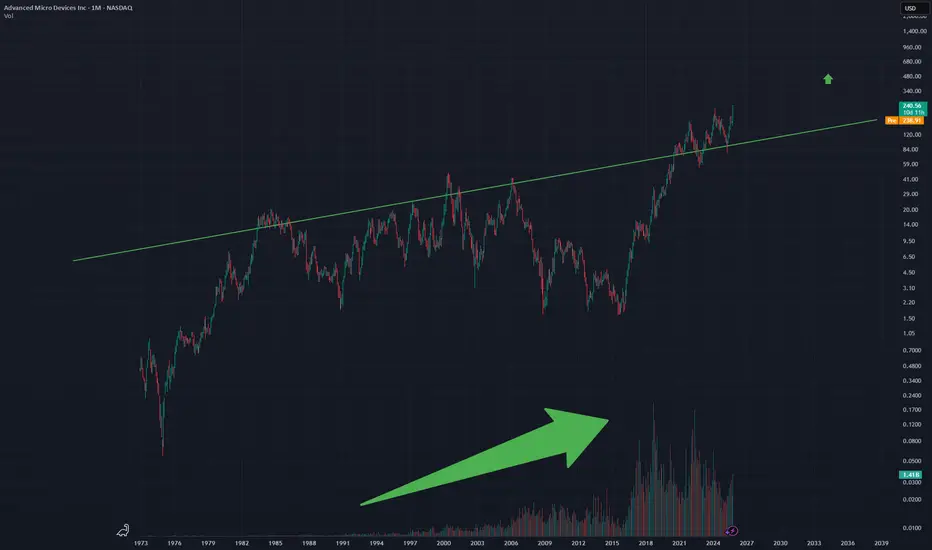
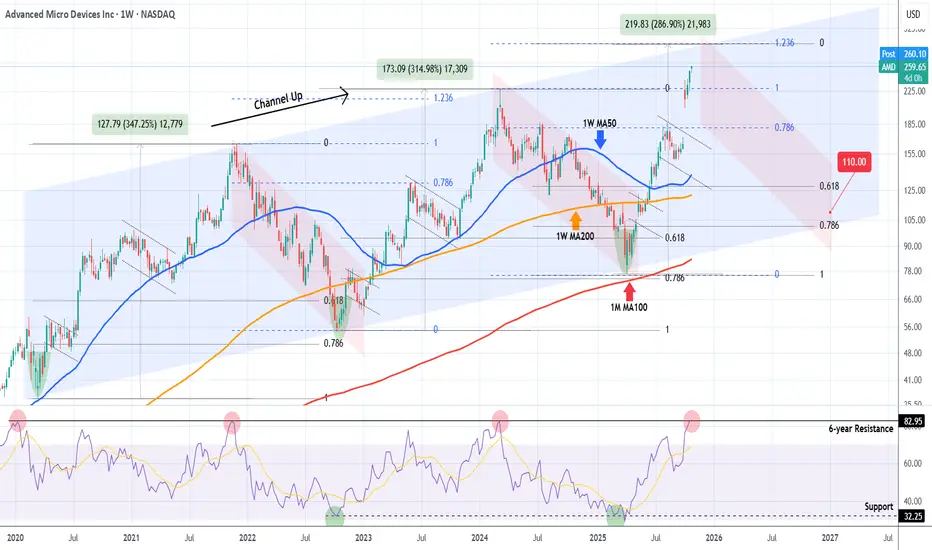
AMD Is it approaching a multi-year top and turning into a Sell ?Almost 8 months ago (March 07, see chart below) we made a bold call (for the time) on Advanced Micro Devices (AMD), expecting it to bottom on its 1M MA100 (red trend-line) and then rebound, targeting $320:
Well the Bullish Leg of its 6-year Channel Up had been even more aggressive than we expected and is already approaching its top (Higher Highs trend-line), much earlier than we expected.
This is technically the right time to book the amazing +240% profits from the April 07 bottom, as the 1W RSI just hit its 6-year Resistance, which has marked the Channel's two Tops.
Even though the Bullish Leg can technically extend as high as +287% on the 1.236 Fibonacci extension (like the previous did), the focus of a long-term investor should now be to buy (much) lower, preferably as close to the 1M MA100 as possible.
The last two Higher Lows of the Channel Up have been priced just above the 0.786 Fibonacci retracement level, so our fair long-term Target is currently at $110.00.
So do you also think AMD is approaching the end of the (long-term) road and is gradually turning into a Sell?
-------------------------------------------------------------------------------
** Please LIKE 👍, FOLLOW ✅, SHARE 🙌 and COMMENT ✍ if you enjoy this idea! Also share your ideas and charts in the comments section below! This is best way to keep it relevant, support us, keep the content here free and allow the idea to reach as many people as possible. **
-------------------------------------------------------------------------------
💸💸💸💸💸💸
👇 👇 👇 👇 👇 👇
October’s top stock performers: #AMD, #Amazon, #Tesla & moreIn October, FreshForex clients most frequently traded stocks like #AMD, #Amazon, #GoDaddy, #Tesla, and #Moderna — and these very assets showed the highest share of profitable trades. Capitalize on strong demand momentum and high liquidity: with earnings season and the holiday rush ahead, the “window of opportunity” is still open.
Outlook through the end of 2025:
#AMD: Shares could rise following the $6B AI compute deal with OpenAI and Oracle’s reported order of 50,000 next-gen MI450 chips.
#Amazon: Strong earnings on October 30, solid AWS growth, advertising contributions, and the fall Prime Big Deal Days may keep the stock bullish.
#GoDaddy: Stock may face pressure if SMB ARPU/inflows slow, plus FX headwinds could dampen August’s raised full-year guidance.
#Tesla: Growth potential supported by record 497K deliveries, 12.5 GWh energy deployments in Q3, and expansion of FSD v14 (Supervised).
#Moderna: Stock remains under pressure amid limited revenue visibility, delayed UK shipments, and postponed approval of its flu+COVID combo vaccine to 2026.
According to FreshForex analysts, the outlook for these stocks remains driven by AI investments and seasonal demand. But the strongest growth impulse is likely in Q1 2026, especially if the Fed eases policy and announced tech projects go live.

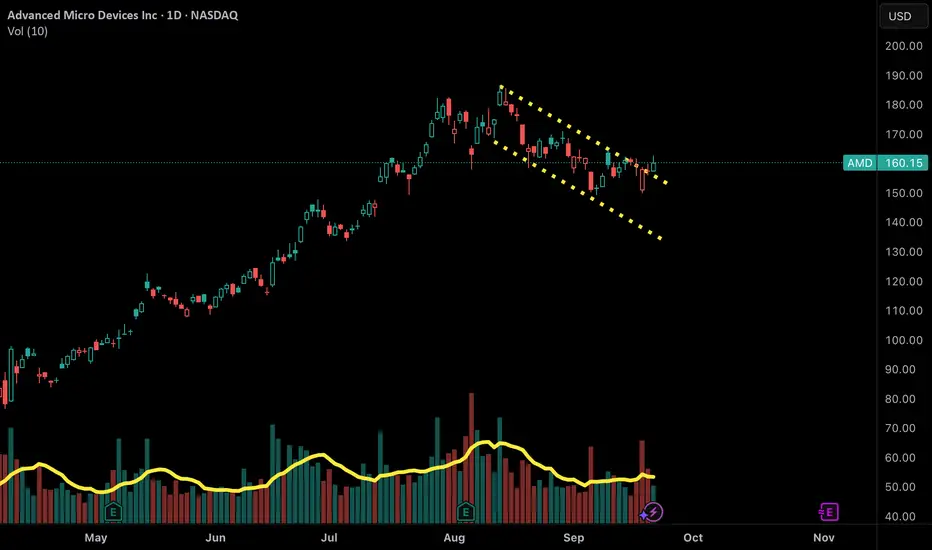
AMD BearishOn the 1-hour chart, AMD has formed a bearish triangle pattern, suggesting potential short-term pullback pressure. However, the broader uptrend remains intact, with long-term momentum still favoring the bulls.

AMD: entering mid-term resistance levelNASDAQ:AMD price followed through from the support zone into the important mid-term resistance outlined in the October updates.
One of the strongest structures and setups on the market. And while there’s still potential for a move into the higher resistance area at 260–277, I expect selling pressure to start building over the next few weeks, leading to a pullback and potential consolidation phase.
Breaking out above 277 will force me to reconsider the trend suggested trend structure.
Chart:
Previously:
• On resistance zone (Oct 13):
• Upside potential (Oct 7):
see in weekly review
Previously this year:
• On macro resistance (Jul 29):
• On resistance & bounce potential (Aug 6):
• On macro bottoming potential (Apr 25):
