BlackRock... Time to take advantage.Yeah that's right, it's time to buy shares of the bad guy's company. Do you really think a firm safeguarding $11 Trillion in assets is going anywhere? I wouldn't guess, which means any dip that comes along is more than likely a gift from the market. With that being said, NYSE:BLK has seen just und
Key facts today
0.7 EUR
5.86 B EUR
19.22 B EUR
About BlackRock, Inc.
Sector
Industry
CEO
Laurence Douglas Fink
Website
Headquarters
New York
Founded
1988
ISIN
CA09263C1068
FIGI
BBG01MLZS188
BlackRock, Inc. engages in the provision of investment, advisory and risk management solutions. Its products include single-asset and multi-asset portfolios. The company was founded by Laurence Douglas Fink in 1988 and is headquartered in New York, NY.
Related stocks

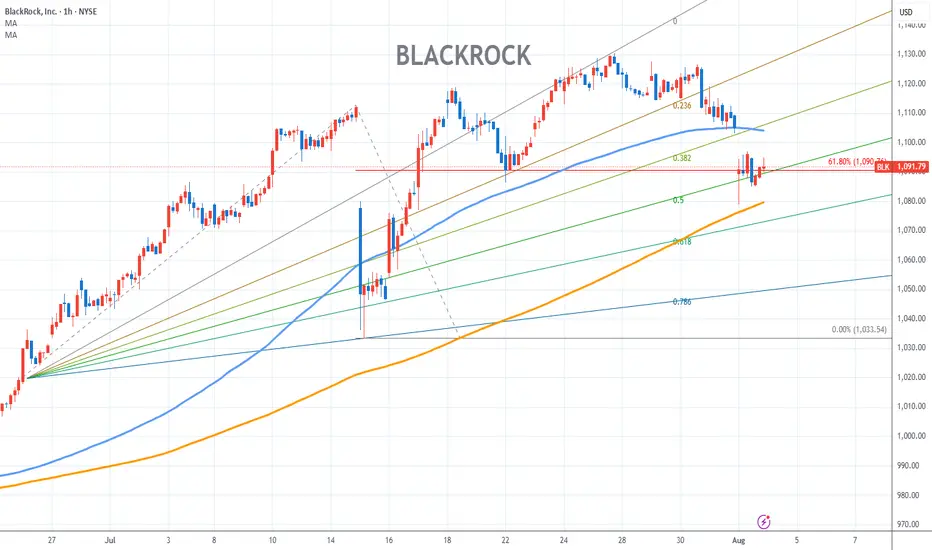
BlackRock Stock Chart Fibonacci Analysis 080125Trading Idea
1) Find a FIBO slingshot
2) Check FIBO 61.80% level
3) Entry Point > 1090/61.80%
Chart time frame:B
A) 15 min(1W-3M)
B) 1 hr(3M-6M)
C) 4 hr(6M-1year)
D) 1 day(1-3years)
Stock progress:C
A) Keep rising over 61.80% resistance
B) 61.80% resistance
C) 61.80% support
D) Hit the bottom
E
BlackrockNice trade to go long here... I have seen tidier C&H setups... But this one looks good for the coming weeks. Worth keeping an eye on

BlackRock Beats EPS Estimates Despite Revenue Miss in Q1 2025 BlackRock Inc. (NYSE: NYSE:BLK ) reported adjusted earnings per share (EPS) of $11.30 for Q1 2025. This beat the Zacks Consensus Estimate of $10.25, marking a 10.24% surprise. In the same quarter last year, EPS was $9.81.
Revenue came in at $5.28 billion, missing the estimate of $5.33 billion by 1

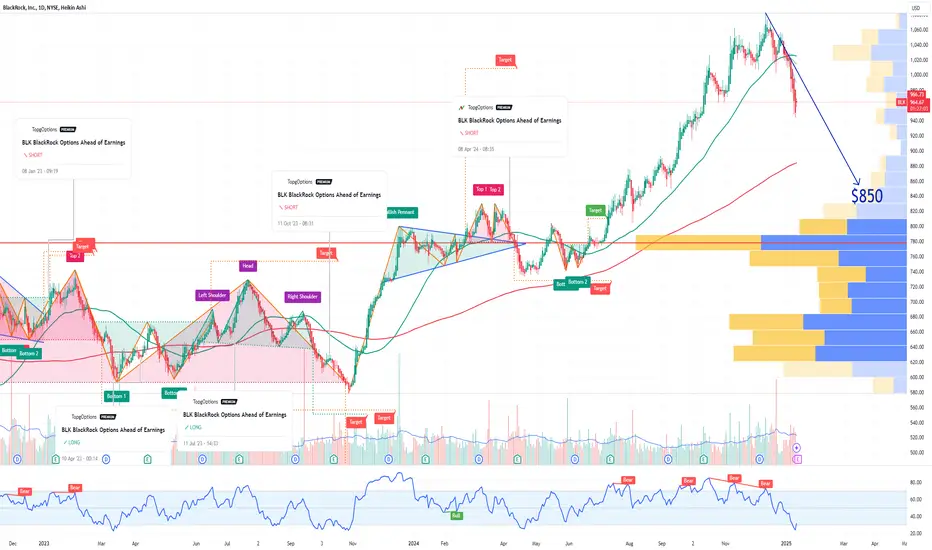
BLACKROCK Stock Chart Fibonacci Analysis 031725Trading Idea
1) Find a FIBO slingshot
2) Check FIBO 61.80% level
3) Entry Point > 900/61.80%
Chart time frame: C
A) 15 min(1W-3M)
B) 1 hr(3M-6M)
C) 4 hr(6M-1year)
D) 1 day(1-3years)
Stock progress: C
A) Keep rising over 61.80% resistance
B) 61.80% resistance
C) 61.80% support
D) Hit the bottom

Shorting BlackRock Back to Stone Age. BLKEllioticians will have fun with this one, because this is a debatable chart wave-wise. Now what else is going on here technically? Volumes, volatility stochastics and momentum are downgoing. Bollinger Bands are no doubt showing something bearish undergoing as well. US/vWAP cross and resting above ca

Speculative Madness: The Market’s Bubble Stocks Some stocks areSpeculative Madness: The Market’s Bubble Stocks
Some stocks aren't just overvalued—they're in full speculative bubble mode. Fundamentals? Irrelevant. When euphoria takes over, rationality disappears.
Here’s my list of bubble stocks that scream unsustainable pricing:
SBUX, T, PLTR, BMY, PYPL, NFLX

BlackRock Is About to Explode – Here’s Why I’m Going Long!📊 BlackRock (BLK) – Bullish Setup Ahead of Earnings! 📊
BlackRock ( NYSE: BLK) is setting up for a potential bullish move as it approaches tomorrow's earnings report (before market open). After a healthy pullback, the stock has bounced off a long-term trendline, showing technical signs of a revers

BLK BlackRock Options Ahead of EarningsIf you haven`t bought BLK before the breakout:
Now analyzing the options chain and the chart patterns of BLK BlackRock prior to the earnings report this week,
I would consider purchasing the 850usd strike price Puts with
an expiration date of 2025-3-21,
for a premium of approximately $6.50.
If the
BlackRock ($BLK): Eyeing $914–$874 for ReversalOnce again, our analysis has proven accurate. Following our initial call, NYSE:BLK rallied by 15%, only to retrace by 12%, erasing nearly all gains from the past three months. This serves as a valuable reminder that protecting capital often outweighs chasing setups with lower conviction.
Currentl

See all ideas
Displays a symbol's price movements over previous years to identify recurring trends.
BLK5767244
BlackRock, Inc. 5.25% 14-MAR-2054Yield to maturity
5.41%
Maturity date
Mar 14, 2054
BLK5852862
BlackRock, Inc. 5.35% 08-JAN-2055Yield to maturity
5.40%
Maturity date
Jan 8, 2055
BLK5767242
BlackRock, Inc. 5.0% 14-MAR-2034Yield to maturity
4.54%
Maturity date
Mar 14, 2034
US9247XAT8
BlackRock, Inc. 4.75% 25-MAY-2033Yield to maturity
4.46%
Maturity date
May 25, 2033
US9247XAS0
BlackRock, Inc. 2.1% 25-FEB-2032Yield to maturity
4.30%
Maturity date
Feb 25, 2032
BLK5852549
BlackRock, Inc. 4.9% 08-JAN-2035Yield to maturity
4.24%
Maturity date
Jan 8, 2035
US9247XAR2
BlackRock, Inc. 1.9% 28-JAN-2031Yield to maturity
4.20%
Maturity date
Jan 28, 2031
US9247XAQ4
BlackRock, Inc. 2.4% 30-APR-2030Yield to maturity
4.09%
Maturity date
Apr 30, 2030
BLK5767241
BlackRock, Inc. 4.7% 14-MAR-2029Yield to maturity
3.95%
Maturity date
Mar 14, 2029
US9247XAP6
BlackRock, Inc. 3.25% 30-APR-2029Yield to maturity
3.91%
Maturity date
Apr 30, 2029
BLK5852548
BlackRock, Inc. 4.6% 26-JUL-2027Yield to maturity
3.80%
Maturity date
Jul 26, 2027
See all BLQ bonds
Curated watchlists where BLQ is featured.


Frequently Asked Questions
Depending on the exchange, the stock ticker may vary. For instance, on FWB exchange BlackRock, Inc. Shs Unsponsored Canadian Depoitary Receipt Hedged Reg S stocks are traded under the ticker BLQ.
Yes, you can track BlackRock, Inc. Shs Unsponsored Canadian Depoitary Receipt Hedged Reg S financials in yearly and quarterly reports right on TradingView.
BLQ net income for the last quarter is 1.37 B EUR, while the quarter before that showed 1.39 B EUR of net income which accounts for −1.22% change. Track more BlackRock, Inc. Shs Unsponsored Canadian Depoitary Receipt Hedged Reg S financial stats to get the full picture.
No, BLQ doesn't pay any dividends to its shareholders. But don't worry, we've prepared a list of high-dividend stocks for you.
As of Oct 1, 2025, the company has 21.1 K employees. See our rating of the largest employees — is BlackRock, Inc. Shs Unsponsored Canadian Depoitary Receipt Hedged Reg S on this list?
EBITDA measures a company's operating performance, its growth signifies an improvement in the efficiency of a company. BlackRock, Inc. Shs Unsponsored Canadian Depoitary Receipt Hedged Reg S EBITDA is 8.05 B EUR, and current EBITDA margin is 41.37%. See more stats in BlackRock, Inc. Shs Unsponsored Canadian Depoitary Receipt Hedged Reg S financial statements.
Like other stocks, BLQ shares are traded on stock exchanges, e.g. Nasdaq, Nyse, Euronext, and the easiest way to buy them is through an online stock broker. To do this, you need to open an account and follow a broker's procedures, then start trading. You can trade BlackRock, Inc. Shs Unsponsored Canadian Depoitary Receipt Hedged Reg S stock right from TradingView charts — choose your broker and connect to your account.