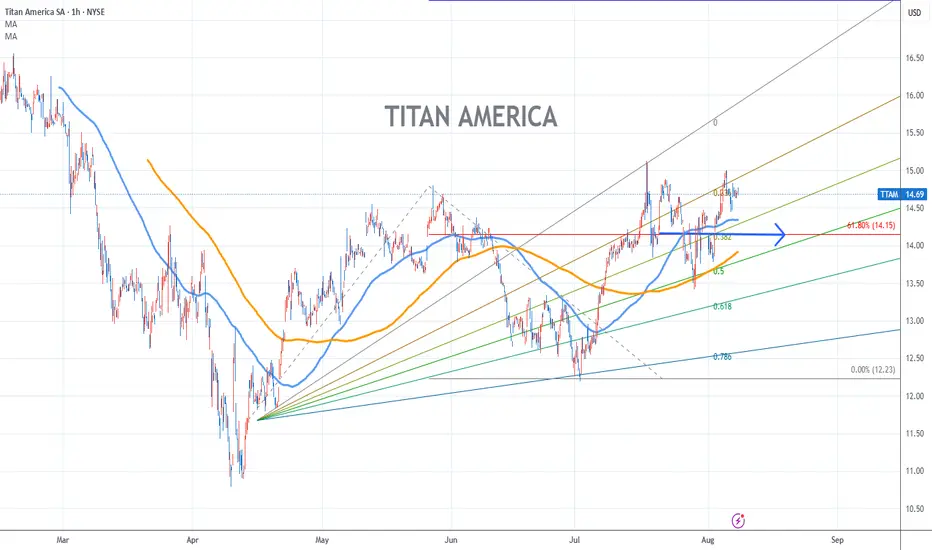
Titan America Stock Chart Fibonacci Analysis 080725Trading Idea
1) Find a FIBO slingshot
2) Check FIBO 61.80% level
3) Entry Point > 14.1/61.80%
Chart time frame:B
A) 15 min(1W-3M)
B) 1 hr(3M-6M)
C) 4 hr(6M-1year)
D) 1 day(1-3years)
Stock progress:A
A) Keep rising over 61.80% resistance
B) 61.80% resistance
C) 61.80% support
D) Hit the bottom
E
Next report date
—
Report period
—
EPS estimate
—
Revenue estimate
—
160.42 M EUR
1.58 B EUR
24.54 M
About Titan America SA
Sector
Industry
CEO
Bills Zarkalis
Website
Headquarters
Brussels
Founded
1902
ISIN
BE6360403164
FIGI
BBG01SGZSQK2
Titan America SA engages in the manufacturer and supplier of heavy building materials and services operating primarily on the Eastern Seaboard. It operates through the Florida and Mid-Atlantic geographical segments. The Florida segment consists of cement, aggregates, ready-mix concrete, concrete block, and fly ash operations within the State of Florida. The Mid-Atlantic segment includes cement, aggregates, ready-mix concrete, and fly ash operations throughout the Mid-Atlantic region, most concentrated in Virginia, North Carolina, South Carolina, New York and New Jersey, capable of serving surrounding states such as Maryland, West Virginia, Kentucky, Tennessee, Pennsylvania, Ohio, and Indiana areas with fly ash. The company was founded in 1902 and is headquartered in Brussels, Belgium.
Related stocks
Summarizing what the indicators are suggesting.
Neutral
SellBuy
Strong sellStrong buy
Strong sellSellNeutralBuyStrong buy
Neutral
SellBuy
Strong sellStrong buy
Strong sellSellNeutralBuyStrong buy
Neutral
SellBuy
Strong sellStrong buy
Strong sellSellNeutralBuyStrong buy
An aggregate view of professional's ratings.
Neutral
SellBuy
Strong sellStrong buy
Strong sellSellNeutralBuyStrong buy
Neutral
SellBuy
Strong sellStrong buy
Strong sellSellNeutralBuyStrong buy
Neutral
SellBuy
Strong sellStrong buy
Strong sellSellNeutralBuyStrong buy
Displays a symbol's price movements over previous years to identify recurring trends.
Frequently Asked Questions
The current price of IH9 is 12.4 EUR — it has decreased by −0.80% in the past 24 hours. Watch Titan America SA stock price performance more closely on the chart.
Depending on the exchange, the stock ticker may vary. For instance, on FWB exchange Titan America SA stocks are traded under the ticker IH9.
IH9 stock has fallen by −2.36% compared to the previous week, the month change is a −5.34% fall, over the last year Titan America SA has showed a −40.45% decrease.
We've gathered analysts' opinions on Titan America SA future price: according to them, IH9 price has a max estimate of 15.45 EUR and a min estimate of 11.59 EUR. Watch IH9 chart and read a more detailed Titan America SA stock forecast: see what analysts think of Titan America SA and suggest that you do with its stocks.
IH9 stock is 0.81% volatile and has beta coefficient of 0.69. Track Titan America SA stock price on the chart and check out the list of the most volatile stocks — is Titan America SA there?
Today Titan America SA has the market capitalization of 2.31 B, it has decreased by −6.32% over the last week.
Yes, you can track Titan America SA financials in yearly and quarterly reports right on TradingView.
Titan America SA is going to release the next earnings report on Dec 3, 2025. Keep track of upcoming events with our Earnings Calendar.
IH9 earnings for the last quarter are 0.24 EUR per share, whereas the estimation was 0.25 EUR resulting in a −5.30% surprise. The estimated earnings for the next quarter are 0.27 EUR per share. See more details about Titan America SA earnings.
Titan America SA revenue for the last quarter amounts to 364.38 M EUR, despite the estimated figure of 372.09 M EUR. In the next quarter, revenue is expected to reach 376.13 M EUR.
IH9 net income for the last quarter is 43.41 M EUR, while the quarter before that showed 30.85 M EUR of net income which accounts for 40.71% change. Track more Titan America SA financial stats to get the full picture.
Yes, IH9 dividends are paid quarterly. The last dividend per share was 0.07 EUR. As of today, Dividend Yield (TTM)% is 0.00%. Tracking Titan America SA dividends might help you take more informed decisions.
As of Sep 30, 2025, the company has 2.74 K employees. See our rating of the largest employees — is Titan America SA on this list?
Like other stocks, IH9 shares are traded on stock exchanges, e.g. Nasdaq, Nyse, Euronext, and the easiest way to buy them is through an online stock broker. To do this, you need to open an account and follow a broker's procedures, then start trading. You can trade Titan America SA stock right from TradingView charts — choose your broker and connect to your account.
Investing in stocks requires a comprehensive research: you should carefully study all the available data, e.g. company's financials, related news, and its technical analysis. So Titan America SA technincal analysis shows the sell today, and its 1 week rating is sell. Since market conditions are prone to changes, it's worth looking a bit further into the future — according to the 1 month rating Titan America SA stock shows the sell signal. See more of Titan America SA technicals for a more comprehensive analysis.
If you're still not sure, try looking for inspiration in our curated watchlists.
If you're still not sure, try looking for inspiration in our curated watchlists.