Tesla next months Unfortunate that market has pulled back over the last few weeks, otherwise this would have happened earlier. Pretty sure we see 500+ within the next 3 months or so.
I hope you enjoy the kid pencil.
Trade ideas

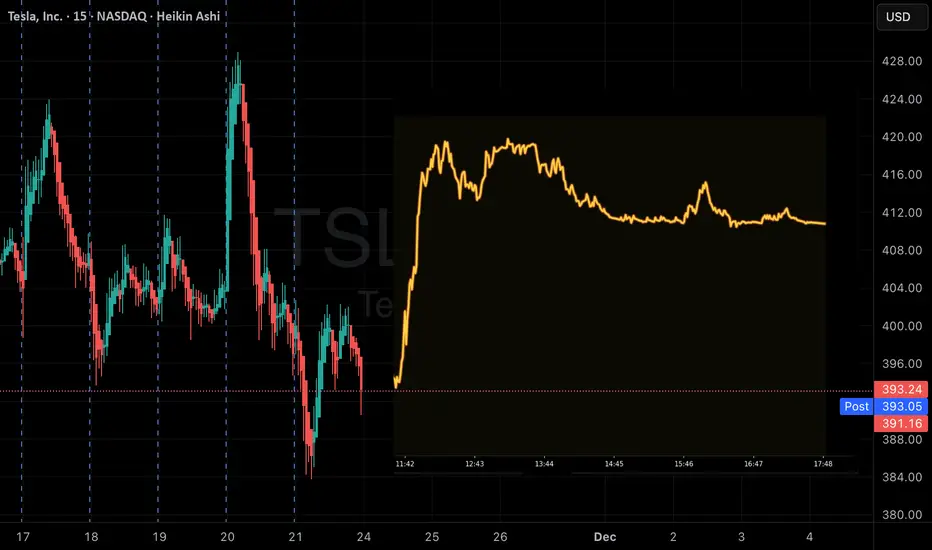
TSLA Momentum Play: QuantSignals V3 Sees Strong UpsideTSLA | QuantSignals Katy 1M Prediction (2025-11-21)
Current Price: $385.51
Predicted Close: $396.06 (+2.74%)
30-min Target: $393.15 (+1.98%)
Trend: Bullish
Confidence: 75%
Volatility: 27.4%
Trade Signal
Direction: CALL
Entry: $385.51
Target: $393.95
Stop Loss: $379.73
Expected Move: +2.74%
Summary: 1 trade signal generated from 1 successful analysis.
TSLA Market Preview – December 5TSLA is pushing into a major decision zone after a strong multi-day run. The structure is clean: higher highs, higher lows, and a steady grind along the rising trendline. But price is now pressing directly into a heavy supply area that has rejected TSLA multiple times in the past. The next move will be defined by whether buyers can absorb this overhead liquidity.
Structure Overview (1H)
The broader trend remains bullish. Buyers have been in control since reclaiming the $430s, and momentum has carried price straight into the $452–456 supply block — the same zone where sellers previously stepped in aggressively. TSLA is also riding a rising channel, and price is now hovering right at the upper trendline.
This is typically where you see either a breakout continuation… or the start of a pullback.
Below, the key demand sits at $445 → $438, with a deeper pocket near $424. These zones align with strong accumulation footprints and are where institutions previously positioned themselves.
Short-Term View (15M)
The 15M chart shows a clean BOS earlier in the day, followed by a controlled consolidation right under resistance. That’s what you usually see before one more push. But the red SMC sell zone overhead is rejecting each attempt to break through — that is the first sign of exhaustion.
You also have a CHoCH forming underneath, meaning the market is hinting at a shift in short-term momentum. If TSLA loses the 15M trendline, that shift becomes official and sellers will have the upper hand.
GEX Outlook for Tomorrow
Gamma tells a very simple story:
* Major CALL resistance / positive GEX: $455–$460
* Neutral magnet zone: $448–$452
* PUT support: $445 → $438 → $424
Dealers are positioned in a way that limits clean trending movement unless price escapes these ranges. A push above $456 could squeeze toward $460–462, but rejection here would force price back toward the magnet zone at $448–452.
What I Expect for Dec 5
My outlook leans neutral-to-bearish unless TSLA proves it can break and hold above $456. The move has been extended, momentum is slowing, and we’re sitting at the most crowded liquidity layer on the chart.
If buyers want higher, they must show:
* A clean breakout → retest → hold above $456
* Strong volume through the supply block
* A new BOS on lower timeframes to confirm continuation
If sellers take control:
* Losing the rising trendline opens the door to $448
* Below that, $445 becomes the first real bounce zone
* Deeper pullback targets sit at $438 and $424
Trade Thoughts
If bullish:
The only setup worth taking is the break and hold above $456, with room toward $460 → $462.
If bearish:
The best risk-reward is a rejection play from $454–$456, aligning with the SMC sell zone and GEX resistance.
Targets: $448 → $445 → $438 if momentum accelerates.
Avoid taking trades in the middle of the range — that’s where TSLA will chop.
Disclaimer
This outlook is for educational purposes only. It reflects personal analysis and opinions based on price action, structure, and GEX data. Always trade your own plan and manage risk carefully.

TSLA shortLooks like Tesla is grabbing its ATH and then claims the downside liquidity to grab the higher stars afterwards ;) <3
Trade save!

Catching Trends Before They Run — JYL Trend Pro V1.0 BETA 1. What is JYL Trend Pro V1.0 BETA?
JYL Trend Pro is my personal trend‑following strategy built around a proprietary state engine I call JYL Trend.
Instead of staring at raw price bars and guessing “is this a real trend or just noise?”, the script translates price action into a clear sequence of states like:
“GO!” → first confirmation that a potential new long trend is starting
“GREEN LIGHT” → healthy bullish continuation
“BULLISH!” → aggressive momentum phase
“WATCH OUT!” → first warning that bullish conditions might be ending
“RED LIGHT” → sustained bearish pressure
“BEARISH!” → aggressive downside momentum
All of this happens automatically in the background. You don’t need to calculate anything or tweak formulas — you just read the states and trade your playbook.
Screenshot:
1drv.ms
1drv.ms
2. The 3 Modes: Stable / Impulsive / IMP+
JYL Trend Pro V1.0 BETA actually contains three personalities in one strategy.
You can switch between them with a single input depending on your style and market conditions.
🧊 2.1 Stable – “Let the trend breathe”
Stable mode is built for traders who prefer cleaner, slower signals:
Focus on the first strong trend confirmation (first “BULLISH!” or “BEARISH!” segment)
Avoids over‑trading inside choppy ranges
Takes partial exits when the trend starts weakening
Fully closes when the color flips (bullish → bearish or vice versa)
This is the “I don’t want to click too much, just ride the move and manage risk” profile.
⚡ 2.2 Impulsive – “Hit the gas when momentum appears”
Impulsive mode is more aggressive:
Allows earlier entries when the trend starts to accelerate
Adds to positions when new strong segments appear
Uses quick “fast exits” when the trend loses steam
Still keeps a safety net: color‑flip exits to avoid being stuck on the wrong side
If Stable is your cruise control, Impulsive is you manually stepping on the gas when you see an opportunity.
🚀 2.3 IMP+ – “Advanced scaling & risk logic on top of Impulsive”
IMP+ takes Impulsive logic and adds an advanced layer of:
Configurable early entries in strong moves (for traders who want a bit more “front‑running” of trends)
Smart adds inside the continuation zone
-After the BULLISH! / BEARISH! impulse, IMP+ looks for a specific type of continuation candle to add
-If you added early, it will skip the later add to avoid over‑leveraging the same move
Dynamic partial exits after big segments
-Scales out more as the move stretches, so you lock in profit without killing the entire trend
Open‑to‑open exhaustion exits
-After a strong trend leg (BULLISH! or BEARISH!), if the next candle opens too close to the previous one (configurable packages), IMP+ can treat it as exhaustion / hesitation and close the position — before the big reversal happens
In short: IMP+ is for traders who want the most “tactical” behavior — early entries, structured scaling, and more nuanced exit logic — while still being rules‑based, not discretionary.
3. How I Personally Use It
Everyone’s risk tolerance and timeframe are different, but here’s how I like to combine the modes:
On higher timeframes (4H / Daily):
→ I usually prefer Stable to catch the big swings and avoid noise.
On intraday momentum names:
→ I lean toward Impulsive or IMP+ to enter earlier and scale more actively.
When markets are clearly trending:
→ IMP+ is my “all tools unlocked” mode: early entries, adds after strong legs, and dynamic profit taking.
The trade direction filter lets me choose:
Only LONG
Only SHORT
Or both directions (for indices / futures / FX etc.)
That makes it flexible for different instruments and market regimes.
4. What this strategy is not
To keep this idea honest & within TradingView’s rules:
It is not a holy grail
It does not guarantee profit
Backtests do not equal future performance
You still need position sizing, risk management, and a plan
JYL Trend Pro is simply a framework that:
Structures entries (initial + adds)
Structures exits (partial + full)
Gives you consistent rules instead of emotional decisions
5. How to try it
This is the JYL Trend Pro V1.0 BETA version.
The strategy is available on TradingView as a protected / invite‑only script.
If you’d like to:
See how the different modes (Stable / Impulsive / IMP+) behave on your favorite tickers
Study the entry / add / reduce / exit logic on historical moves
Or just explore a different way to visualize trend sequences (“GO! / GREEN LIGHT / BULLISH! / WATCH OUT! / RED LIGHT / BEARISH!”)
👉 Check my profile for the script and more details.
If this idea helps you or gives you inspiration, I’d really appreciate a like, comment, or follow — it tells me to keep sharing more tools and improvements.
Trade safe & test everything before going live. 🙏

TSLA — [2D] WEEK 49 TREND REPORT | 12/04/2025TSLA — WEEK 49 TREND REPORT | 12/04/2025
Ticker: NASDAQ:TSLA
Timeframe: 2D
This is a reactive structural classification of TSLA based on the weekly chart as of this timestamp. Price conditions are evaluated as they stand — nothing here is predictive or forward-assumptive.
⸻
1) Current Trend Condition [ Numbers to Watch ]
Current Price @ 447.66$
• Trend Duration : +7 Days (Bullish)
• Trend Reversal Level ( Bearish ): 418.70$
• Trend Reversal Level ( Bearish Confirmation ): 428.42$
• Pullback Support : 413.70$
• Correction Support : 354.94$
⸻
2) Structure Health
• Retracement Phase:
Uptrend (operating above 78.6%)
• Position Status:
Healthy (price above both structural layers)
⸻
3) Temperature :
Warming Phase
⸻
4) Momentum :
Bullish
⸻
Author’s Note
UPWARD STRUCTURAL ALIGNMENT
This mark reflects a point where market behavior supported the continuation of the existing upward direction. It does not imply forecasting or targets — it simply notes where strength became observable within the current trend. Its meaning holds only while price continues to respect the broader structural levels that define the trend.
⸻
Methodology Overview
This classification framework evaluates directional conditions using internal trend-interpretation logic that references price behavior relative to its structural layers. These relationships are used to identify when price movement aligns with the framework’s criteria for directional phases, transition points, or regime shifts. Visual elements or structural labels reflect these internal interpretations, rather than explicit trading signals or preset indicator crossovers. This framework is observational only and does not imply future outcomes.

TSLA: The Super Lucrative Asset = Teslacmp : 446.74
This is under supply zone but above 417 : No major sellers will be sold their Qty.
according to chart.
Breaker Block above 465 if break and sustain it will be for next 534 Levels
SL : 415
Manage your Risk and Long view

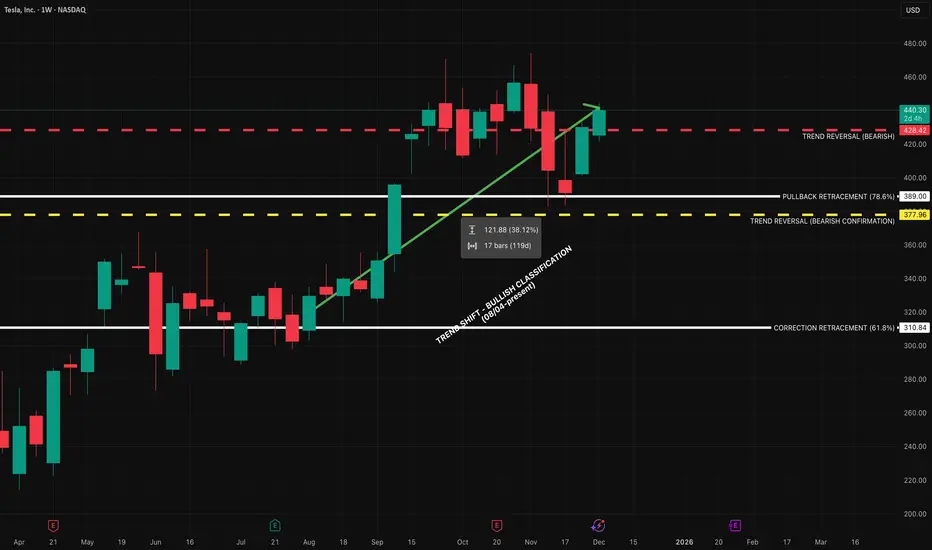
TSLA — WEEK 49 TREND REPORTTSLA — WEEK 49 TREND REPORT
Ticker: NASDAQ:TSLA — 12/03/2025 @ 440.31$
Timeframe: WEEKLY
This is a reactive structural classification of TESLA based on the weekly chart as of this timestamp. Price conditions are evaluated as they stand — nothing here is predictive or forward-assumptive.
⸻
1) Current Trend Condition
• Trend Duration: +17 weeks (Bullish)
• Trend Reversal Level (Bearish): 428.42$
• Trend Reversal Level (Bearish Confirmation): 377.96$
• Pullback Support : 389$
• Correction Support : 310.84$
⸻
2) Structure Health
• Retracement Phase:
Uptrend (operating above 78.6%)
• Position Status:
Healthy (price above both structural layers)
⸻
3) Temperature :
Cooling Phase
⸻
4) Momentum :
Bullish
⸻
5) Market Sentiment (RETAIL TRADER LINE)
Bullish
⸻
Author’s Note
This analysis is fully reactive, not predictive. Market conditions, trend structure, and behavior are classified as they appear in real time. The objective is to identify where directional shifts first occurred, where structural integrity remains intact, and where it would begin to weaken if key levels were breached.
Predictive analysis projects outcomes that do not exist yet. Without price confirmation, prediction is built on baseless assumptions. This framework avoids that entirely by responding only to verified structural changes and live conditions.
The levels shown simply identify where the current trend structure first shifted and where it would begin to lose integrity if breached. Recognizing these boundaries allows for clearer interpretation of market behavior without relying on forward guarantees, speculative projections, or unsupported assumptions.
⸻
Methodology Overview
This classification framework evaluates directional conditions using internal trend-interpretation logic that references price behavior relative to its structural layers. These relationships are used to identify when price movement aligns with the framework’s criteria for directional phases, transition points, or regime shifts. Visual elements or structural labels reflect these internal interpretations, rather than explicit trading signals or preset indicator crossovers. This framework is observational only and does not imply future outcomes.
TSLA Breakout Above $360 Opens Swing Trade SetupTesla broke the $360 resistance four days ago, a level that had been holding price down for the last 120 days. Once broken, price surged quickly toward the $420 zone.
In my view, if we get a chance to buy again near the 370 green support zone, it would be a great swing trade opportunity — especially with the rising trendline still intact.
🔍 Technical Analysis
Current Price: 420.95
360 acted as resistance for months, now flipped to strong support.
Green zone (360–375) aligns with the uptrend, key area to watch for re-entry.
🛡️ Support & SL
🟢 370 zone | SL: 345
🧭 Outlook
Bullish Case: Hold above 370 → continuation toward 450–475.
Bearish Case: Break below 345 → deeper correction.
Bias: Bullish while above 370.
🌍 Fundamental Insight
Valuation: Tesla trades at a relatively high P/E ratio (60–70 range) compared to traditional automakers, reflecting growth expectations rather than current earnings.
Revenue Growth: While margins have compressed due to price cuts, top-line growth remains supported by strong EV demand and expansion in new markets.
Innovation & AI: Tesla’s positioning in AI, autonomous driving, and energy storage continues to attract investor optimism beyond just vehicle sales.
Risks: Competition from other EV makers and margin pressure are key risks investors are watching.
✅ Conclusion
Tesla’s breakout above 360 ended months of pressure. A pullback into the green support zone would be a strong swing entry with trendline confluence. While valuation is stretched versus peers, bullish momentum and growth expectations continue to support the stock.
⚠️ Disclaimer
This analysis is for educational purposes only and does not constitute financial, investment, or trading advice.

TSLA: Hold or SellHello Traders,
Regarding the technical point of view!
Telsa have been previously overbought. there are two resistances on its way! 1st the dynamic and 2nd the static one!
A triangle shape has been formed!
If you have it right now, I'm more with keeping it!
But you may find more profitable stocks to buy!

Venture Capital’s Global Impact1. Driving Global Innovation
At its core, venture capital exists to fund innovation. VC firms invest in early-stage businesses that have high growth potential but also high risk—companies that traditional banks or lenders would rarely touch.
This willingness to fund experimentation has brought to life some of the world’s most transformative technologies:
The internet and search engines
Smartphones and mobile applications
Artificial intelligence and machine learning
Electric vehicles and clean energy
Biotechnology and precision medicine
E-commerce and fintech platforms
Without venture capital, many of the revolutionary companies we know today—Google, Facebook, Tesla, Uber, Alibaba, Shopify, and countless others—might never have scaled globally. VC acts as the financial fuel behind groundbreaking ideas, enabling startups to test, iterate, and expand at lightning speed.
2. Boosting Economic Growth and Job Creation
One of the most measurable global impacts of venture capital is economic expansion. VC-backed companies consistently outperform traditional businesses in terms of job creation, revenue growth, and market expansion.
Key economic contributions include:
2.1 Employment Generation
Startups supported by venture capital create millions of high-skill jobs across software development, research, engineering, marketing, and operations. These companies often become large-scale employers once they scale, contributing significantly to national employment figures.
2.2 Creation of New Industries
Entire industries—like ride-sharing, cloud computing, online education, and fintech—were built on VC funding. These sectors not only generate direct jobs but also create large support ecosystems.
2.3 Attracting Global Investments
Countries with strong VC ecosystems attract foreign investors, multinational corporations, and global funds. This strengthens the balance of payments and increases capital inflows.
3. Increasing Global Competitiveness
Venture capital plays a crucial role in helping nations remain competitive in the global innovation race. Countries with robust VC networks—such as the U.S., China, India, Israel, the U.K., and Singapore—are also leaders in cutting-edge technology.
3.1 Encouraging Entrepreneurship
VC fosters a culture where innovation is rewarded, raising the confidence of entrepreneurs to take risks and build new enterprises.
3.2 Commercialization of Research
Universities and research centers often commercialize their technology through venture funding. This bridges the gap between academic research and real-world application, making scientific discoveries accessible to industries.
3.3 Regional Development
In many countries, venture capital helps geographically underdeveloped regions grow by funding startups, incubators, and innovation clusters. Examples include:
Bangalore, India
Shenzhen, China
Tel Aviv, Israel
Berlin, Germany
São Paulo, Brazil
These cities became global tech hubs primarily because venture capital supported entrepreneurs and attracted international talent.
4. Supporting Technological Advancement and Transformation
Technology evolves at a rapid pace, and venture capital ensures that the world keeps moving forward. VC firms not only provide money—they bring mentorship, strategic planning, and global networks that help startups commercialize their innovations.
4.1 Accelerating Disruptive Technologies
VC funding pushes forward technologies such as:
Artificial intelligence
Blockchain and Web3
Robotics and automation
Green energy and sustainability
Space technology
Biotech and genomics
By taking early risks, VC funds encourage breakthroughs that later become everyday tools.
4.2 Redefining Traditional Industries
Venture-backed startups are transforming traditional sectors:
Fintech is reshaping banking.
Edtech is revolutionizing education.
Healthtech is changing medical diagnostics and treatment.
Agri-tech is improving farming efficiency.
Clean-tech is transforming energy and climate solutions.
This disruption leads to greater efficiency, lower costs, and improved services worldwide.
5. Strengthening Global Entrepreneurship Ecosystems
Venture capital has a multiplier effect on entrepreneurship. As startups succeed, founders often reinvest capital and experience into newer ventures, creating a self-sustaining cycle.
5.1 Success Stories Inspire Future Innovators
Global VC successes have encouraged millions to start businesses of their own.
Examples:
Silicon Valley unicorns influenced entrepreneurship in Europe and Asia.
India’s startup boom accelerated after Flipkart and Paytm gained global recognition.
China’s tech giants like Tencent and Alibaba inspired an entire generation of Chinese entrepreneurs.
5.2 Growth of Startup Support Networks
VC involvement leads to the development of:
Incubators
Accelerators
Angel networks
Innovation labs
Entrepreneurial universities
This infrastructure builds long-lasting entrepreneurial ecosystems.
6. Encouraging Globalization and Cross-Border Economies
Venture-capital-backed startups often expand internationally faster than traditional companies. This creates a more connected global marketplace.
6.1 Cross-Border Investments
VC firms frequently invest across borders. U.S. VC firms invest in India, China, and Europe; Asian firms invest in Africa and Latin America. This makes capital global and accessible.
6.2 International Market Expansion
Startups scale globally using VC networks, entering multiple continents in just a few years. This globalization drives economic integration, technology exchange, and cultural connectivity.
6.3 Knowledge Transfer
VC-backed companies bring global expertise—operational strategies, product design, marketing models, and technological know-how—to developing markets.
7. Supporting Social and Environmental Change
In recent years, venture capital has expanded beyond purely profit-driven investments. Many funds now prioritize impact investing, focusing on startups that solve global challenges such as:
Climate change
Renewable energy
Clean mobility
Healthcare access
Food security
Education for all
Impact-driven venture capital is driving innovation in sectors essential for sustainable global development.
8. Creating Wealth and Financial Growth
Venture capital has created massive wealth for founders, investors, and employees. This wealth, in turn, fuels new businesses and supports economic development.
8.1 Building Billion-Dollar Companies
Unicorn startups—those valued at over $1 billion—have become common worldwide. They drive national GDP growth and attract new investments.
8.2 Stock Market Growth
Many venture-backed companies go public through IPOs, contributing to stock market expansion and providing investment opportunities for the broader population.
Conclusion
Venture capital’s global impact extends far beyond funding startups. It is a powerful driver of innovation, economic growth, job creation, global competitiveness, and societal transformation. Through risk-taking and visionary investment, VC has shaped modern technology, transformed industries, and accelerated global development. As the world continues to evolve, venture capital will remain at the forefront of unlocking new opportunities and pushing the boundaries of what is possible.

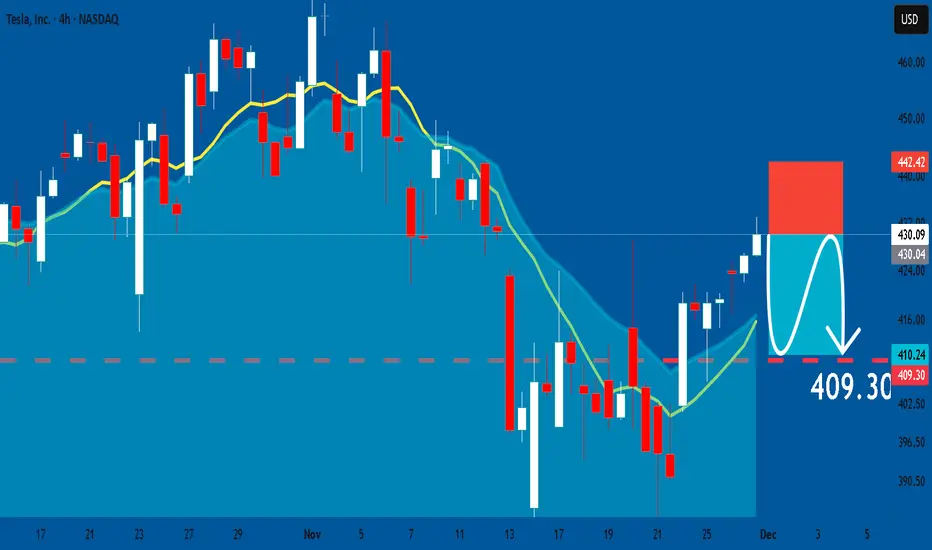
TESLA: Short Signal with Entry/SL/TP
TESLA
- Classic bearish setup
- Our team expects bearish continuation
SUGGESTED TRADE:
Swing Trade
Short TESLA
Entry Point - 430.09
Stop Loss - 442.42
Take Profit - 409.30
Our Risk - 1%
Start protection of your profits from lower levels
Disclosure: I am part of Trade Nation's Influencer program and receive a monthly fee for using their TradingView charts in my analysis.
❤️ Please, support our work with like & comment! ❤️
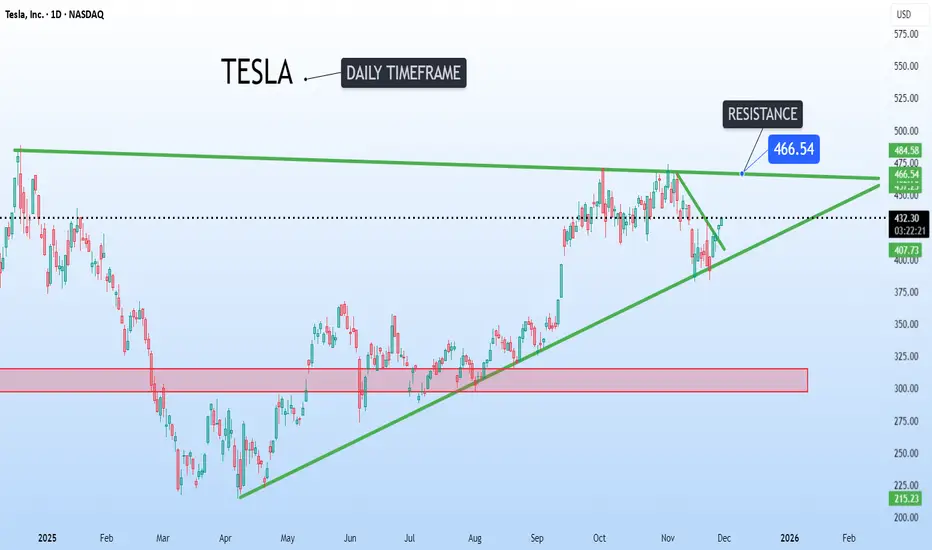
Tesla bouncing from strong supportTesla NASDAQ:TSLA is about to get wild, this daily chart is showing a huge squeeze.
The stock is bouncing perfectly while building pressure right under the big $466 ceiling.
If it can bust through that resistance, we're talking about a serious rocket ride up to new highs.
TSLA ... From darling to toxic exThere is nothing to debate.
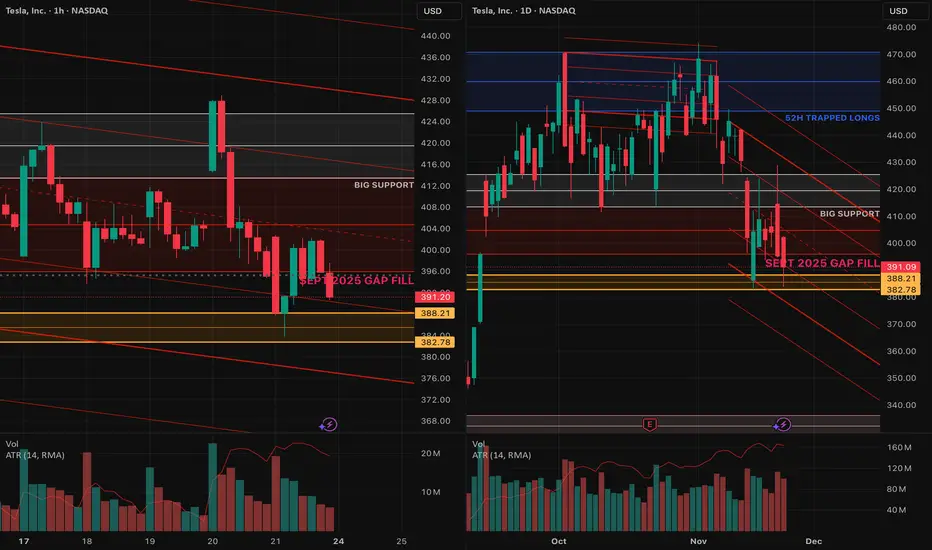
PWL at 382.78–388.21 must hold, or buyers get steamrolled. We’re trading below the 50-day on the daily, and any strength is likely to be sold into. I hate leaning this bearish, but if there’s going to be a short-term bounce, it *starts* with the PWL holding. With heavy overhead supply near 400, this is not a name where you want to be the early hero.
If the PWL breaks, downside opens to the 200-day near 338 or the beige pocket between 328–336.
Negative headwind:
Forget Musk's latest pay package, his last one could wipe out years of Tesla profits
By Chris Kirkham
www.reuters.com
TSLA SELL++++ $360-370 to be testedAs I posted last week, and, clearly too early TSLA needs to test the $370 range where it broke out from. I do pat myself on the back for the epic bounce off support at $324.80 that needed to hold to see $426's and TSLA always goes further then we think both ways. We're way overdone and todays reversal shows it. $370's imminent in coming weeks

Nasdaq 100, Tesla and Apple OutlookWall Street is on the verge of closing lower for a third week for the first time in eight months. I explain why I think there could be further losses ahead, why Tesla (TSLA) is a preferred short setup and why to keep an eye on Apple (AAPL).
Matt Simpson, Market Analyst at City Index

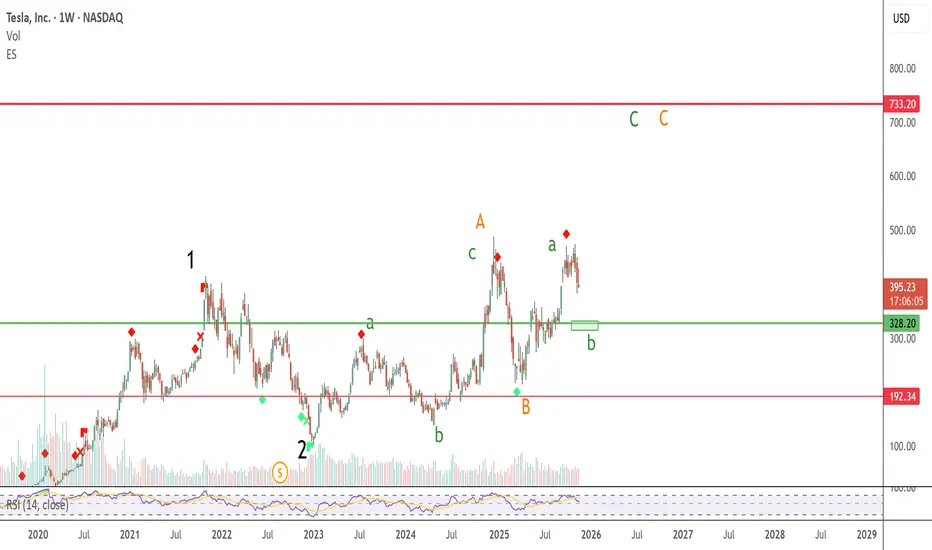
Tesla's curious caseTesla has always been a volatile stock but since 2021, it has forever been under corrective wave strcuture. Its not the typical corrective structure where the prices only go down, but it's a combination of large scale Zigzag and inverse Zigzag.
The current corrective wave will end between 320-328 and then again an upmove journey will begin heading towards 733 mark ( exact number to be confirmed once uptrend starts.
Be on the watch out for entering at 325.
sell tslatsla printed a beautiful double top. tsla price broke down highlited price range, retested it and is came back down again, sell here, tsla is now super bearish... it will likely lead an upcoming sell-off in stocks.

QuantSignals V3 TSLA Alert: Strong Bearish MomentumTSLA 1M | QuantSignals Katy | 2025-11-20
Direction: PUT (Bearish)
Confidence: 75%
Current Price: $427.76
Final Target: $411.82 (-3.73%)
30min Target: $419.17 (-2.01%)
Entry: $427.76
Take Profit: $415.01
Stop Loss: $434.18
Volatility: 24.9%
Analysis:
Katy AI predicts steady bearish movement over the month.
Momentum favors downside, with 1M horizon showing consistent decline.
Strong confidence (75%) and moderate volatility suggest high-probability put setup.
Trade Setup & Edge:
Entry aligns with current price at resistance level.
Tight stop limits risk while capturing projected downside.
Short-term 30-min target gives early exit option if quick profit is desired.
⚠️ Risk Warning: Moderate volatility; adjust position size accordingly.
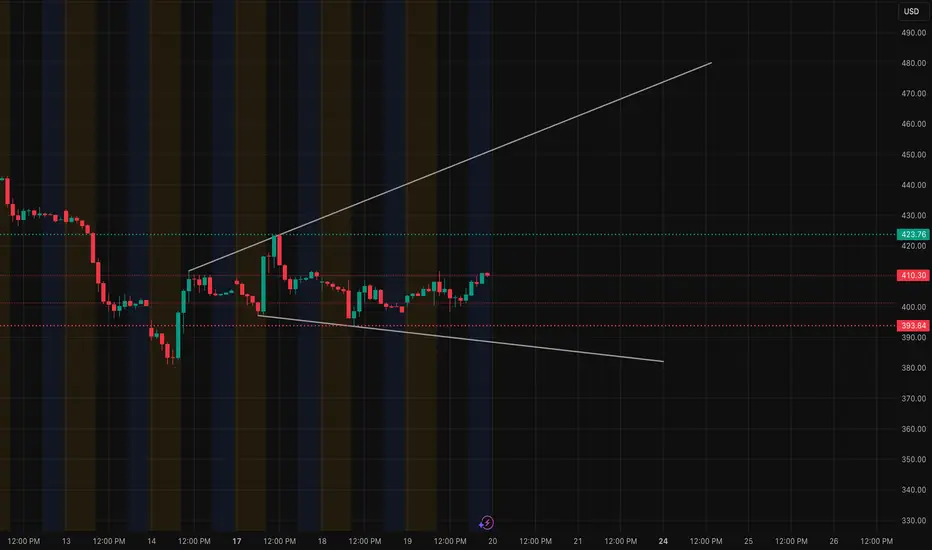
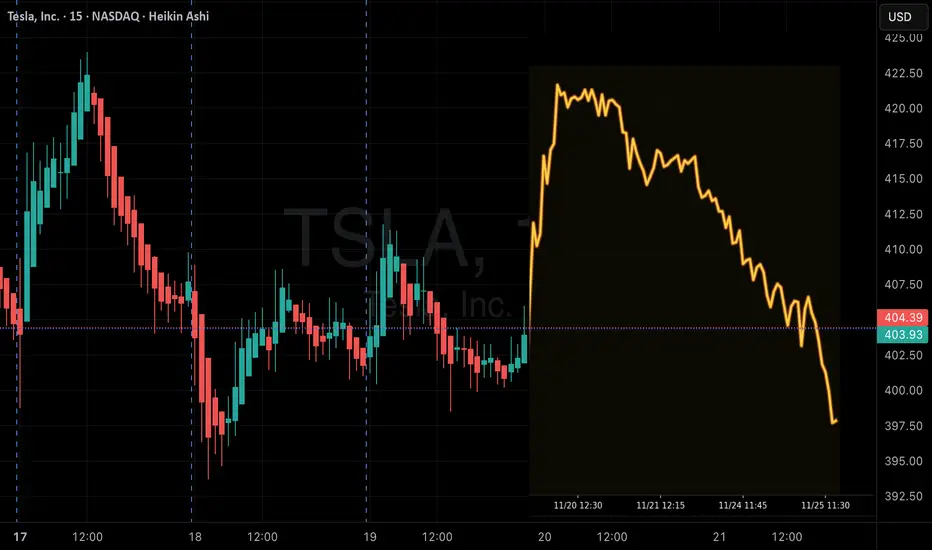
Tesla (TSLA) – Key Levels Tightening Up Ahead on Nov. 20TSLA is coiling inside a clean rising wedge on the 1H and 15M charts. Price is grinding toward the apex with buyers slowly stepping in, but sellers are still defending the 410–415 zone. This tension usually leads to a breakout move, up or down, depending on how the opening momentum comes in.
Tomorrow, traders will be watching TSLA because it’s sitting right at the intersection of trendline pressure + GEX walls — perfect setup for volatility.
1. 1H Timeframe – Bigger Picture
* TSLA is trapped between 395 support and 410–415 resistance.
* The rising wedge support is doing its job. Every dip into 395–398 gets bought.
* If TSLA clears 415, it can quickly push toward 422–425, then 430.
* If it rejects again, the wedge breaks down toward 400, then 390.
What matters:
This structure is tight. A move outside the wedge tomorrow will set direction for the next 2–3 sessions.
2. 15M Timeframe – Intraday Setup
* Strong BOS + CHoCH stack that reversed the downtrend earlier today.
* Price is now retesting the mid-range around 410.
* Bears are active at 410.30–411.50 (multiple rejections).
* Bulls defending the 401–402 block and 398–400 FVG zone.
If buyers hold 401–402:
TSLA can attempt 415 → 422.
If sellers break 398:
Expect a fast unwind toward 390–392.
The 15M gives the intraday trigger for the bigger 1H structure.
3. GEX / Options Sentiment – Confirms the Levels
This is the clean part:
* Highest positive GEX resistance at 422–425.
Options dealers hedge aggressively there → hard ceiling unless volume comes in.
* 410 is the HVL zone — right where price is stuck.
This level often acts like a magnet and chop zone.
* Below price, 400 / 395 / 390 are stacked with negative GEX →
this acts like put support. Traders love to take premium here.
What this means:
GEX supports the same ranges the chart shows:
* Above 415 → clear air pockets toward 422–425.
* Below 400 → air pocket toward 390.
Trading Outlook for Nov 20
Bullish Scenario
* Needs to reclaim 415 with strength.
* First target: 422
* Next target: 425–430
* Momentum confirmation: volume spike + 15M BOS continuation.
Bearish Scenario
* Lose 398–400, preferably on a breakdown during first 15–30 minutes.
* Target: 390–392
* Next: 382 (deep range sweep)
Neutral / Range
* If price sits between 402–410, expect chop.
* This is where most retail gets trapped.
Probability Summary (Not Signals)
* Breakout above 415: moderate probability if NASDAQ is strong.
* Reject & fade into 400: high probability if SPY pulls back.
* Chop 402–410: base case until macro gives direction.
Final Note
Everything lines up cleanly across 1H, 15M, and GEX — the exact setup traders search for before a trend day. TSLA will be heavily watched tomorrow because whichever side wins this 410 battle will control the next big move.
Tesla Is Moving Toward a Key Support ZoneHello everyone, Tesla is entering a sensitive phase as the strong rally from 310 USD to 406 USD over the past two months begins to lose momentum. The recent decline is not just a normal pullback; the repeated appearance of red FVGs shows that buying pressure is fading while sellers are gradually taking control again. At the moment, the 401 USD level is acting as the nearest support. If this area fails to hold, Tesla could slide further toward 395 USD — a zone with green FVGs and heavy volume where strong buying previously pushed the price upward.
On the fundamental side, the news flow isn’t helping. Tesla’s Q3/2025 report showed adjusted profits dropping nearly 29% even though revenue still grew around 12%, indicating that operational efficiency is weaker than expected. Rising costs, lower income from regulatory credits, and massive investments in AI and robotics continue to squeeze margins. At the same time, competition from Chinese and European EV manufacturers is intensifying, putting additional pressure on Tesla’s future market share. With the broader tech market shifting toward a risk-off mood, growth stocks are taking heavier hits — and Tesla is clearly feeling that weight.
Given both technical structure and market sentiment, the most reasonable scenario right now is a continued move down into the 395 USD support zone to test liquidity and gauge the market’s reaction. This level remains a strong technical area and could trigger a meaningful bounce if buyers step in. However, if 395 USD breaks under negative news or persistent outflows from growth assets, the decline could extend toward 385–380 USD. On the flip side, if a major positive catalyst appears — such as notable progress in robotaxi development, better margins, or a breakthrough in battery technology — the 405–410 USD region would be the first recovery target.
For now, Tesla is standing at a “pivot zone” — a place where the market will soon reveal whether this is just a pause before another upward leg, or the beginning of a deeper corrective cycle.

QuantSignals V3 | TSLA High-Probability Weekly PUT TradeTSLA QuantSignals V3 – Weekly PUT Trade (2025-11-19)
Trade Signal:
Direction: BUY PUTS (Short)
Strike Price: $402.50
Entry Range: $8.35–$8.45 (mid $8.40)
Target 1: $12.60 (50% gain)
Target 2: $16.80 (100% gain)
Stop Loss: $5.88 (30% risk)
Expiry: 2025-11-21 (2 days)
Position Size: 3% of portfolio
Confidence: 65% (Medium)
Market Analysis:
Trend: NEUTRAL overall, short-term bearish bias (-0.67% predicted decline)
Price Action: Current $401.88, trading below VWAP $406.38
Technicals: EMA bearish, weekly momentum neutral (-0.61%), key support $380.97, resistance $432.75
Options Flow: Put/Call Ratio 1.39, institutional put-heavy positioning
Volatility: Rising VIX (19.83 vs 18.44 avg) indicates increasing market nervousness
News Sentiment: Mixed; positive news not lifting price, sector skepticism present
Competitive Edge:
Katy AI downside prediction combined with strong bearish options flow and technical weakness
$402.50 strike balances risk/reward near-the-money
Mid-week entry captures potential late-week volatility
Tight stop loss mitigates gamma risk
Risk Notes:
2-day expiry creates high gamma and time decay risk
Rising VIX may increase premiums but also volatility
Moderate conviction requires careful position sizing
Monitor actively through expiration
What are these "algorithms" I'm always talking about?I talk a lot about “ algorithms ” - but for newer followers, it can feel abstract or confusing.
This video breaks down the core logic behind how I analyze any chart and tell a story to set up for the best possible trade.
Here I discuss:
- What is liquidity
- How the market builds liquidity
- Why certain movements/patterns repeat with accuracy
- How tapering, liquidity, and the basics of supply and demand form algorithmic behavior
If you want to understand the power behind the charts I show every day, this is for you.
(It's difficult to do this in a 10 minute video - which is why I have students who I work with one-on-one to dive deeper into learning this process. I don't sell myself or a course - I simply want you all to learn something that is truly helpful and beautiful. I post everything I know on here as often as I can!)
Happy Trading :)
