$TSM 47.6% Undervalued—Strong Earnings Amid Semi Demand?TSM – Financial Performance & SWOT Analysis
NYSE:TSM 47.6% Undervalued—Strong Earnings Amid Semi Demand?
(1/9)
Good morning, folks! TSM is surging 🚀, at $ 288.47 up 45.04% YTD per October 02, 2025. Earnings beats shake up this semiconductor play, let’s dive in! 📊🔥 Tag a friend who needs this investing hack!
(2/9) – PRICE PERFORMANCE
• Last week: $ 288.47, up from $ 279.29 close 📈
• YTD 2025: up 45.04%, outpacing S&P 500 🔄
• Q2 2025: revenue growth strong, boosting momentum 🚀
This semiconductor stock’s volatility? Earnings pops! 💥
(3/9) – MARKET POSITION
• Market Cap: $ 1.496T, global chip leader 🏆
• Avg Volume: 11.49M shares, high liquidity 💧
• Trend: 47.6% below fair value estimates 👑
This asset’s dominance? Holding tight! 🔒
(4/9) – KEY DEVELOPMENTS
• Q2 earnings: 60% profit jump on AI demand 💰
• Upcoming Q3 report: Oct 16, expected strong 🏭
• Global gains: tied to semi demand surge 📈
This semiconductor push? Demand driven! ⚡
(5/9) – RISKS IN FOCUS
• Demand fluctuations: semi cycles ⚠️
• Geopolitical tensions: supply chain hits 🆚
• Volatility: beta 1.22 swings 📉
This ticker’s exposure? Watch these twists! ⚠️🔄
(6/9) – SWOT: STRENGTHS
• AI chip leadership: high demand 🌟
• Advanced tech (3nm/2nm): edge over rivals 🤖
• Global fab network: scale advantage 👥
This asset’s core? Built tough! 💪
(7/9) – SWOT: WEAKNESSES & OPPORTUNITIES
• Weaknesses: Taiwan risks, capex heavy ⚖️
• Opportunities: AI boom, EV/chip expansion 🌍
Can this ticker beat the odds? 🎲 Reply with your take!
(8/9) – POLL TIME!
TSM’s $ 288.47 climb—your vibe?
• Bullish: $325+ soon, earnings beats 📈🚀
• Neutral: Steady, risks in check ⚖️🛡️
• Bearish: $250 looms, demand slowdown 📉⚠️
Chime in below! 💬 Tag a friend for this poll!
(9/9) – FINAL TAKEAWAY
TSM’s $ 288.47 surge shows strength 💪, demand fuels it ⚡. Risks bite 🦈, yet dips are DCA gold 💎. We grab ‘em low, climb like pros! Gem or bust? See dcalpha.net for our algorithm edge, not advice, just our spin!
#TSM #Investing #Markets #Trading #Finance #ETF #Commodities #DCA #Trends
Demystifying TSM's Volatility into Gains
TSM is undervalued as of October 02, 2025, at $ 288.47, up 45.04% YTD per Yahoo Finance. Strong earnings shape its path in the semiconductor space.
**Financial Performance**
Price Movement: YTD at $ 288.47, up 45.04%. Broader period shows gains amid global stocks, outpacing benchmarks. Q2 adds upside, with 60% profit jump.
Volume & Market Cap: Avg volume 11.49M shares. Market cap at $ 1.496T.
Key Metric: PE ratio 29.86, balanced multiples.
**SWOT Analysis**
Strengths:
- Leadership in AI and advanced chips.
- Strong earnings from HPC demand.
- Global manufacturing scale.
Weaknesses:
- Geopolitical risks in Taiwan.
- High capital expenditures.
- Supply chain vulnerabilities.
Opportunities:
- AI surge and semiconductor growth.
- EV and tech expansions.
- 2025 outlook strong.
Threats:
- Cyclical demand fluctuations.
- Competition from peers.
- Tariff and policy changes.
**TSM vs. SPY: Key Comparisons**
| Aspect | TSM | SPY |
|--------|------|-----|
| Purpose & Scope | Semiconductor manufacturing focus | Broad market index tracking |
| Dynamics | Beta 1.22 volatility vs. lower market | Steady benchmark |
| Market Position | Up 45.04% YTD, 47.6% undervalued vs. S&P gains | Stable broad exposure |
**Outlook & Risks**
TSM’s $ 288.47 position shows demand edge, with earnings beats. Geopolitical risks loom, yet dip grabs turn volatility into gains. Competition or AI wins could sway it, but time’s our edge. Gem or fade? Depends on semiconductor adoption.
TSFA trade ideas

TSM Bullish or Bearish?TSM (1H chart) is consolidating in a symmetrical triangle after a strong rally, with price hovering around the 20 EMA and MACD momentum flattening, suggesting a balance between bulls and bears; a breakout above the upper trendline could extend the uptrend toward the 290 area, while a breakdown below the lower boundary may trigger a pullback toward the 260 support zone.

TSMC (TSM) BUYTSMC (TSM) manufactures chips for virtually every tech giant, including Apple and NVIDIA. As the world’s largest semiconductor foundry, it is the quiet backbone of AI hardware.

TSMC: AI Chip Titan – Still the King or Facing New Challengers?Good morning, everyone! ☀️ TSMC: AI Chip Titan – Still the King or Facing New Challengers?
(1/9)
TSMC’s riding the AI wave with record Q4 2024 profits, but with U.S.-China curbs and fab delays, is this semiconductor king untouchable or at a crossroads? Let’s unpack it! 🔍
(2/9) – PRICE PERFORMANCE 📊
• Q4 2024: Net income up 57% to $11.4B, revenue climbed 39% 💰
• Full Year 2024: Revenue hit $87.1B, up 34% from 2023 📏
• Sector Trend: AI chip demand soaring, per Reuters 🌟
It’s a powerhouse, driven by tech’s hunger! ⚙️
(3/9) – MARKET POSITION 📈
• Market Share: Over 60% of global foundry market 🏆
• Clients: Apple, Nvidia, AMD—big names rely on ‘em ⏰
• Trend: Expanding fabs in U.S., Japan, Germany 🎯
Firm, holding the throne but not without battles! 🚀
(4/9) – KEY DEVELOPMENTS 🔑
• Q4 Earnings: Record $11.4B profit, per Jan 16 Reuters 🔄
• Expansion: Arizona fab faces delays, full ops by 2027? 🌍
• Market Reaction: Shares up 81% in 2024, still strong 📋
Adapting, with global eyes on its moves! 💡
(5/9) – RISKS IN FOCUS ⚡
• Geopolitics: U.S.-China export curbs hit demand 🔍
• Costs: U.S. fab chips 50% pricier than Taiwan 📉
• Talent: Lack of skilled U.S. workers slows growth ❄️
Tough, but risks loom large! 🛑
(6/9) – SWOT: STRENGTHS 💪
• Profit Surge: 57% net income jump in Q4 2024 🥇
• Tech Lead: 5nm mass production, 3nm in R&D 📊
• Client Base: Powers Apple, Nvidia, more 🔧
Got silicon in the tank! 🏦
(7/9) – SWOT: WEAKNESSES & OPPORTUNITIES ⚖️
• Weaknesses: High U.S. fab costs, talent gaps 📉
• Opportunities: AI chip demand, new fabs in Japan, EU 📈
Can it keep the lead amid global shifts? 🤔
(8/9) – 📢TSMC’s Q4 profit up 57%, AI booming, your take? 🗳️
• Bullish: Still the king, long-term winner 🐂
• Neutral: Steady, but risks weigh ⚖️
• Bearish: Curbs and costs slow growth 🐻
Chime in below! 👇
(9/9) – FINAL TAKEAWAY 🎯
TSMC’s record profits signal AI dominance 📈, but U.S.-China curbs and fab delays add caution 🌿. Volatility’s our friend—dips are DCA gold 💰. Grab ‘em low, climb like pros! Gem or bust?

TSM Buy OpportunityTSM has broken out of a triangular pattern, signaling a potential upward momentum. More over TSM is the leading provider of advanced AI chips to notable clients. This stock looks bullish in the near term .

TSM - LONG Swing Entry PlanNYSE:TSM - LONG Swing Entry Plan
E1: $231.00 – $229.00
→ Open initial position targeting +8% from entry level.
E2: $221.00 – $218.00
→ If price dips further, average down with a second equal-sized entry.
→ New target becomes +8% from the average of Entry 1 and Entry 2.
AD: $212.00 – $207.00
→ If reached, enter with double the initial size to lower the overall cost basis.
→ Profit target remains +8% from the new average across all three entries.
Risk Management:
Stop Loss:
Risk is capped at 12% below the average entry price (calculated across all executed positions including the Edit Zone).
Position Sizing Approach:
Entry 1: 1x
Entry 2: 1x
AD Zone: 2x
→ Total exposure: 4x
→ Weighted average determines final TP and SL calculations.
______________________________________
Legal Disclaimer
The information provided in this content is intended for educational and informational purposes only and does not constitute financial, investment, or legal advice or recommendations of any kind. The provider of this content assumes no legal or financial responsibility for any investment decisions made based on this information. Users are strongly advised to conduct their own due diligence and consult with licensed financial advisors before making any financial or investment decisions.
Sharia Compliance Disclaimer: The provider makes no guarantees that the stocks or financial instruments mentioned herein comply with Islamic (Sharia) principles. It is the user’s responsibility to verify Sharia compliance, and consultation with a qualified Sharia advisor is strongly recommended before making any investment decisions

Can the World's Most Critical Company Survive Its Own Success?Taiwan Semiconductor Manufacturing Company (TSMC) stands at an unprecedented crossroads, commanding 67.6% of the global foundry market while facing existential threats that could reshape the entire technology ecosystem. The company's financial performance remains robust, with Q2 2025 revenue reaching $30.07 billion and over 60% year-over-year net income growth. Yet, this dominance has paradoxically made it the world's most vulnerable single point of failure. TSMC produces 92% of the world's most advanced chips, creating a concentration risk where any disruption could trigger global economic catastrophe exceeding $1 trillion in losses.
The primary threat comes not from a direct Chinese invasion of Taiwan, but from Beijing's "anaconda strategy" of gradual economic and military coercion. This includes record-breaking military flights into Taiwan's airspace, practice blockades, and approximately 2.4 million daily cyberattacks on Taiwanese systems. Simultaneously, U.S. policies create contradictory pressures—while providing billions in CHIPS Act subsidies to encourage American expansion, the Trump administration has revoked export privileges for TSMC's Chinese operations, forcing costly reorganization and individual licensing requirements that could cripple the company's mainland facilities.
Beyond geopolitical risks, TSMC faces an invisible war in cyberspace, with over 19,000 employee credentials circulating on the dark web and sophisticated state-sponsored attacks targeting its intellectual property. The recent alleged leak of 2nm process technology highlights how China's export control restrictions have shifted the battleground from equipment access to talent and trade secret theft. TSMC's response includes an AI-driven dual-track IP protection system, which manages over 610,000 cataloged technologies and extends security frameworks to global suppliers.
TSMC is actively building resilience through a $165 billion global expansion strategy, establishing advanced fabs in Arizona, Japan, and Germany while maintaining its technological edge with superior yields on cutting-edge nodes. However, this de-risking strategy comes at a significant cost - Arizona operations will increase wafer costs by 10-20% due to higher labor expenses, and the company must navigate the strategic paradox of diversifying production while keeping its most advanced R&D concentrated in Taiwan. The analysis concludes that TSMC's future hinges not on current financial performance, but on successfully executing this complex balancing act between maintaining technological leadership and mitigating unprecedented geopolitical risks in an increasingly fragmented global order.

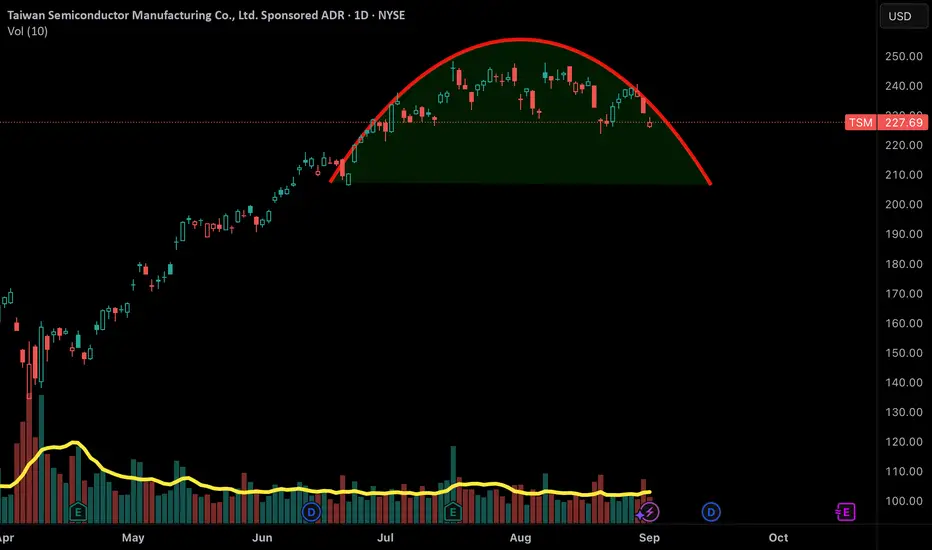
Could this be a round top formation?If this becomes a top formation, then another 10-12% correction could be the possibility!
If a strong ticker like TSM go down 10-12% then meme stocks will crash 30-50%!
TSM Clears Jan 25 High & Major S/R LevelAnd just like that overnight, NYSE:TSM tags major s/r level at $212.
It was quick and back up to Jan25 High $226.
Watching closely along with SMH and AVGO earnings later this week.

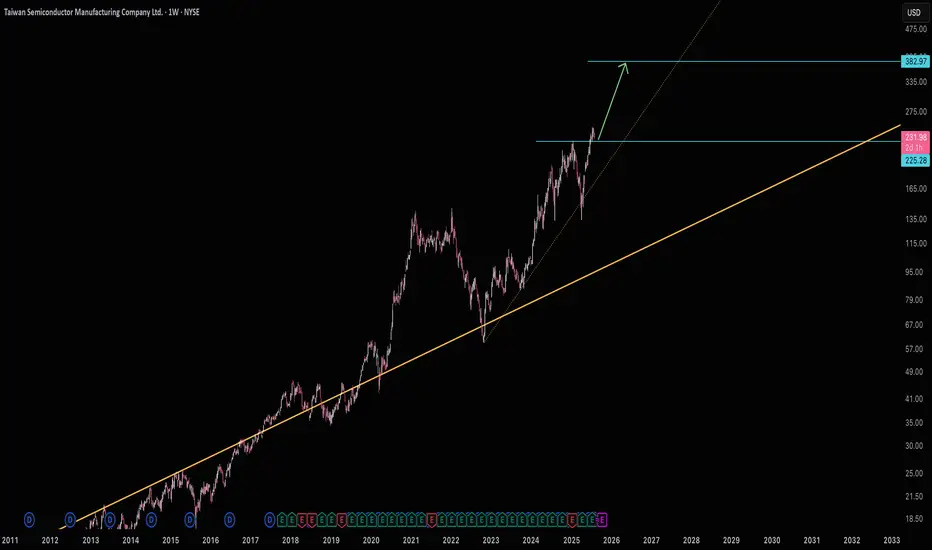
TSM on the way to $380TSM is currently building it's support at $225 and gearing up for $380.
Good luck!
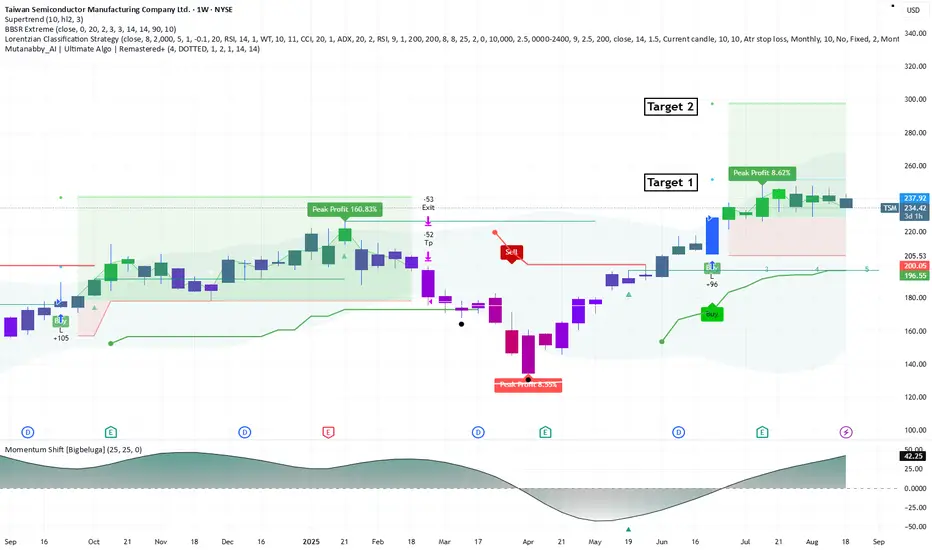
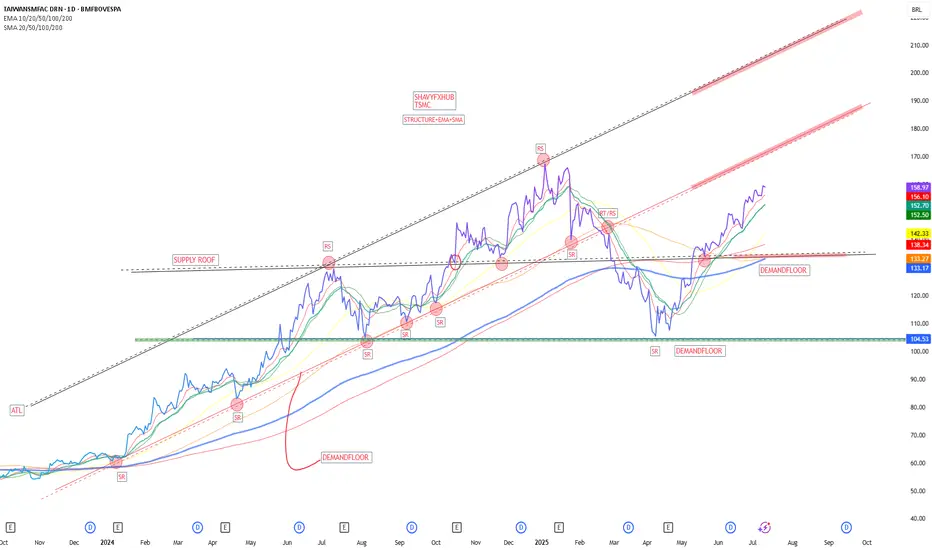
TSM Weekly Chart Analysis – Momentum Shift in PlayTaiwan Semiconductor (TSM) is showing signs of a major momentum shift on the weekly chart. Using a combination of MutantBuy.AI, Ultimate Algo, and BBR Extreme Close, we’ve identified key zones of support and resistance, along with potential buy/sell signals and profit targets.
Key Highlights:
Momentum Shift detected via – signaling a possible trend reversal.
Uncertain Classification Std. suggests volatility ahead – ideal for strategic entries.
Support and Resistance zones mapped across 1D and 2W timeframes.
Algorithmic signals from MutantBuy.AI point to bullish potential.
Trade Setup:
Target 1: 272.00
Target 2: 300.00
Stop Loss: 198.95
Follow me for more AI-powered insights and weekly chart breakdowns.
Like and follow if you want to stay ahead of the curve with smart trading strategies.
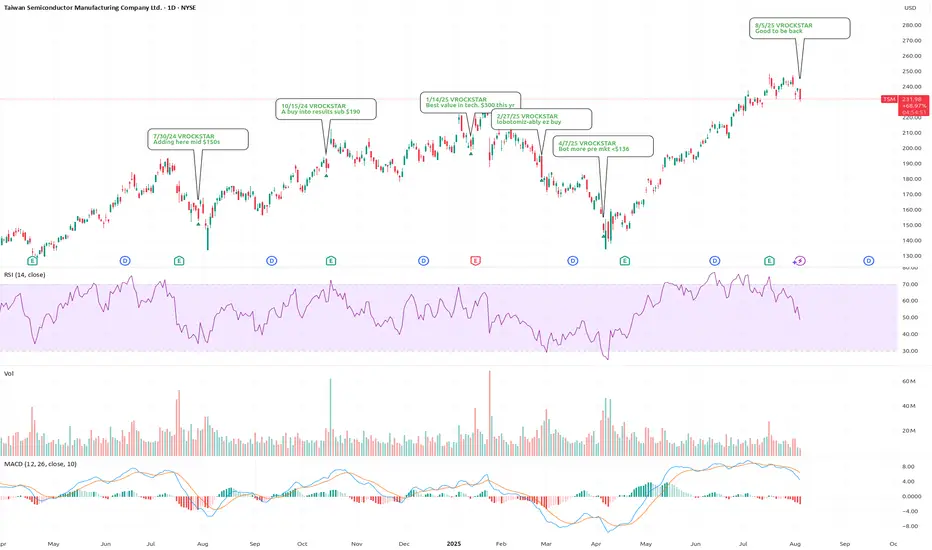
8/5/25 - $tsm - Good to be back8/5/25 :: VROCKSTAR :: NYSE:TSM
Good to be back
- you all know i stick to the winners so it's always been $TSM/ NASDAQ:NVDA and then everyone else (go read the posts if inclined w/ more thoughts on either)
- NYSE:TSM is a key infrastructure layer for the next 5-10 yr of hyper-AI growth and not disappearing
- 4.5% fcf yield, growing teens
- sub 20x PE and growing big DD's (easy)
- does it dip, find a lower lower? no clue, but i'll be adding
V
TSMBullish Case: A breakout above 246–248 could signal upward momentum.
Bearish Risk: Failure to hold 239–240 may lead to a test of lower support (~225).

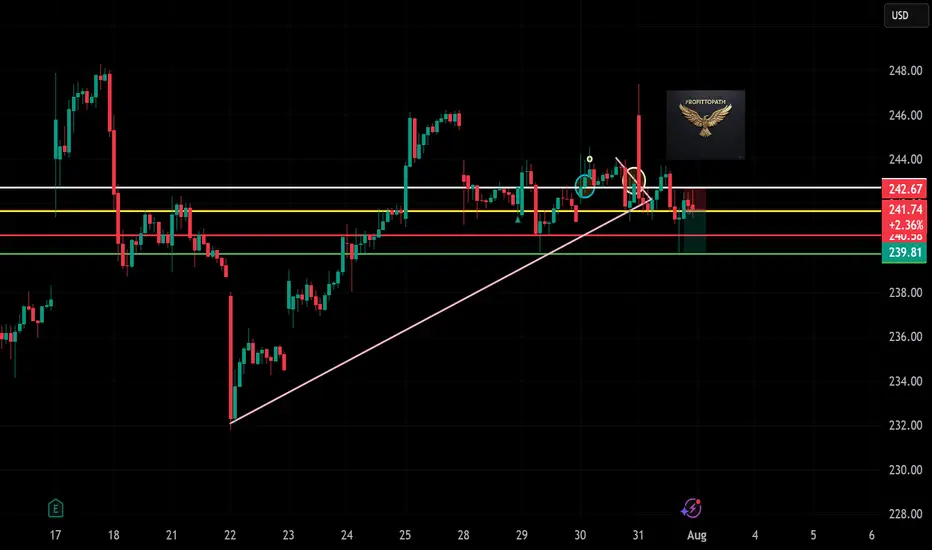
TSM Breakdown — Short Trade in Motion!“”
🎯 Setup:
→ Entry: ~$241.74
→ SL: ~$243.00
→ Target: $239.81
📌 Bearish rejection + trendline break = short opportunity.
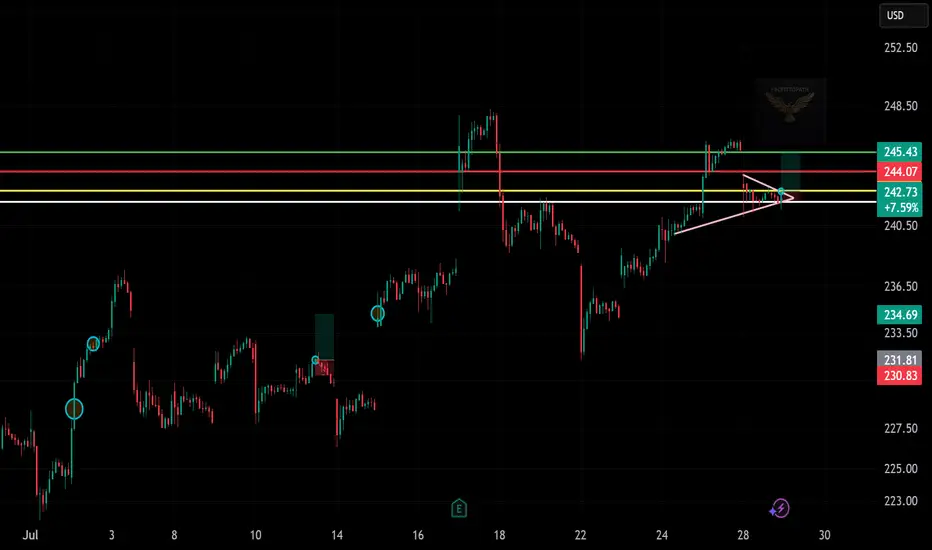
Trade Setup: LONG on TSM !📈 (Taiwan Semiconductor)
🕰️ Timeframe: 30-minute chart
🔍 Pattern: Ascending triangle breakout
📉 Previous Trend: Recovery after drop
🔁 Setup: Bullish continuation with breakout confirmation
🧩 Technical Breakdown:
Support Zone:
~$242.50 (yellow horizontal support)
Uptrend line holding as dynamic support (pink diagonal)
Entry Zone:
Around $242.75, just above triangle breakout and support retest
Resistance / Target Levels:
TP1: $244.07 (red zone — minor supply)
TP2: $245.43 (green zone — prior high, resistance zone)
Stop Loss:
Below $241.80 or just under triangle trendline (~$241.25)
Risk-Reward Estimate:
Approximately 1:1.5 to 1:2 based on $1.5 risk and $3 reward potential
⚠️ What to Watch:
Volume confirmation during breakout or retest
Holding above yellow support zone and triangle trendline
Potential fake-out risk near $244 zone if volume fades
✅ Summary:
TSM is setting up a bullish continuation after reclaiming key levels and forming a tight ascending triangle. A clean breakout above $243 may trigger a move toward $245+ if buyers step in.
TSM eyes on $194: Major Resistance to Break-n-Run or Dip-to-Buy TSM has been recovering with the chip sector.
Currently testing a Major Resistance zone.
Look for a Dip-to-Buy or Break-n-Retest entry.
$193.92-195.18 is the exact zone of concern.
$177.83-178.31 is the first major support.
$203.68-204.56 is the first resistance above.
========================================
.

TSMCThe Taiwan Semiconductor Manufacturing Company Limited (TSMC) is the world’s largest and most advanced semiconductor foundry, headquartered in Hsinchu Science Park, Taiwan. Founded in 1987 by Morris Chang, TSMC pioneered the pure-play foundry model, focusing exclusively on manufacturing chips designed by other companies, enabling fabless semiconductor firms like NVIDIA, AMD, and MediaTek to thrive.
Key Facts about TSMC (July 2025):
Market Position:
The dominant global semiconductor contract manufacturer, with a market capitalization exceeding $1.19 trillion (over $1 trillion USD), making it one of the most valuable tech companies worldwide.
Technology Leadership:
TSMC leads in advanced process technologies, producing chips at cutting-edge nodes including 3nm and moving toward sub-2nm by 2028. It was the first to commercialize extreme ultraviolet lithography (EUV) at scale.
Recent Growth:
In Q1 2025, TSMC reported a remarkable 42% year-over-year revenue increase, driven by surging demand for AI server chips, smartphones, and stockpiling ahead of US tariffs. Revenue for Q1 2025 was around NT$839 billion (~$25.5 billion USD).
Expansion Plans:
TSMC is aggressively expanding capacity with nine new facilities planned in 2025, including eight fabs and one packaging plant across Taiwan and overseas locations such as the US, Germany, and Japan. Fab 25 in Taichung is set to begin construction by year-end 2025, supporting the company’s roadmap toward sub-2nm chip production by 2028.
Global Importance:
TSMC is central to the global semiconductor supply chain, producing chips used in high-performance computing, smartphones, automotive electronics, AI applications, and more. It plays a strategic role amid US-China trade tensions and global tech competition.
Leadership:
The CEO is C. C. Wei, who has overseen TSMC’s continued technological innovation and expansion.
TSMC remains a cornerstone of the global semiconductor industry, driving innovation and capacity expansion to meet the growing demand for advanced chips powering AI, 5G, automotive, and consumer electronics worldwide.
#AI #STOCKS
TsmEdged up to the top of resistance here.
Expecting a correction back to 176-185 area here
1hour chart
Here's the uptrend since april..
The support would now be around 227.
I expect a pullback to that area this week and if support holds price could bounce back and tag weekly resistance around 240 but I don't think price will linger long above 230. A correction is coming for tsm

Higher Prices Inbound!NYSE:TSM , market dominance, serving clients such as NASDAQ:AAPL , NASDAQ:NVDA and NASDAQ:AMD . AI demand surging, strong financials with optimistic revenue outlook.
At a RS Rating of 90
I have reasons to believe this equity price could increase

TSM (Taiwan Semiconductor)-Breakout Play with Strong FundamentaTicker: TSM (NYSE)
Recommendation: BUY
Current Price: $216.62
Entry Zone: $216 - $218 (Breakout confirmation)
Stop Loss: $190 (Key support level, -12.3% from entry)
Take Profit: $270.04 (+24.7% upside)
Risk/Reward Ratio: 1:2
📈 Technical Analysis
Trend: Strong bullish momentum across all timeframes (Daily/4H/1H).
Key Levels:
Support: $200 (SMA-50), $190 (Major swing low).
Resistance: $218 (Bollinger High), $270 (Fibonacci extension).
Indicators:
RSI (Daily): 72.98 (Approaching overbought but with room to run in strong trends).
MACD: Bullish crossover, positive momentum.
Volume: Rising on upward moves, confirming buyer interest.
💡 Fundamental Catalyst
Strong Growth: Revenue +33.8% YoY, Net Income +36% YoY.
Undervalued Metrics: P/S Ratio of 0.35 (Sector avg: ~5.0).
Low Debt: Debt-to-Equity of 0.22, Interest Coverage Ratio of 174x.
🎯 Why This Trade?
Breakout Potential: TSM is testing multi-week highs with volume support.
Semiconductor Sector Strength: NVDA/AMD leading sector rally, TSM as a key supplier.
High Reward/Risk: Clear SL level with 2x upside potential.
⚡ Trade Management
Add-on: Consider adding at $225 if momentum continues.
Trailing Stop: Move SL to breakeven at $220 if price reaches $240.
Watchlist: Monitor NASDAQ/SOX index correlation.
📉 Risks:
Broad market pullback.
Geopolitical tensions (Taiwan exposure).
✅ Verdict: TSM combines technical breakout strength with undervalued fundamentals. A high-conviction trade for swing traders.
Like & Follow for more data-driven ideas! 🔥
#TSM #Semiconductors #Breakout #Investing

TSM - Bullish Trade IdeaENTRY ZONE & STRIKE ANALYSIS
Optimal Entry Range: $209.80–$210.60 (Pullback Zone into Arc FVG base)
Momentum Entry: Above $214.35 with 15m/30m breakout + bull volume
Strike Focus: TSM 215c / 220c
Expiration Range: June 28 → July 5 (prefer IV pop from short consolidation breakout)
🛡 SL/TP LADDER & RISK STRUCTURE
Stop-Loss: 208.74 (2H WTMA break confirmation)
TP Ladder:
TP1: 214.35
TP2: 217.39
TP3: 220.53

TSM Weekly Options Setup – Overbought with Max Pain Pressure (20📉 TSM Weekly Options Setup – Overbought with Max Pain Pressure (2025-06-11)
Ticker: NYSE:TSM (Taiwan Semiconductor)
Bias: 🔻 Moderately Bearish (Short-Term)
Setup Type: Max Pain Reversion Play | Confidence: 65%
Expiry: June 13, 2025 | Entry Timing: Market Open
🔍 Technical & Sentiment Snapshot
📍 Price: ~$214.10
📈 Short-Term Trend (5-min): Strong bullish momentum, price > EMAs, MACD positive
📉 Daily Chart: RSI ≈ 80.79 → extremely overbought, price above upper Bollinger Band
🎯 Max Pain: $205 → possible gravitational pull
💬 Options Sentiment: Heavy open interest at $205 Puts; cautious tone across models
🧠 AI Model Consensus Breakdown
🔹 Bullish Bias (Short-Term Momentum)
• Grok/xAI & Llama/Meta: Favor riding remaining upside with $217.50 Calls
• Justification: Intraday signals strong, MACD bullish, RSI not peaking yet on M5
🔹 Bearish Bias (Daily Overextension & Max Pain)
• Gemini/Google & DeepSeek: Favor reversion to $205 using $205 Puts
• Justification: RSI > 80, price extended, high put OI & max pain align around $205
✅ Recommended Trade Plan
🎯 Direction: PUT
📍 Strike: $205
📅 Expiry: June 13, 2025 (Weekly)
💵 Entry Price: $0.63
🎯 Profit Target: $1.20 (+100%)
🛑 Stop Loss: $0.30 (–50%)
📈 Confidence: 65%
📏 Size: 1 contract
⏰ Entry Timing: Market Open
⚠️ Key Risks & Considerations
• 🚀 A breakout above $215.50 could invalidate the bearish thesis
• ⏳ Theta decay is aggressive in weeklys – move must come quick
• ⚡ Intraday bullish signals are still strong → this is a contrarian trade
• 🛡️ Use disciplined stops and size conservatively to manage risk
💭 Will NYSE:TSM fade off its overbought highs or keep ripping?
📉 Put or 📈 call — what’s your play? Drop your take 👇

$TSM Setup – A.I. Backed Bullish SignalTaiwan Semi ( NYSE:TSM ) shows breakout potential with AI tailwinds and sector strength. Predicted range: $197.55–$205.45. Model Grade: A. Trend: +1.38%.
