Understanding Consolidation & Trading itWhat Consolidation Is
Consolidation is a market phase where price moves sideways within a defined range, showing indecision or balance between buyers (bulls) and sellers (bears).
Characterized by low volatility, overlapping candles, and no clear trend direction.
Often occurs after strong moves (as the market pauses) or before breakouts (accumulation/distribution).
Impact on Bulls & Bears
Bulls: View consolidation near highs as accumulation (buyers building positions before a breakout upward).
Bears: View consolidation near lows as distribution (sellers unloading before a breakdown).
Both sides place stop orders outside the range → creating liquidity pools that smart money hunts.
How Traders Can Take Advantage
Range Trading – Buy near support of the range, sell near resistance, until breakout occurs.
Liquidity Strategy – Wait for fakeouts beyond consolidation, then trade in the opposite direction (stop hunt setup).
Consolidation Across Timeframes
Lower Timeframes (1m–15m):
Looks like noise but is often where scalpers range trade.
Breakouts can give small but quick moves.
Mid Timeframes (1H–4H):
Shows clear accumulation/distribution phases.
Useful for intraday & swing traders.
Higher Timeframes (Daily–Weekly):
Represents major market indecision.
Breakouts from these zones often fuel massive trend moves.
✅ Summary:
Consolidation = sideways range = balance of bulls & bears.
Inside range → fade the extremes.
Outside range → trade support & resistance or liquidity sweep.
On different timeframes → the same consolidation can be noise on 5M, but a critical accumulation on the Daily chart.
NAS100 trade ideas

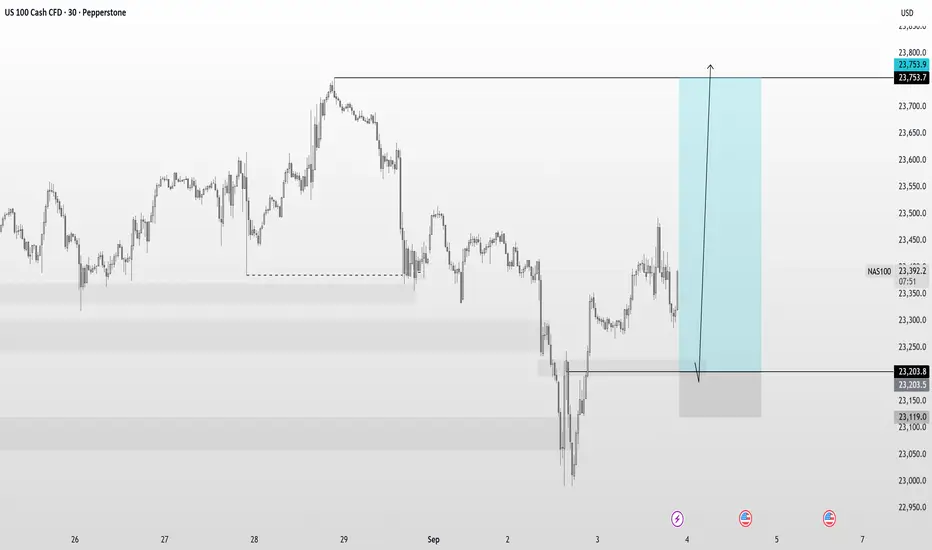
US100 - New Highs are coming!Market Context
The US100 is trading within a strong bullish structure after bouncing from a well-defined support zone. Price has been respecting key levels on the way up, forming fair value gaps (FVGs) that act as stepping stones for continuation. The overall picture points to a market that is building momentum for a potential liquidity grab higher.
Support Zone & Initial Rally
The chart shows a strong support zone at the lows, which provided the foundation for the current bullish impulse. Once price tapped into this area, buyers stepped in aggressively, leaving behind multiple bullish imbalances on the way up. This confirms that institutional interest is present at these levels.
Fair Value Gaps & Structural Strength
On the rally, price created overlapping FVGs, including a bullish fair value gap and an inversion fair value gap (IFVG). Importantly, candles never closed below the primary FVG — reinforcing its validity as strong demand. This means that even if price retraces, these areas will be closely watched for re-entries.
Liquidity Grab & Next Move
Above current price action lies a clear buy-side liquidity (BSL) level. The market is likely to target this zone, either directly from current levels or after a retest into the stacked FVGs. A liquidity sweep above the highs would be the natural continuation of the bullish structure, unlocking the potential for new short-term highs.
Final Thoughts
The US100 is showing a textbook bullish setup: strong support, healthy retracements, and unmitigated FVGs acting as demand. As long as the lower support holds, the expectation remains for a run into the BSL above.
If this analysis brought value, drop a like — and let me know: are you waiting for the retest, or do you think the market runs the highs straight away?

Explaining Fibonacci Retracement/Extension levelsThis video is designed to help teach you why I use the Fibonacci Defense levels as components of price action and how I use Fibonacci retracement/extension levels (related to previous market trends).
Remember, the three components of price action are TIME, PRICE, & ENERGY.
If you don't understand how price is structured before attempting to use Fibonacci concepts, it's almost like trying to throw darts blindfolded.
You must break down the previous trends in order to try to understand what is happening with current price trends (expansion/contraction/phases).
Watch this video and I hope it helps all of you understand what the markets are doing and how to use Fibonacci Retracement/Extension levels more efficiently.
All types of technical analysis are validation tools - not guarantees. The only thing we get out of technical analysis is a way to validate or invalidate our expectations. A or B. Nothing else.
Get some.
#trading #research #investing #tradingalgos #tradingsignals #cycles #fibonacci #elliotwave #modelingsystems #stocks #bitcoin #btcusd #cryptos #spy #gold #nq #investing #trading #spytrading #spymarket #tradingmarket #stockmarket #silver

NASDAQ Eyes 23,565 Pivot as PCE Report LoomsNASDAQ – Update
The Nasdaq slipped on Friday as traders turned cautious ahead of the highly anticipated PCE inflation report, the Fed’s preferred gauge that could heavily influence the September rate decision. The release, expected before the bell, will likely set the near-term trend.
Technical Outlook:
The index reversed from resistance, showing signs of pressure ahead of the data.
A 1H close below 23,565 will confirm bearish continuation toward 23,435 → 23,295 → 23,170, especially if PCE comes in hotter than expected.
If the report is softer, bullish momentum may resume, targeting the ATH at 23,870, with extended resistance at 24,090.
Key Levels:
Support: 23,565, 23,435 – 23,295 – 23,170
Resistance: 23,690 – 23,870 – 24,090
📌 Bias: Neutral ahead of the PCE release. Expect high volatility and wait for confirmation at the pivot level before positioning.

Nasdaq shortA nice smt has formed .
Targeting the asian lows .
Let us see if the news will have an impact on this chart .
Chart looks bearish.

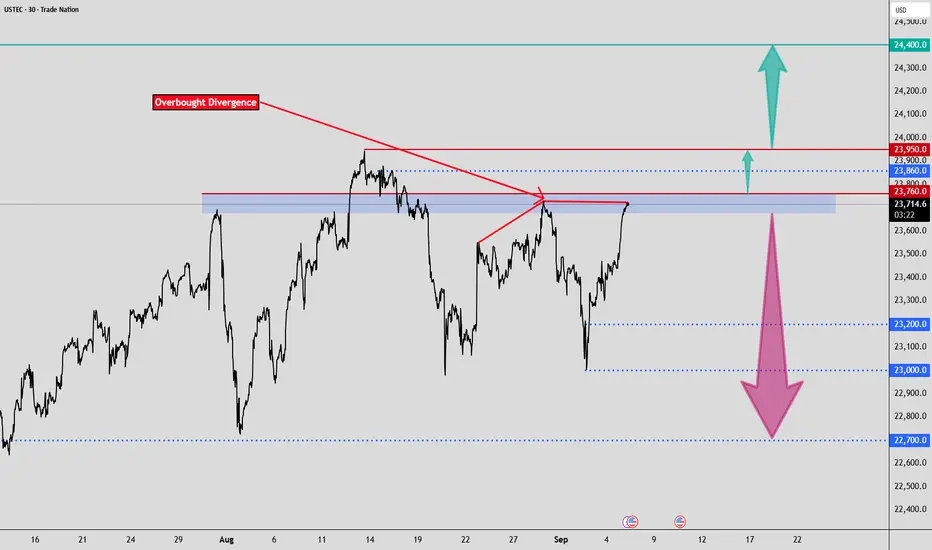
NAS100 - Divergence Detected 4 TodayDear Friends in Trading,
1) NFP Today - Be safe.
Keynote:
23860 is a liquidity pool.
Overbought Divergence detected up to 2HR TF.
NFP DATA - Anything is possible.
Let me know if anything is unclear?
I sincerely hope my point of view offers a valued insight.
Thank you for taking the time study my analysis.
WHY I THINK NASDAQ WOULD CONTINUE ITS BUYS
Big tech is still crushing earnings, AI plays are heating up, and the semis? Still running. Every dip lately is getting bought up fast, and that tells me one thing: smart money is still in the game.
We’ve got a potential rate cut on the horizon, inflation’s cooling off, and the market is pricing in more upside. Structure-wise, we’re seeing higher lows and breakouts across key levels.
Unless something major shakes the market, I’m staying bullish here. Momentum, fundamentals, and sentiment are all lining up. Buyers aren’t done — not even close.
NAS100- OPPORTUNITY OF A LIFETIMETeam, I was patiently wait for the NAS100 hit 23200 - liquidity sweep before entering
NOW lets jump on board at 23220-23200 with STOP LOSS AT 23120
Target 1 at 23315 - take 50% partial and bring stop loss to BE
NEXT target at 23365-95 - take 30%
the rest at 23415-23550
LETS GO AND MAKE MILLION TOGETHER.
NQ is still bullish on the HTFDespite NQ being bearish on the lower timeframes, it is very bullish on the higher timeframe. with good risk management, I would prefer siding with the buyers as per my analysis attached.

Nasdaq “Tug of war”
Nasdaq 100 has recently shown a significant shift in momentum on the 4hour chart, with bearish pressure taking hold. After a strong upward trend, the index has experienced a sharp decline, now consolidating within a critical range. The key to the next major move lies in the defence or failure of the defined support and resistance levels.
Current Market & Price Action
The price action clearly indicates a period of bearish dominance, marked by a substantial selloff from recent highs. The price is currently contained below a key resistance level at 23,515.6, which had previously acted as support. This consolidation phase is critical and suggests a tug of war between bulls and bears. The current price hovers around 23,406, leaving both a bullish reversal and a bearish continuation as plausible outcomes.
The Bearish Case : Reaching for 23,000
If the price continues to face rejection at the 23,515.6 level, the path of least resistance is to the downside. The next major target for sellers is the significant support zone between 23,000 and 22,900. This level is not only a major psychological number but also represents a strong structural support zone from previous price action.
A confirmed break below the current consolidation range, particularly the 23,331.4 level, would signal a continuation of the downtrend. A move to the 23,000-22,900 zone represents a potential drop of approximately 1.36%, as measured on the chart. Traders should watch for a decisive break of this support, which could trigger a much larger sell off.
The Bullish Case:
Reclaiming Momentum
For the bullish narrative to resume, the index must convincingly break and hold above the 23,515.6 resistance. A strong close above this level on the 4hour chart would invalidate the immediate bearish outlook and signal a potential reversal. If this occurs, the next logical target would be the higher resistance at 23,757.2, marking a potential recovery of the recent losses.
This bullish scenario would likely be fueled by a positive catalyst, such as favorable economic data or dovish comments from the Federal Reserve, which the market is currently anticipating. A successful break and retest of 23,515.6 would serve as a key entry signal for buyers aiming for higher levels.
Key Contextual Factors
Recent economic data and Federal Reserve policy expectations are likely to be major drivers for the Nasdaq's next move. As of early September, a rate cut by the Federal Reserve is heavily priced in, with some analysts predicting a move in the upcoming FOMC meeting. Any surprises to this expectation, either in a more hawkish or unexpectedly dovish direction, could trigger significant volatility. The tech heavy Nasdaq is particularly sensitive to interest rate policy, as it impacts company valuations and financing.
Summary and Outlook
Nasdaq 100 is at a pivotal point. The price is currently trapped between the 23,515 resistance and the 23,331 support.
* Bearish Trigger: A sustained break below 23,331.4 could lead to a test of the 23,000-22,900 support zone.
* Bullish Trigger: A decisive break above 23,515.6 could target the 23,757 resistance.
Given the recent price action and broader market uncertainty, the immediate risk appears to be to the downside. However, the market's direction will be confirmed by which of these critical levels is breached first.

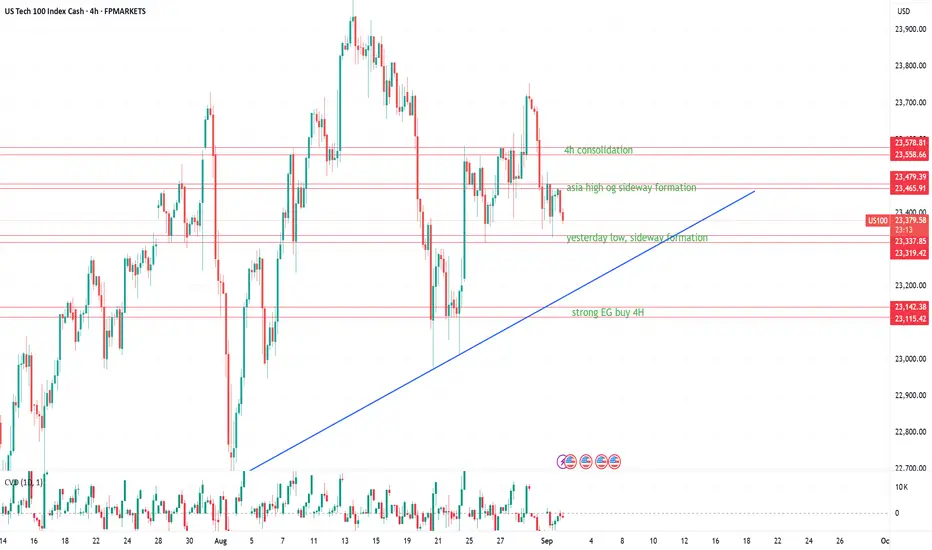
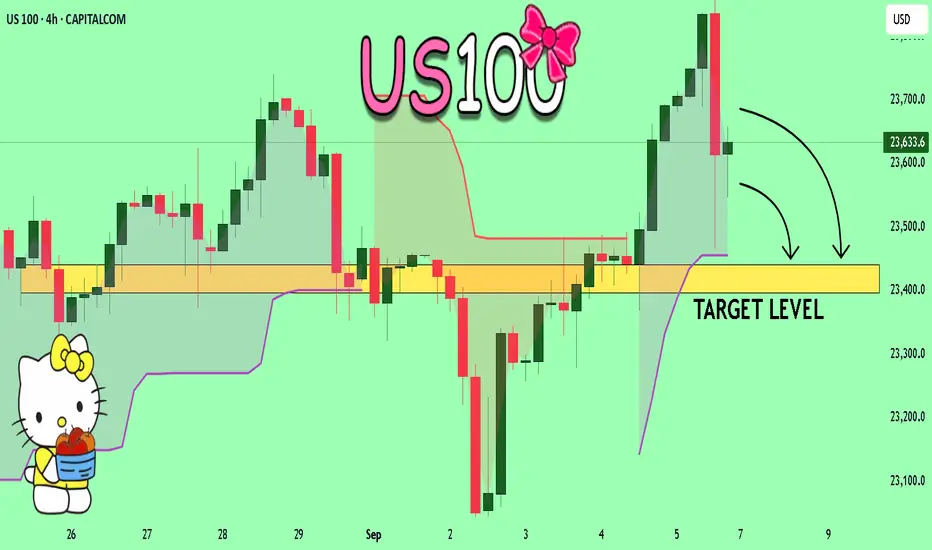
US100 – London Session Trade LevelsMarket Context
The Nasdaq-100 is currently trading within a consolidation pattern after being rejected around ~23,700. Momentum has slowed, and the market is searching for direction. During the London session, the focus is on intraday reactions around key levels. These zones may act as catalysts for either continuation or short-term reversals, depending on price action.
Sell Zones
23,465–23,480 (Asia high / sideways formation)
This zone represents the top of the Asian range and extends from a sideways structure.
A retest during London hours may trigger short-term selling momentum, especially if volume fades compared to Asian trading.
23,558–23,579 (4H consolidation)
A clear resistance area from the latest 4H consolidation, where several bullish attempts were previously absorbed.
If price fails to break this area with strong momentum, it is likely to act as a solid supply zone.
Buy Zones
23,320–23,338 (Yesterday’s low / sideways formation)
Represents yesterday’s low and a key intraday balance point.
If price dips into this area during London hours and shows absorption (e.g., long wicks / stronger CVD on the bid), it may serve as a springboard for a bounce.
23,115–23,140 (Strong 4H demand)
The strongest buy zone on the chart, aligning with both a structural support level and a prior reaction zone on 4H.
A test of this zone may indicate a “capitulation move,” where stronger buyers could be waiting.
Market Update and Sentiment Analysis
Overall Assessment
The Nasdaq-100 (US100) currently finds itself in uncertain territory. The technology sector, historically the driving force behind the index’s performance, faced headwinds toward the end of August. Rotation into small-cap equities, rising uncertainty ahead of key macroeconomic data and the Federal Reserve’s rate decision, as well as weak technical signals, are all contributing to a mixed sentiment picture.
Market Developments
End of August: The Nasdaq-100 closed the month down approximately –1.2%, bringing the index to around 23,415. Despite the pullback, year-to-date performance remains up by roughly 10–11%.
Sector Rotation: The small-cap segment (Russell 2000) gained 7.3% in August, significantly outperforming the Nasdaq-100. The shift away from technology reflects both concerns about AI profitability and expectations of future rate cuts, which traditionally favor smaller companies.
Earnings Pressure: Weak earnings from companies such as Dell, Nvidia, and Marvell Technology disappointed the market. Margin pressure within the tech sector has raised concerns about growth prospects.
Macroeconomic Context
Data Sensitivity: The market is displaying extreme sensitivity to employment and inflation data. Even minor deviations in key figures can trigger significant price movements.
Federal Reserve: Investor attention is focused on the Fed’s upcoming rate decision. Expectations of a rate cut later in the year serve as a supportive factor, though uncertainty remains elevated.
Historical Pattern: September has traditionally been the weakest month for the Nasdaq index. This increases the risk of additional volatility in the weeks ahead.
For the London session, the focus is on short intraday moves around well-defined supply and demand zones. Given the broader negative bias in the market, traders should be extra cautious with longs — confirmation and strong absorption signals are key before entering buys.
US100 Risky Short! Sell!
Hello,Traders!
US100 made a sharp
Move up and made a
Retest of the horizontal
Resistance of 23,375
From where we will be
Expecting a local bearish
Correction and a move down
Sell!
Comment and subscribe to help us grow!
Check out other forecasts below too!
Disclosure: I am part of Trade Nation's Influencer program and receive a monthly fee for using their TradingView charts in my analysis.

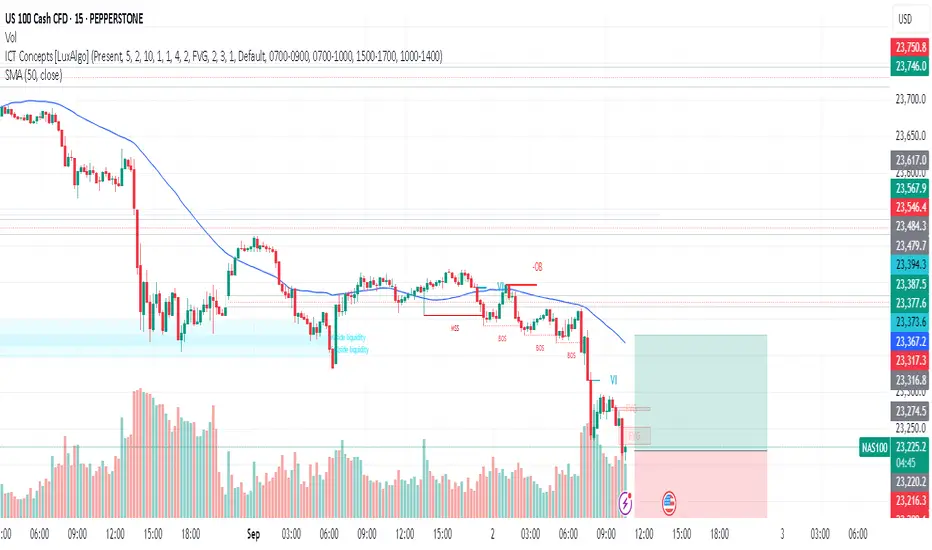
NAS100 Long Setup | Demand Zone ReactionPrice action on NAS100 has pulled back into a key demand zone after sweeping liquidity below short-term support ($$$). This area also aligns with previous imbalance fills, suggesting buyers may look to defend it once again.
📊 Technical Outlook
Price swept liquidity under prior support and tapped into demand.
Long idea is valid with risk defined below demand zone.
If buyers hold this zone, upside continuation is likely toward the 23,500–23,700 region.
🌐 Market Sentiment
Seasonality Risk: September is historically the weakest month for U.S. equities, often marked by heightened volatility.
Investor Sentiment: Surveys show mixed outlook — Fear & Greed Index remains in “Greed” (64), while AAII still reports more bears than bulls.
Macro Headlines: Fed uncertainty, tariff rulings, and over-reliance on tech remain short-term risks.
⚖️ Summary
Technically, NAS100 is sitting in a prime buy zone — liquidity grab + demand reaction setup. However, fundamentals still suggest caution, as September volatility could trigger deeper sweeps before a meaningful rally.
👉 For me, it’s a buy from demand with controlled risk. If bulls defend, we could see momentum shift back upward.
💬 What do you think — will bulls hold this level, or will September’s volatility push NAS100 even lower?

NASDAQ100 HIGH PROBABILITY SETUP SOON!!!🚨 US100 HIGH PROBABILITY BUY SETUP 🚨
* Here We Can See Clearly The Next Potential Move For NAS100 Coming Hours/Days.
* Keep Your Eyes Close On Your Trading Positions.
* Happy PIP Hunting Traders.
£ FXKILLA £

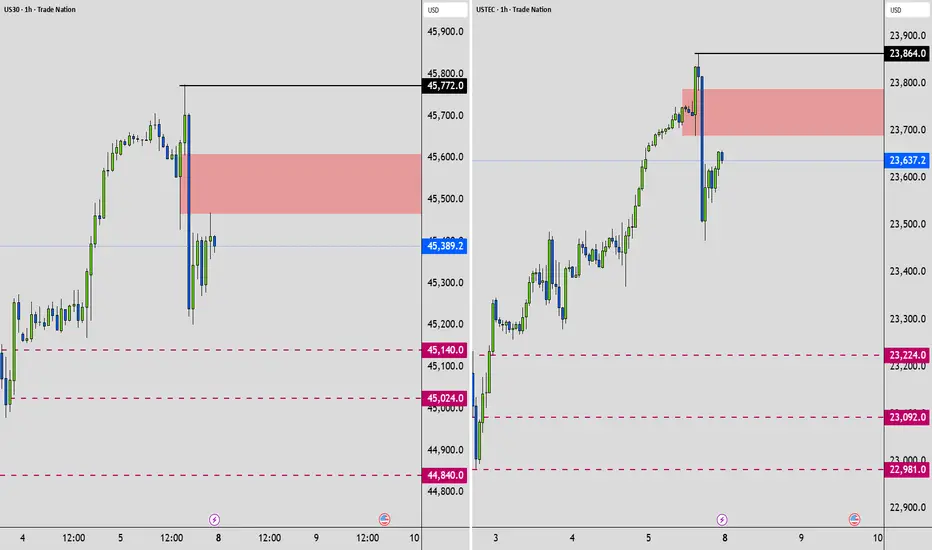
US30 & NAS100 - Potential TargetsDear Friends in Trading,
How I see it for Monday & Tuesday: 8-9 Sept.
1) Potential Targets for US30
2) Potential Targets for NAS100
Keynote: BE SAFE!
Wednesday to Friday is stacked with High Impact Data.
I personally will be focusing on catching setups for this week before Wednesday.
I sincerely hope my point of view offers a valued insight.
Thank you for taking the time study my analysis.
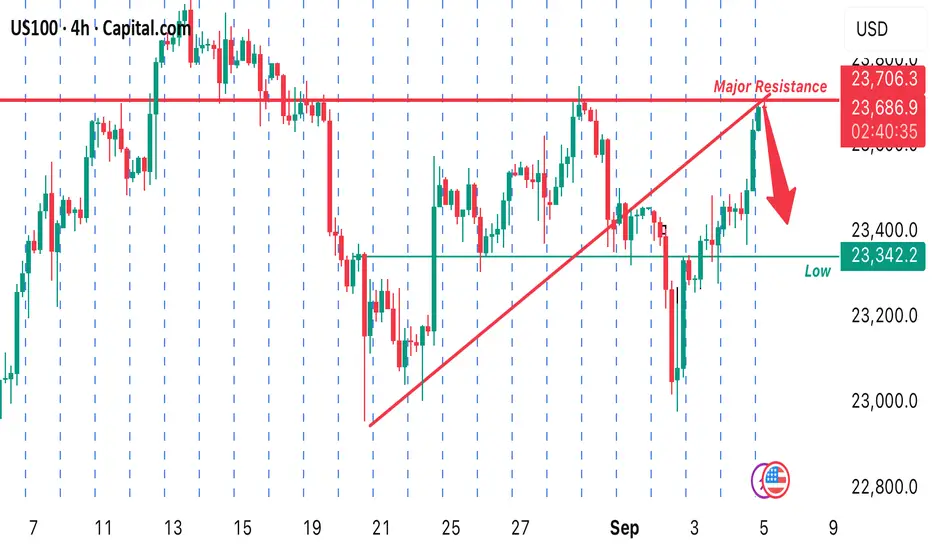
US100 APPROACHES RESISTANT LEVEL!Price just approached. Resistance level. potentially forming a double top pattern. Technically, I’m looking forward to selling from the current market price as it has a high tendency to sell off from that zone. A sell opportunity is envisaged.
NAS100 UPDATE - BULLS or TRAP?Dear Friends in Trading,
JOLT's Event Today - Be Safe!
Keynote:
Strong demand or strong correction?
Can price stabilize above 23550 to respect structure?
Untouched liquidity between 22900 - 22600.
I sincerely hope my point of view offers a valued insight.
Thank you for taking the time study my analysis.

US100 Technical Analysis! SELL!
My dear friends,
My technical analysis for US100 is below:
The market is trading on 23633 pivot level.
Bias - Bearish
Technical Indicators: Both Super Trend & Pivot HL indicate a highly probable Bearish continuation.
Target - 23440
About Used Indicators:
A pivot point is a technical analysis indicator, or calculations, used to determine the overall trend of the market over different time frames.
Disclosure: I am part of Trade Nation's Influencer program and receive a monthly fee for using their TradingView charts in my analysis.
———————————
WISH YOU ALL LUCK
NASDAQ to 26,000 before year end - September, 2025No doubt this idea will be controversial as a majority of ideas published on the platform call for a bearish outlook.
Earlier this year paper hands were flushed out of the market on tariff scares. They couldn’t exit the market fast enough, some didn’t actually know why they were selling as emotions were in full control.
Today those same traders and investors sit in cash as they wait for an opportunity to buy in. Others betting heavily against the trend for Armageddon. All the while the market grinds upwards and onwards.
Two very simple questions everyone must ask when entering or betting against the market:
1. What is the trend?
2. Support and resistance, which is it?
You cannot maintain a bearish bias should you answer both of those questions positively. That’s emotion. Do you find yourself scanning lower timeframes to look for bias confirmation? You'd be in majority then. Notice how many published ideas you see operating in the 15 and 30 minute charts with 2 to 3 month forecasts? Always makes me smile, but it will not change the facts of the chart.
The Trend
Higher lows are evident on the daily chart below, marked out in black. The trend is your friend until the end.
Support & resistance
Look left. On the daily chart we can see multiple support tests with confirmation on past resistance. If the levels do not at first appear, zoom out using a higher timeframe. A majority will zoom in instead to confirm bias, that’s a red flag.
The Put / Call ratio
Retail traders are aggressive in their attempts to “short” this market. Nowhere is that more evident than the Put/Call ratio. Anytime you see dumb money move the put call ratio to 90 and above, the market rips. Just recently short sellers moved the ratio beyond this level. The chart below provides a comparison with the NDX to show what happens next. The rally that follows will typically last up to 2 months on average after this signal.
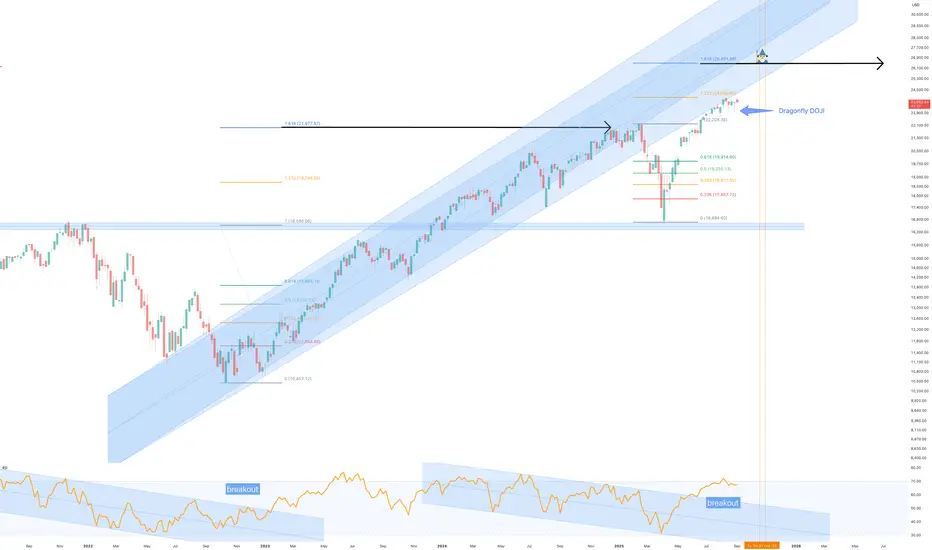
Why 26000?
The market entered price discovery after the previous all time high breakout of 22k. The forecast area was previously published, see linked ideas. The same conditions that allowed those forecasts now repeat. In addition the Fibonacci extensions; the NDX repeatably rallies to the 1.618 extension after each and every emotional flush out. It’s a gift horse of an opportunity.
Previous years:
Conclusion
Markets climb walls of worry, and this moment is no different. The loudest voices today call for collapse, but the charts, price action, and sentiment data are telling another story entirely. Higher lows, confirmed support, extreme put/call ratios, and Fibonacci extensions all align with one clear outcome: continuation.
A move to 26,000 on the NASDAQ before year-end is not a wild stretch of imagination, but the logical conclusion of repeating market behaviour. Every emotional flush out has historically created the runway for price discovery to the 1.618 extension, and this time is no different.
If you’re betting against the trend, you’re not fighting the market, you’re fighting math, structure, and history. The bears may dominate headlines but that just News. The market is not listening to fear. It’s grinding higher, and the destination is 26,000.
Ww
NAS100 UPDATE - Potential 4 Pre-Post NFPDear Friends in Trading,
1) NFP tomorrow - Be Safe.
2) TIP - Post NFP Mondays: (Applies to all instruments - Forex, Indices & Metals)
-----"ASIA + LONDON SESSION's PRICE ACTION IS BIG AND OPEN MOST OF THE TIME"-----
3) Keynotes:
a) As PA progresses, I add updates/notes on this post.
b) I do not say or even think I am right most of the time.
c) But I do share what I see freely.
-----"YOU ARE MOST WELCOME TO FOLLOW THE PROGRESS WITH ME"-----
Let me know if anything is unclear?
I sincerely hope my point of view offers a valued insight.
Thank you for taking the time study my analysis.
Trendline Pullback BreakThe price made a pullback after a bearish move and now it has broken the pullback trendline, followed by a small pullback and now it looks to make a bearish move
WE ONLY TRADE PULLBACKS
Comment your thoughts

NASDAQ holding the 4H MA200 can initiate the next rally.Nasdaq (NDX) has been trading within a Channel Up since mid May and currently is consolidating on its 4H MA200 (orange trend-line). Based on the 4H RSI we might be on a similar Higher Low as on May 30, having previously made a Channel Up bottom near the 1D MA50 (red trend-line).
The Bullish Leg that followed this Low was +6.80%, so we have our Target tailored on it at 24500.
-------------------------------------------------------------------------------
** Please LIKE 👍, FOLLOW ✅, SHARE 🙌 and COMMENT ✍ if you enjoy this idea! Also share your ideas and charts in the comments section below! This is best way to keep it relevant, support us, keep the content here free and allow the idea to reach as many people as possible. **
-------------------------------------------------------------------------------
💸💸💸💸💸💸
👇 👇 👇 👇 👇 👇

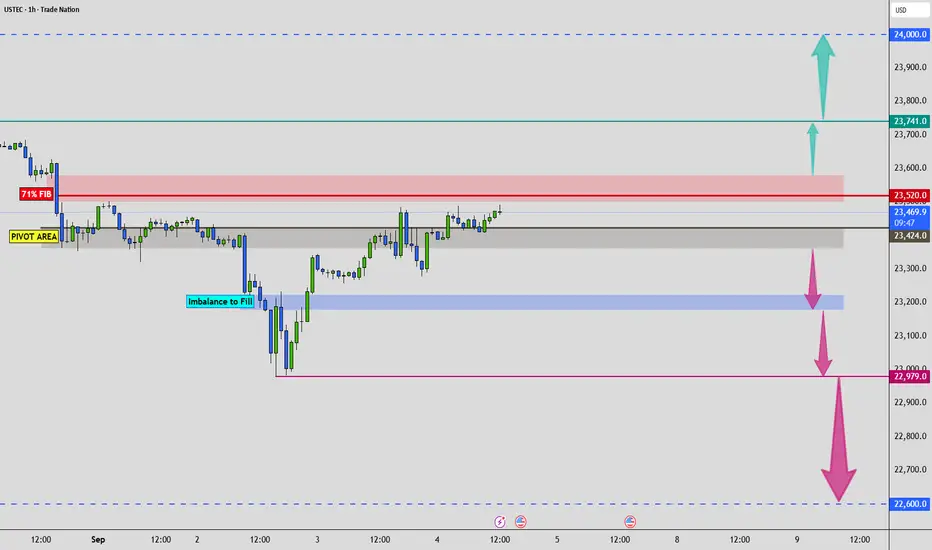
Nas looks so cleanThis pattern on Nas is to clean, either we get a break out to that fat pool of liquidity to the upside or we fake out and swap out the buyers either way I’m prepared!
But hey what do I know
