US30 Trade Set Up Dec 1 2025Price is overall bullish but there are bullish daily FVGs that i will expect price to fill before continuing bullish so i will wait for London high and bearish FVG to be swept to then look for internal 1m-5m IFVG/CISD to target. But if price tests the daily FVG first, i will then look for internal structure to take buys to BSL
Trade ideas

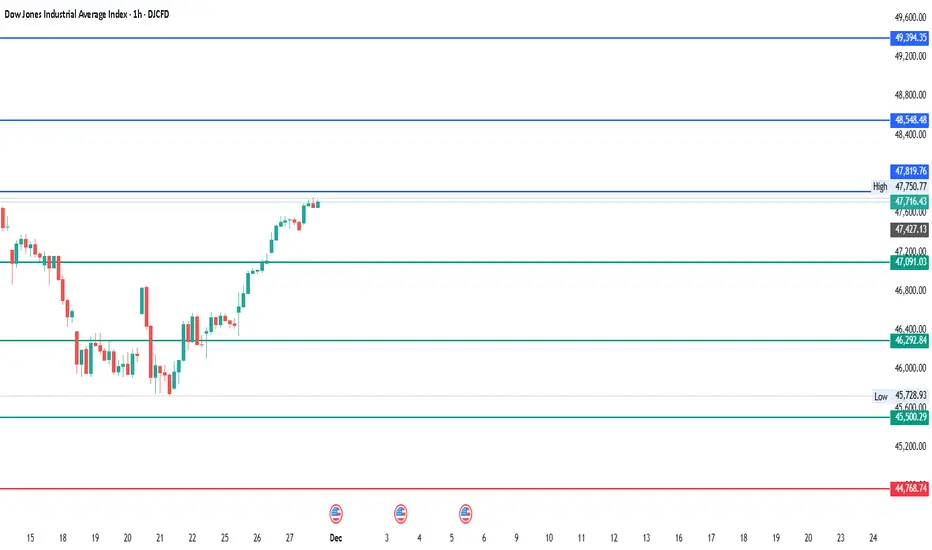
#DJI - 3,000 Points on Cards?Date: 01-12-2025
DJI - Current Price: $47,716
Pivot Point: $46,292.84 Support: $45,500.29 Resistance: $47,091.03
Upside Levels:
L1: $47,819.76 L2: $48,548.48 L3: $49,394.35 L4: $50,240.21
Downside Levels:
L1: $44,768.74 L2: $44,037.20 L3: $43,191.34 L4: $42,345.47
#TradingView #Nifty #BankNifty #DJI #NDQ #SENSEX #DAX #USOIL #GOLD #SILVER
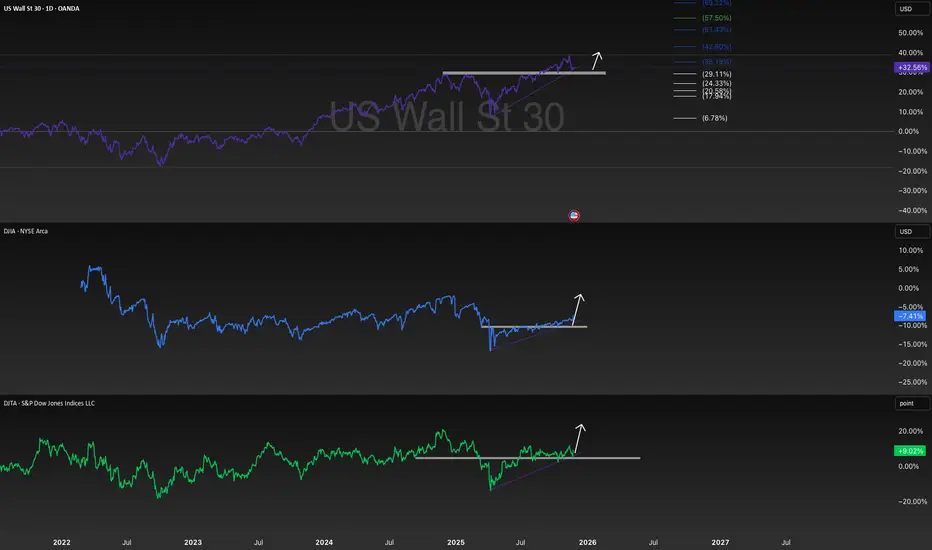
Technical Analysis: US Indices Continuation PatternsTechnical Analysis: US Indices Continuation Patterns 📈
Based on the provided chart, which displays the US Wall St 30 (Dow Jones Industrial Average CFD), the DJI (Dow Jones Industrial Average), and the DJTA (Dow Jones Transportation Average), a clear technical pattern suggests a continuation of the bullish trend across all three indices.
1. Pattern Identification: Ascending Triangles
The dominant chart pattern observed across the US Wall St 30, the DJI, and the DJTA is the Ascending Triangle formation.
Structure: This is a bullish continuation pattern characterized by a relatively flat horizontal resistance line (the highs) and a rising lower trendline (the lows).
Interpretation: The horizontal resistance indicates a level where selling pressure is persistent. The rising lower trendline, connecting progressively higher lows, demonstrates that buyers are becoming more aggressive over time, consistently stepping in to buy at higher prices. This indicates a buildup of buying pressure (accumulation) beneath the resistance level.
Resolution: The pattern is confirmed upon a decisive breakout above the horizontal resistance line, signaling that the buyers have finally overwhelmed the sellers and the prior uptrend is set to continue. The chart illustrates a potential breakout phase for all three indices, indicated by the upward arrows extending from the apex of the triangles.
2. Validation of Dow Theory Conditions
The relationship between the Dow Jones Industrial Average (DJI) and the Dow Jones Transportation Average (DJTA) is a key component of Dow Theory. The theory posits that for a major trend to be confirmed, both the Industrial and Transportation averages must move in the same direction.
Condition: An advance in the Industrial Average must be accompanied by a corresponding advance in the Transportation Average.
Chart Evidence:
DJI (Dow Jones Industrial Average): Shows the formation of a clear ascending triangle pattern, indicating an expected move to the upside (continuation of the uptrend).
DJTA (Dow Jones Transportation Average): Displays a very similar and concurrent ascending triangle pattern, also forecasting a move to the upside.
Conclusion: Since both the DJI and DJTA are exhibiting simultaneous, strong bullish continuation patterns (Ascending Triangles) and are currently posturing for a coordinated upward breakout, the charts provide a powerful confirmation of the primary bullish trend as per the requirements of Dow Theory. The technical setup across the major averages is congruent, strengthening the bullish thesis for the broader US market.
3. Price Targets and Confluence
The traditional method for setting a price target following an ascending triangle breakout is to measure the height of the back of the triangle (the widest part) and project that distance vertically from the point of the breakout.
US Wall St 30 (Top Panel):
The recent consolidation phase (Ascending Triangle) is preceded by a strong multi-year uptrend.
Fibonacci extension levels are marked above the resistance, which act as potential price targets following a breakout: 15.72% and 19.34% are visible targets, indicating a significant expected price movement upon confirmation.
The consolidation is occurring near recent all-time highs, suggesting a period of accumulation before the next leg higher.
Summary and Outlook
The technical analysis strongly supports a bullish continuation outlook for the indices. The presence of the Ascending Triangle continuation pattern on all three major US averages, coupled with the alignment of the DJI and DJTA, provides robust confirmation of the overall primary uptrend as per Dow Theory. A definitive breakout above the horizontal resistance lines would trigger the next major move higher, with price targets set by the measured move of the pattern and confirmed by the visible Fibonacci extension levels.
Disclaimer: This analysis is based solely on the provided chart and established technical analysis principles. It is for informational and educational purposes only and does not constitute investment advice. Trading involves substantial risk, and professional advice should be sought before making any investment decisions.
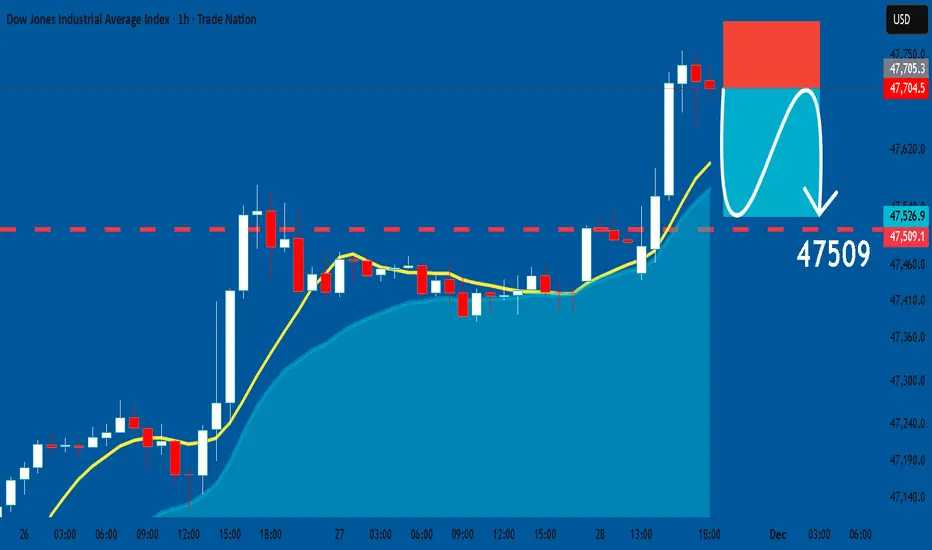
US30: Short Trade with Entry/SL/TP
US30
- Classic bearish formation
- Our team expects fall
SUGGESTED TRADE:
Swing Trade
Sell US30
Entry Level - 47705
Sl - 47798
Tp - 47509
Our Risk - 1%
Start protection of your profits from lower levels
Disclosure: I am part of Trade Nation's Influencer program and receive a monthly fee for using their TradingView charts in my analysis.
❤️ Please, support our work with like & comment! ❤️
Dow Jones Wave Analysis – 28 November 2025
- Dow Jones broke resistance zone
- Likely to rise to resistance level 48300.00
Dow Jones index recently broke the resistance zone between the resistance level 47000.00 and the 50% Fibonacci correction of the downward impulse c from the start of November.
The breakout of this resistance zone accelerated the active short-term impulse wave (iii).
Given strong multi-month uptrend, Dow Jones index can be expected to rise to the next resistance level 48300.00, which stopped the previous waves i and b.

DowJones key trading levels Key Support and Resistance Levels
Resistance Level 1: 47648
Resistance Level 2: 47830
Resistance Level 3: 48000
Support Level 1: 47130
Support Level 2: 47000
Support Level 3: 46867
This communication is for informational purposes only and should not be viewed as any form of recommendation as to a particular course of action or as investment advice. It is not intended as an offer or solicitation for the purchase or sale of any financial instrument or as an official confirmation of any transaction. Opinions, estimates and assumptions expressed herein are made as of the date of this communication and are subject to change without notice. This communication has been prepared based upon information, including market prices, data and other information, believed to be reliable; however, Trade Nation does not warrant its completeness or accuracy. All market prices and market data contained in or attached to this communication are indicative and subject to change without notice.

US30 Trade Set Up Nov 28 2025Price remains bullish. Price action isnt the cleanest due to the CME shutdown but i will want to see price sweep PDL, tap into daily FVG to then form 1m-5m IFVG/CISD to continue higher to BSL

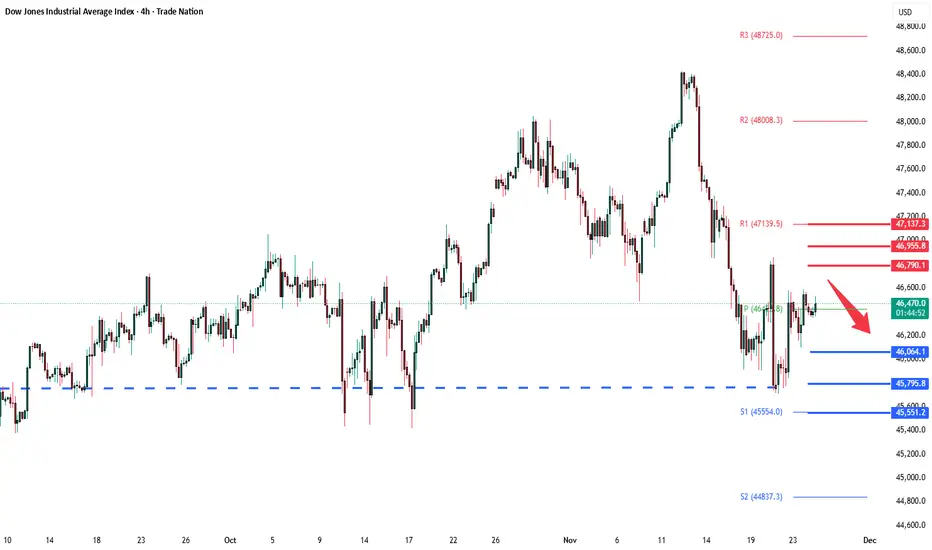
US30 H4 | Bearish Reaction off Key ResistanceMomentum: Bearish
Price is currently within the bearish ichimoku cloud.
Sell entry: 47,675.67
- Strong pullback resistance
- 71% Fib retracement
- 127.2% Fib extension
- 100% Fib projection
- Fair Value Gap
Stop Loss: 48,468.63
- Swing high resistance
Take Profit: 46,829.34
- Pullback support
High Risk Investment Warning
Stratos Markets Limited (tradu.com/uk ), Stratos Europe Ltd (tradu.com/eu ):
CFDs are complex instruments and come with a high risk of losing money rapidly due to leverage. 70% of retail investor accounts lose money when trading CFDs with this provider. You should consider whether you understand how CFDs work and whether you can afford to take the high risk of losing your money.
Stratos Global LLC (tradu.com/en ): Losses can exceed deposits.
Please be advised that the information presented on TradingView is provided to Tradu (‘Company’, ‘we’) by a third-party provider (‘TFA Global Pte Ltd’). Please be reminded that you are solely responsible for the trading decisions on your account. Any information and/or content is intended entirely for research, educational and informational purposes only and does not constitute investment or consultation advice or investment strategy. The information is not tailored to the investment needs of any specific person and therefore does not involve a consideration of any of the investment objectives, financial situation or needs of any viewer that may receive it. Past performance is not a reliable indicator of future results. Actual results may differ materially from those anticipated in forward-looking or past performance statements. We assume no liability as to the accuracy or completeness of any of the information and/or content provided herein and the Company cannot be held responsible for any omission, mistake nor for any loss or damage including without limitation to any loss of profit which may arise from reliance on any information supplied by TFA Global Pte Ltd.

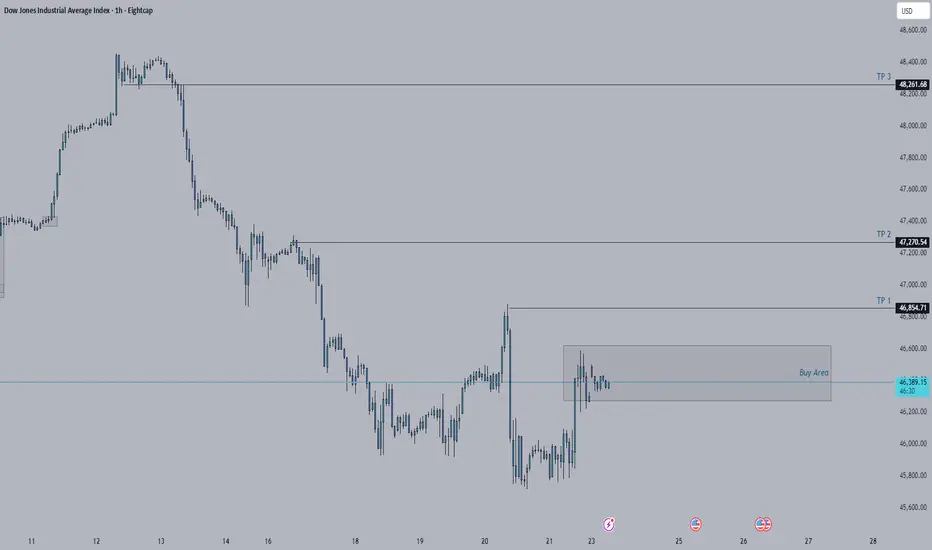
US30 Bullish AnalysisI'm biased for Buy in US30. In daily time frame it's showing buy for me though to be safe I have my TP 1 in the previous structure cause for sure there's going to be a lot of traders who will go short since the weekly is showing that it is going short.
DOW JONES INDEX GOES 'CUP AND HANDLE' PATTERN. HERE'S WHYA cup and handle is a bullish technical analysis pattern that signals a continuation of an uptrend and a potential buying opportunity. It appears as a U-shape (cup), followed by a slight decline or consolidation (handle), after which further price gains are expected. The pattern was popularized by William O'Neil in 1988.
Cup and Handle
Cup: A U-shaped movement that forms when an asset's price, after a rally, initially pulls back and then recovers to its previous highs.
Handle: After completing the cup, a slight correction or consolidation occurs, appearing as a downward-sloping line, sometimes shaped like a small cup. The handle typically forms on lower trading volume.
How it works
Buy: Traders look for a breakout from the handle amid rising trading volume, which is considered a buy signal. Trend Continuation: The pattern indicates that after a short pause, the asset is likely to continue its upward movement.
Target Calculation: The target price is often calculated by measuring the cup height and adding it to the breakout price to forecast the potential price movement.
What to Consider
The pattern can form on various timeframes, from intraday to monthly charts.
It is important to pay attention to the depth of the cup and handle, as well as the trading volume that confirms the signal.
Due to nearly 50% retrace we consider to take it up rn.
--
Best wishes,
@PandorraResearch Team

US30 Trade Secured 1500 PipsTrade played out perfectly, sweeping SSL in London session, inverting and engulfing on the 15m and 1h to the upside followed by a HL on the 15m to target daily FVG

DowJones Key Trading LevelsKey Support and Resistance Levels
Resistance Level 1: 47450
Resistance Level 2: 47575
Resistance Level 3: 27740
Support Level 1: 46865
Support Level 2: 46740
Support Level 3: 46600
This communication is for informational purposes only and should not be viewed as any form of recommendation as to a particular course of action or as investment advice. It is not intended as an offer or solicitation for the purchase or sale of any financial instrument or as an official confirmation of any transaction. Opinions, estimates and assumptions expressed herein are made as of the date of this communication and are subject to change without notice. This communication has been prepared based upon information, including market prices, data and other information, believed to be reliable; however, Trade Nation does not warrant its completeness or accuracy. All market prices and market data contained in or attached to this communication are indicative and subject to change without notice.

US30 – Big Money Battle | A Clear Institutional FootprintBefore the main move happened, Smart Money had already left a clear footprint.
A bullish Order Block was broken, and a new OB formed at the top — marking an important zone for institutional positioning.
When price retested this OB, a massive clash between Big Money players occurred:
• Large-bodied Doji candle → heavy order absorption
• Abnormal volume spike → strong institutional involvement
After the battle, the winning Big Money group pushed price upward and shifted the structure decisively.
🔍 VVNShark-OB 4-Point Analysis
Market Structure:
A previous bullish OB was broken → early sign of Smart Money movement.
OB + Volume Reaction:
The retest created a huge Doji candle with unusually thick volume.
Liquidity Battle:
Two groups of Big Money fought for control at the exact same price zone.
Outcome:
The winning institutional side pushed price upward with strong displacement.
🦈 Signature
— VNShark-OB | Smart-Money Footprint Analysis
#US30 #DJI #BigMoney #OrderBlock #SmartMoney #Liquidity #VolumeAnalysis #InstitutionalFlow #VSharkOB

possibility of uptrendGiven the behavior of the index in the current resistance area, possible scenarios have been identified. It is expected that after some fluctuation and correction, the continuation of the upward trend will take place.

us30 BuyInternally price is bullish and also price sweeped the asia low and went to the upside which is a sign to continue higher.

US30 Trade Set Up Nov 25 2025Price remains bullish and has swept SSL already in Asia and London followed by a 1h engulfing and CISD so i will wait for more internal bullish structure on the 5m before looking for buys above PDH to target BSL

DowJones key trading levelsKey Support and Resistance Levels
Resistance Level 1: 46790
Resistance Level 2: 46955
Resistance Level 3: 47140
Support Level 1: 46065
Support Level 2: 45795
Support Level 3: 45550
This communication is for informational purposes only and should not be viewed as any form of recommendation as to a particular course of action or as investment advice. It is not intended as an offer or solicitation for the purchase or sale of any financial instrument or as an official confirmation of any transaction. Opinions, estimates and assumptions expressed herein are made as of the date of this communication and are subject to change without notice. This communication has been prepared based upon information, including market prices, data and other information, believed to be reliable; however, Trade Nation does not warrant its completeness or accuracy. All market prices and market data contained in or attached to this communication are indicative and subject to change without notice.
Us301. Higher Timeframe Bias (HTF)
Check these 4 only:
• Monthly → Bullish or Bearish?
• Weekly → Bullish or Bearish?
• Daily → Bullish or Bearish?
• 4H → Bullish or Bearish?
👉 Only trade in the direction where most timeframes agree.
⸻
2. 15-Minute Structure
• Did the 15m break structure (BOS) up for buys or down for sells?
• Did price come back to retest that level?
👉 If no BOS → NO TRADE
👉 If no retest → WAIT
⸻
3. 20 EMA Confirmation (15m)
• Buys: Price ABOVE 20 EMA
• Sells: Price BELOW 20 EMA
This confirms momentum in your direction.
⸻
4. Entry Candle Confirmation
Choose your execution timeframe (15m or 5m):
• Buy: Bullish engulfing or strong bullish candle
• Sell: Bearish engulfing or strong bearish candle
This tells you the retest is holding.
⸻
5. Exact Trade Levels
This makes everything crystal clear:
BUY Example
• Entry: 37,920
• Stop-Loss: 37,820 (100 points below)
• Take Profit (2:1): 38,120
• Optional 4:1 target: 38,320 (only if confluence is extremely high)
SELL Example
• Entry: 37,920
• Stop-Loss: 38,020 (100 points above)
• Take Profit (2:1): 37,720
⸻
⭐ Simple 1–2–3 Summary
1. Bias → Are most timeframes all bullish or bearish?
2. Structure → BOS + Retest?
3. Entry → EMA + Strong candle + Clear SL + Clear TP.

Dow Jones Wave Analysis – 24 November 2025
- Dow Jones reversed from support area
- Likely to rise to resistance level 47000.00
Dow Jones index recently reversed from support area between the key support level 45800.00 (which has been reversing the price from September), lower daily Bollinger Band and the 50% Fibonacci correction of the upward impulse from July.
The upward reversal from this support area stopped the previous short-term ABC correction 2.
Given the clear daily uptrend, Dow Jones index can be expected to rise to the next resistance level 47000.00 (top of the previous wave B).

US30 Trade Secured 2500 PipsPlayed out perfectly, sweeping SSl and London lows to then engulf and invert on the 5m to target PDL/BSL


US30 Trade Set Up Nov 24 2025Price has swept 1h SSL in London and engulfed 1h bearish candle so i want to see a internal 15m SSL swept followed by 1m-5m IFVG/CISD to target PDH

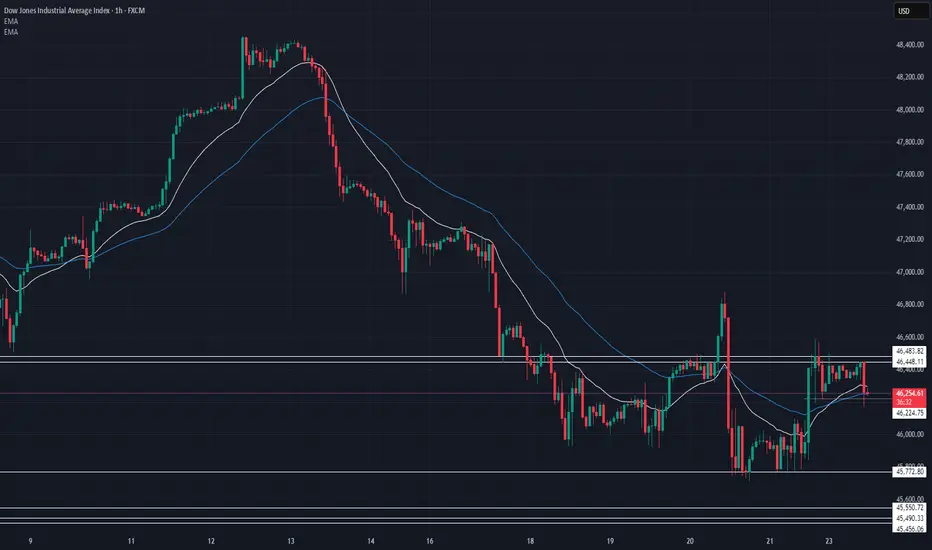
US30 Technical Breakdown – 11/24/2025📍 US30 Technical Breakdown – 11/24/2025
US30 showing signs of early recovery after last week’s heavy selloff, but still struggling to break above the 46,450–46,500 intraday resistance zone. Price remains below key EMAs, meaning sellers still hold the structural advantage unless bulls reclaim higher levels 🔎📉
After tapping demand around 45,770–45,900, buyers stepped in, but momentum is weak as long as the index stays under the 46,500 ceiling.
📊 Market Behavior:
🔹 Price rejecting 46,450–46,500 repeatedly → strong short-term supply
🔹 EMAs still sloping bearish → momentum favors sellers
🔹 Range-style behavior forming between 46,000–46,500
🔹 Bulls need a clean reclaim above EMAs for trend shift
📌 Key Levels:
Resistance:
🔹 46,450–46,500 → major intraday ceiling
🔹 46,780 → breakout extension
🔹 47,000 → structural shift zone
Support:
🔹 46,120 → weak intraday support
🔹 45,900 → key reaction zone
🔹 45,770 → major demand / bottom of range
🔹 45,456 – 45,320 → higher-timeframe demand
🧠 Bias:
Overall structure still bearish unless 46,500 breaks
📉 Sellers hold control beneath EMAs
⬆️ Break & close above 46,500 → opens move toward 46,780–47,000
⬇️ Rejection at 46,500 + break back under 46,120 → signals continuation lower