Trade ideas

Us30 before NFP newsMy directional bias was bullish according to how yesterday's Daily candle closed and the change of trend

US30 Trade Set Up Nov 20 2025Over all im still bearish for indices so i want to see a sweep of BSL and tap into fib levels to then wait for for 5m-15m bearish engulfing and CISD/IVFG to target SSL/PDL

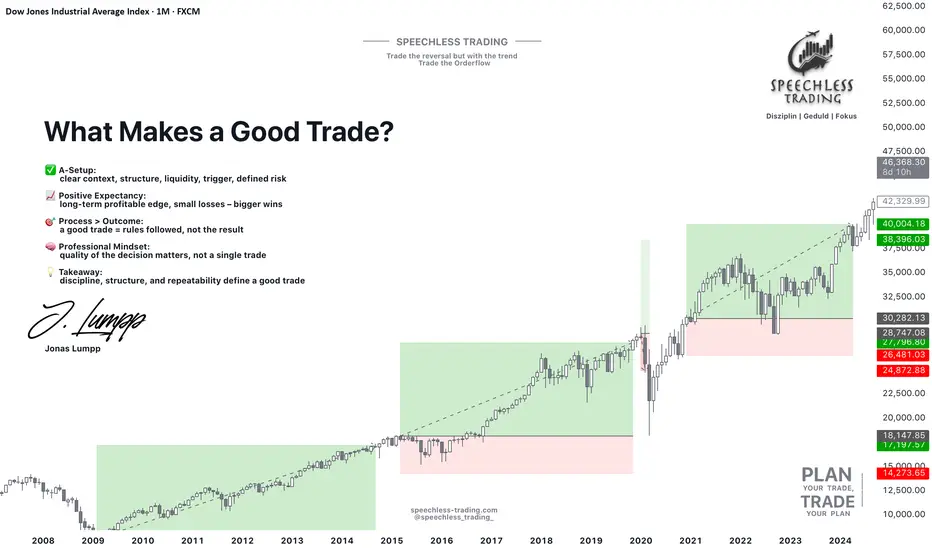
The Anatomy of a Good Trade: Focus on Decisions, Not ResultsLet's find out - what is a good trade?
Most beginners answer: a trade that makes money.
But in professional trading, a good trade has nothing to do with the outcome.
It has everything to do with the quality of the decision.
1️⃣ A good trade starts with an A-Setup:
An A-Setup is not a feeling — it’s a repeatable pattern with structure and logic.
✔ Clear market context
✔ Direction aligned with market structure
✔ Liquidity levels identified
✔ Entry trigger confirmed
✔ Risk defined before the trade
If one of these is missing, it’s no longer an A-Setup — it’s hope.
2️⃣ A good trade has positive expectancy:
Winning one trade means nothing. Winning a sample size of 100 tells you everything.
A positive expectancy means your setup:
loses small - wins bigger - and performs consistently over time
You don’t need to win every trade — you need a system where the average outcome is in your favor.
3️⃣ A good trade follows process, not emotion:
A professional doesn’t judge a trade by profit or loss. They judge it by one question:
“Did I execute my plan without breaking the rules?”
If yes → it was a good trade. Even if it ended in a loss.
Because long-term success comes from repeatable behavior, not from chasing single outcomes.
The Truth:
➡️ A good trade is not defined by green or red.
➡️ A good trade is defined by discipline, structure, and execution.
If beginners understood this idea, half of their frustration would disappear.
Thanks for reading, and have a great start to your trading week!
Let us know in the comments if you found this post valuable - and we might create a full series on applied trading psychology.
Jonas Lumpp
Speechless Trading
Disclaimer: This tutorial is for educational purposes only and does not constitute financial advice. Its goal is to help traders develop a professional mindset, improve risk management, and make more structured trading decisions.
US30 – Key Levels Ahead of NFP | Bearish Below 46420–46600US30 – Market Outlook | Bearish Below 46420, Bullish Above 46600
US30 is set for high volatility today as traders react to the NFP report.
Below 46420 / 46600: Bearish continuation toward 46250 → 46000 → 45680
Above 46600: Bullish breakout toward 46920 → 47080
Pivot: 46420
Support: 46250 · 46000 · 45680
Resistance: 46600 · 46910 · 47080
US30 stays bearish while below 46420–46600; only a confirmed close above 46600 will shift momentum to the upside.

Dow into the open.Thursday 20th NovemeberLooks very sad,..trying to get happy with a new uptrend
Will it succeed.?

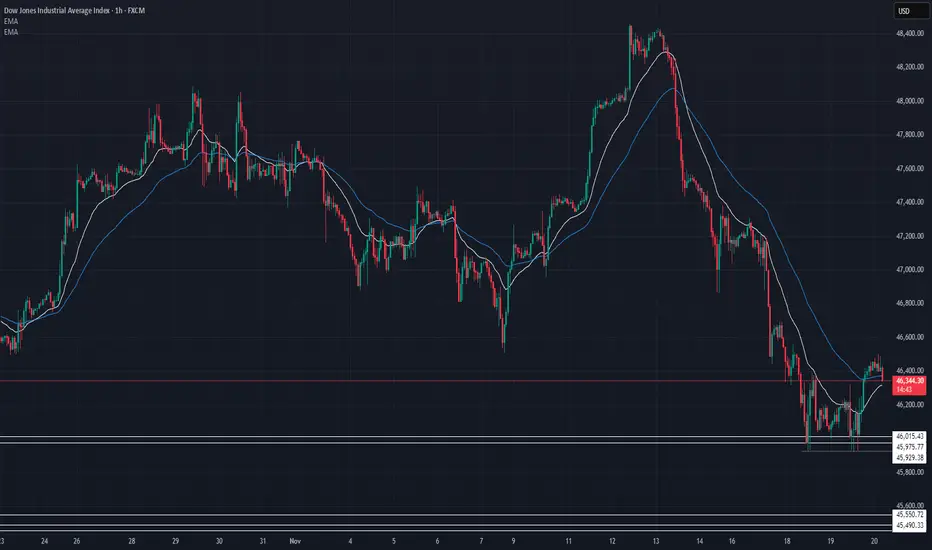
US30 Technical Breakdown – 11/20/2025📍 US30 Technical Breakdown – 11/20/2025
US30 finally found temporary support around 45,950–46,000 after a massive selloff from the 48,400 highs. Price is now retracing into the EMA zone, but momentum is still bearish overall — meaning this bounce may just be a pullback unless buyers reclaim key levels 👀📉.
📊 Market Behavior:
🔹 Heavy downside momentum after failing to hold 47,600
🔹 EMAs still stacked bearish → sellers in control
🔹 Current move = corrective bounce into resistance
📌 Key Levels:
🔹 Resistance:
46,600 → current retest zone (EMA rejection likely)
46,800 → strong intraday supply / former support
47,000 → major pivot level
🔹 Support:
46,150 → intraday bounce area
45,975 → structure support
45,929 → micro-demand
45,600 → next major liquidity pocket
🧠 Bias:
Bearish momentum still dominant 📉
⬇️ Rejection under 46,600 → continuation lower
⬆️ Break + hold above 46,800 → opens room toward 47,000–47,200
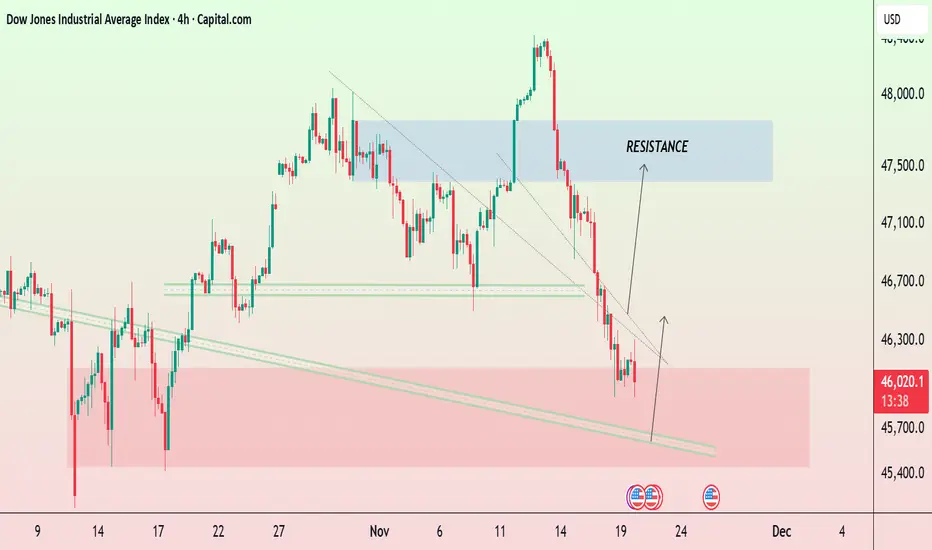
US30 ForecastUS30 Dow Jones is currently declining within a descending channel and approaching a major demand zone near 45,700–45,900 Price has reacted from the lower trendline, signalling potential bullish reversal.
A breakout above the minor descending trendline could trigger a push toward 46,700–47,500 resistance zone the blue zone marks strong supply/resistance where previous rallies were rejected. overall structure shows bearish pressure short-term but potential recovery from support if buyers step in.
"Thank you for your support! If you found this idea valuable or learned something new, please consider liking and leaving a comment. I’d really appreciate hearing your feedback and thoughts."
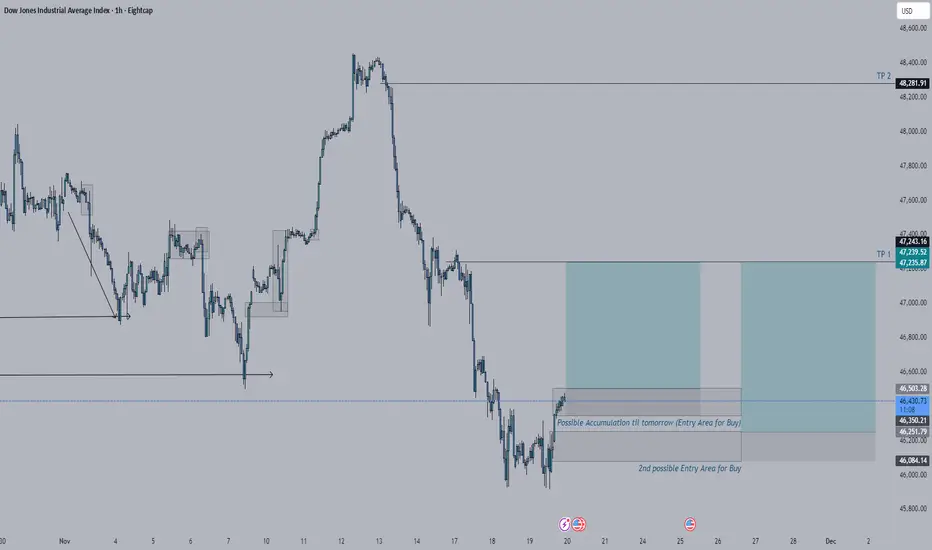
US30 Bullish MovementI'm biased for buy on US30. I have 2 area that I'm watching for entry but I think the market will just be accumulating in one area make a bit of a push to the downside within the area where it is currently accumulating then continue to push the market tomorrow. For TP, I'm actually eyeing more in the TP 2 but there will be going to be a reaction around the TP 1 that will be something to look at for another entry for buy.
US30 Trade Secured 1500 PipsSet up played out perfectly, BOS on the 1h, sweep SSL, 5m IFVG and engulfing candle to move up towards BSL

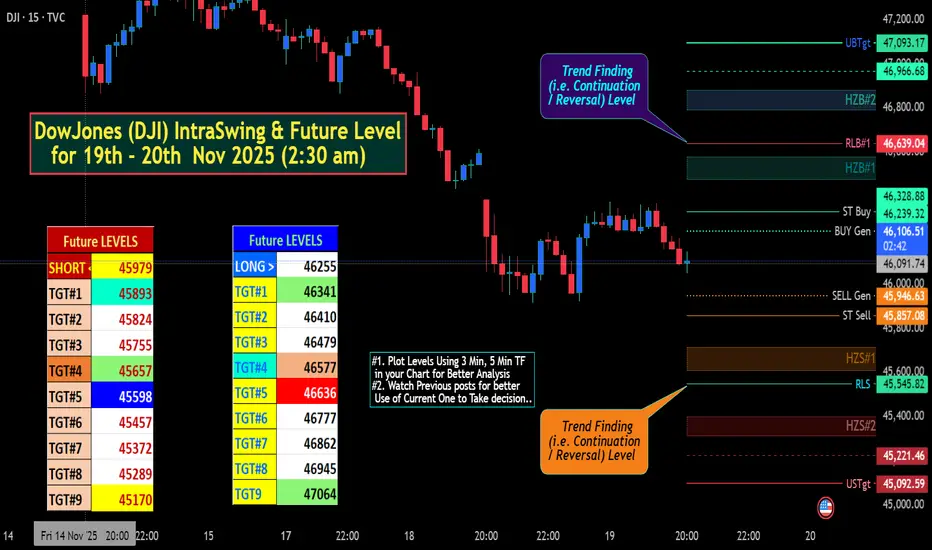
DowJones (DJI) IntraSwing & Future Level for 19th-20th Nov 2025DowJones (DJI) IntraSwing & Future Level for 19th - 20th Nov 2025 (2:30 am)
✍🏼️ "Future IntraSwing Levels" mentioned in BOX format.
Useful to Tally / Recognize for Next day Trade Plan.
[ Level Interpretation / description:
L#1: If the candle crossed & stays above the “Buy Gen”, it is treated / considered as Bullish bias.
L#2: Possibility / Probability of REVERSAL near RLB#1 & UBTgt
L#3: If the candle stays above “Sell Gen” but below “Buy Gen”, it is treated / considered as Sidewise. Aggressive Traders can take Long position near “Sell Gen” either retesting or crossed from Below & vice-versa i.e. can take Short position near “Buy Gen” either retesting or crossed downward from Above.
L#4: If the candle crossed & stays below the “Sell Gen”, it is treated / considered a Bearish bias.
L#5: Possibility / Probability of REVERSAL near RLS#1 & USTgt
HZB (Buy side) & HZS (Sell side) => Hurdle Zone,
*** Specialty of “HZB#1, HZB#2 HZS#1 & HZS#2” is Sidewise (behaviour in Nature)
Rest Plotted and Mentioned on Chart
Color code Used:
Green =. Positive bias.
Red =. Negative bias.
RED in Between Green means Trend Finder / Momentum Change
/ CYCLE Change and Vice Versa.
Notice One thing: HOW LEVELS are Working.
Use any Momentum Indicator / Oscillator or as you "USED to" to Take entry.
⚠️ DISCLAIMER:
The information, views, and ideas shared here are purely for educational and informational purposes only. They are not intended as investment advice or a recommendation to buy, sell, or hold any financial instruments. I am not a SEBI-registered financial adviser.
Trading and investing in the stock market involves risk, and you should do your own research and analysis. You are solely responsible for any decisions made based on this research.
"As HARD EARNED MONEY IS YOUR's, So DECISION SHOULD HAVE TO BE YOUR's".
Do comment if Helpful .
In depth Analysis will be added later (If time Permits)
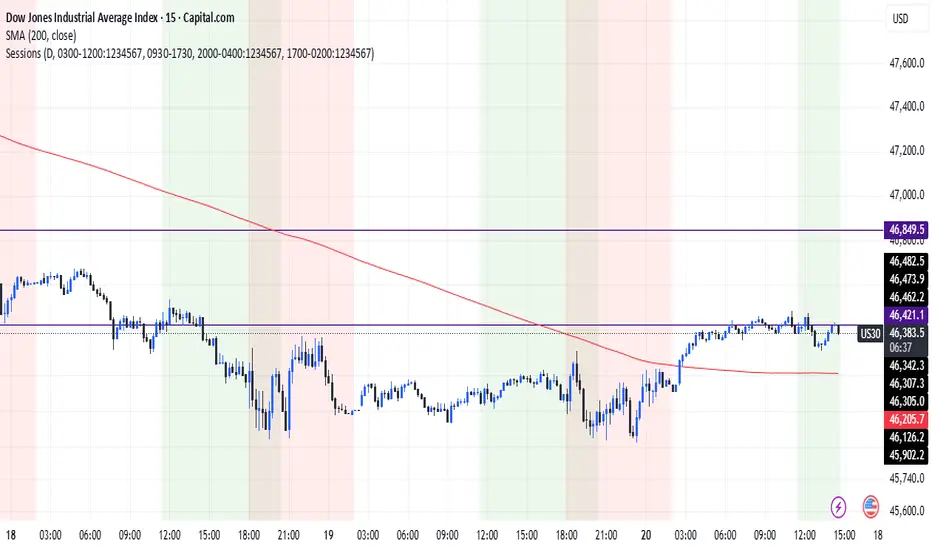
Dow Weakens Under Key Resistance | Sellers in ControlUS30 | Overview
The Dow Jones maintains a bearish trend while trading below 46410, with momentum favoring a move toward 46000, and a further decline toward 45680 if that level breaks.
A bullish recovery will only be possible if the price closes above 46600, which would open the path toward 46920.
Key Levels
Pivot Line: 46410
Support: 46000 · 45800 · 45290
Resistance: 46600 · 46910
Outlook:
US30 remains bearish while below 46410, targeting 46000–45680.
A confirmed break above 46600 would shift momentum toward 46920.

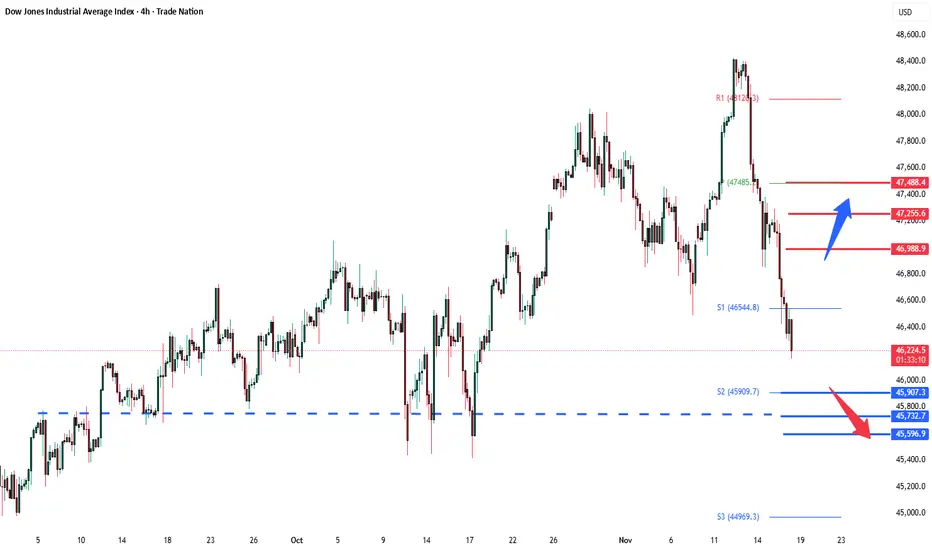
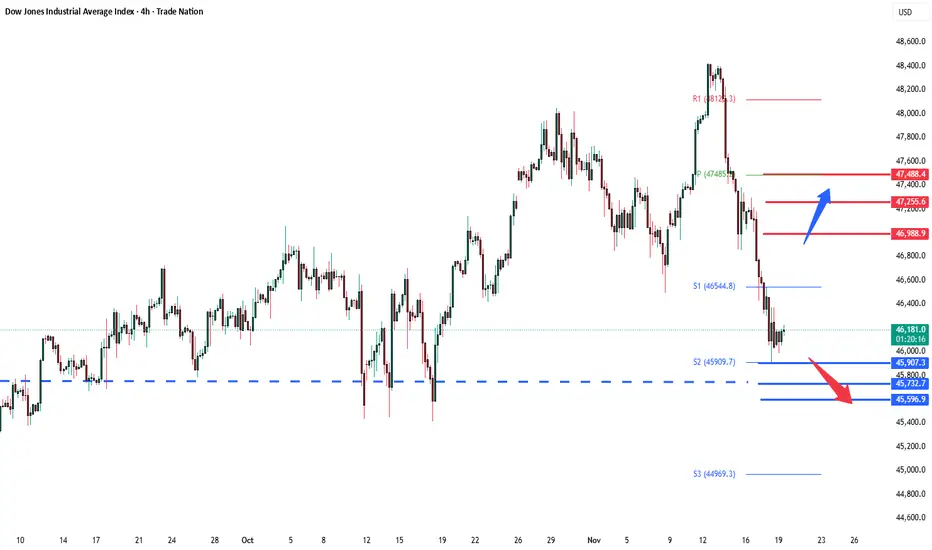
DowJones support retest at 45907Key Support and Resistance Levels
Resistance Level 1: 46988
Resistance Level 2: 47255
Resistance Level 3: 47488
Support Level 1: 45907
Support Level 2: 45732
Support Level 3: 45600
This communication is for informational purposes only and should not be viewed as any form of recommendation as to a particular course of action or as investment advice. It is not intended as an offer or solicitation for the purchase or sale of any financial instrument or as an official confirmation of any transaction. Opinions, estimates and assumptions expressed herein are made as of the date of this communication and are subject to change without notice. This communication has been prepared based upon information, including market prices, data and other information, believed to be reliable; however, Trade Nation does not warrant its completeness or accuracy. All market prices and market data contained in or attached to this communication are indicative and subject to change without notice.
US30 Trade Set Up Nov 19 2025Us30 is still in a overall bearish trend but there is a lot of daily imbalance above that needs to be filled eventually if we sweep SSL and stay closed above, i will look for internal 1m-5m IFVG/CISD to target BSL/PDH

DOW JONES Will the 1D MA100 save the day?Dow Jones (DJI) has been trading within a 6-month Channel Up and in the past 4 days it has been correcting on its latest Bearish Leg. By doing so, it broke below the 1D MA50 (blue trend-line) and is approaching the 1D MA100 (green trend-line) right at the bottom of the pattern.
This is the Channel's last Support. As long as it closes the daily candles above it, we will be bullish on Dow, targeting 49000, which represents a +7.25% rise, something all previous 3 Bullish Legs did.
---
** Please LIKE 👍, FOLLOW ✅, SHARE 🙌 and COMMENT ✍ if you enjoy this idea! Also share your ideas and charts in the comments section below! This is best way to keep it relevant, support us, keep the content here free and allow the idea to reach as many people as possible. **
---
💸💸💸💸💸💸
👇 👇 👇 👇 👇 👇

IS IT A VALID BREAKOUT RIGHT NOW?Broken strong uptrend is a sign of the bull trend has ended.
I would SELL with SL on the ATH and see how low the bear could go.
CHEEERRRSSS..!!!

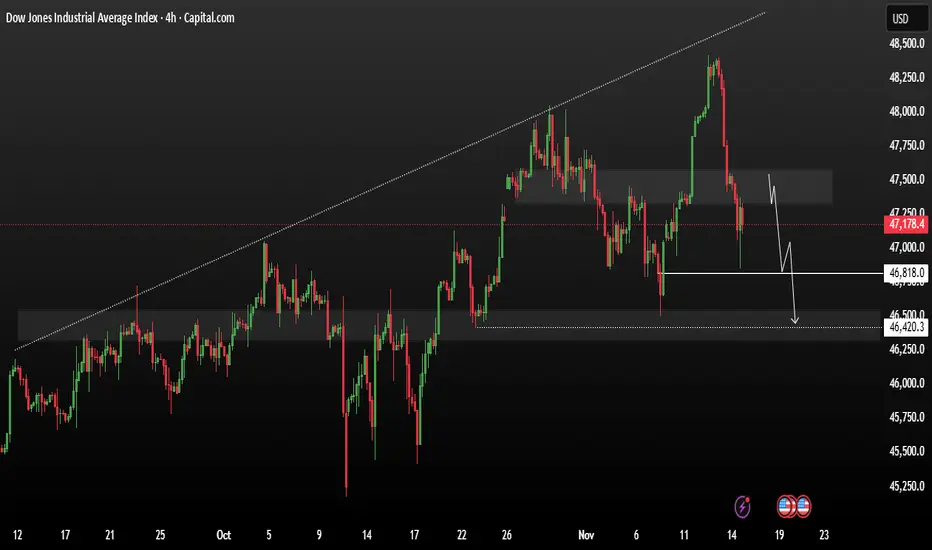
US30 remains in a bearish trend toward support levels.US30 remains in a bearish trend. The price may first retest a resistance zone, but unless there is a confirmed bullish breakout, the expectation is for another decline toward support levels.
From a market sentiment perspective, U.S. indices closed mixed on Friday as investors look ahead to Nvidia’s upcoming earnings release next week and remain cautious due to concerns that the Federal Reserve may delay cutting interest rates in December.
If price fails to hold above 47,500 and closes below resistance and price move to downside and there potentially target point will be 46,818 to 46,420
You may find more details in the chart,
Trade wisely best of Luck.
Ps; Support with like and comments for better analysis Thanks for Supporting.
#DJI - 1500 Point Move on Cards?Date: 13-11-2025
#DJI Current Price: $48,254.83
Pivot Point: $48,160.50 Support: $47,650.55 Resistance: $48,673.16
Upside Levels:
L1: $48,957.83 L2: $49,242.50 L3: $49,648.25 L4: $50,054.00
Downside Levels:
L1: $47,364.53 L2: $47,078.50 L3: $46,672.75 L4: $46,267.00
#Tradingview #DJI #NDX #NIFTY #BTC #GOLD

Dow At The End Of The TrendDow Jones Index has been showing us negative divergences both on the monthly and weekly charts. Macd on the weekly has crossed downwards. Everybody is talking about Berkshire Hathaway buying Google stocks but overlook the fact that they have been selling Bank of America. The reason why they have been selling BAC is not something I can answer. All I can see is that the technicals show weakness and we are at the edge of a 3 leg downtrend.

US30 Trade Set Up Nov 18 2025Price is showing strong bearish movement, creating LL/LH on the 1h and 15m and has BOS on the 15m so first id want to see price sweep internal BSL and tap into 15m or 1h FVG before looking for a continuation back down to lower SSL and 4h FVG

DowJones Key Trading LevelsKey Support and Resistance Levels
Resistance Level 1: 46988
Resistance Level 2: 47255
Resistance Level 3: 47488
Support Level 1: 45907
Support Level 2: 45732
Support Level 3: 45600
This communication is for informational purposes only and should not be viewed as any form of recommendation as to a particular course of action or as investment advice. It is not intended as an offer or solicitation for the purchase or sale of any financial instrument or as an official confirmation of any transaction. Opinions, estimates and assumptions expressed herein are made as of the date of this communication and are subject to change without notice. This communication has been prepared based upon information, including market prices, data and other information, believed to be reliable; however, Trade Nation does not warrant its completeness or accuracy. All market prices and market data contained in or attached to this communication are indicative and subject to change without notice.