US30 H4 | Bearish ReversalDow Jones (US30) is reacting off the sell entry, which aligns with hte 161.8% Fibonacci extension and the 61.8% Fibonacci projection, and could drop from this level to the downside.
Sell entry is at 47,651.31, which lines up with the 161.8% Fibonacci extension and the 61.8% Fibonacci projection.
Stop loss is at 48,228.80, whic lines up with the 100% Fibonacci projection.
Take profit is at 46,892.33, which is an overlap support that lines u;p with hte 38.2% Fibonacci retracement.
Stratos Markets Limited (tradu.com ):
CFDs are complex instruments and come with a high risk of losing money rapidly due to leverage. 68% of retail investor accounts lose money when trading CFDs with this provider. You should consider whether you understand how CFDs work and whether you can afford to take the high risk of losing your money.
Stratos Europe Ltd (tradu.com ):
CFDs are complex instruments and come with a high risk of losing money rapidly due to leverage. 70% of retail investor accounts lose money when trading CFDs with this provider. You should consider whether you understand how CFDs work and whether you can afford to take the high risk of losing your money.
Trade ideas

Us30-reversal pattern spotted
-will be scalping since there's no break and retest
-shorts will be my investment


US30 H1 | Bearish Reversal Off Pullback ResistanceThe price is rising towards the sell entry at 47,761.94, whichis a pullback resistance that aligns with the 50% Fibonacci retracement and could reverse from this level to the downside.
Stop loss is at 48,079.25, which is a multi-swing high resistance.
Take profit is at 47,337.75, which is a pullback support that is slightly above the 50% Fibonacci retracement.
Stratos Markets Limited (tradu.com ):
CFDs are complex instruments and come with a high risk of losing money rapidly due to leverage. 68% of retail investor accounts lose money when trading CFDs with this provider. You should consider whether you understand how CFDs work and whether you can afford to take the high risk of losing your money.
Stratos Europe Ltd (tradu.com ):
CFDs are complex instruments and come with a high risk of losing money rapidly due to leverage. 70% of retail investor accounts lose money when trading CFDs with this provider. You should consider whether you understand how CFDs work and whether you can afford to take the high risk of losing your money.

US30 Massive Short! SELL!
My dear friends,
Please, find my technical outlook for US30 below:
The instrument tests an important psychological level 47206
Bias - Bearish
Technical Indicators: Supper Trend gives a precise Bearish signal, while Pivot Point HL predicts price changes and potential reversals in the market.
Target - 46982
Recommended Stop Loss - 47329
About Used Indicators:
Super-trend indicator is more useful in trending markets where there are clear uptrends and downtrends in price.
Disclosure: I am part of Trade Nation's Influencer program and receive a monthly fee for using their TradingView charts in my analysis.
———————————
WISH YOU ALL LUCK

US30: Move Down Expected! Short!
My dear friends,
Today we will analyse US30 together☺️
The recent price action suggests a shift in mid-term momentum. A break below the current local range around 47,135.50 will confirm the new direction downwards with the target being the next key level of 46,998.29 and a reconvened placement of a stop-loss beyond the range.
❤️Sending you lots of Love and Hugs❤️
DowJones bullish reaction to US 3% Inflation dataKey Support and Resistance Levels
Resistance Level 1: 47156
Resistance Level 2: 47285
Resistance Level 3: 47413
Support Level 1: 46450
Support Level 2: 46270
Support Level 3: 46126
This communication is for informational purposes only and should not be viewed as any form of recommendation as to a particular course of action or as investment advice. It is not intended as an offer or solicitation for the purchase or sale of any financial instrument or as an official confirmation of any transaction. Opinions, estimates and assumptions expressed herein are made as of the date of this communication and are subject to change without notice. This communication has been prepared based upon information, including market prices, data and other information, believed to be reliable; however, Trade Nation does not warrant its completeness or accuracy. All market prices and market data contained in or attached to this communication are indicative and subject to change without notice.

DowJoned bullish breakout supported at 47260Key Support and Resistance Levels
Resistance Level 1: 48085
Resistance Level 2: 48255
Resistance Level 3: 48500
Support Level 1: 47260
Support Level 2: 47040
Support Level 3: 46880
This communication is for informational purposes only and should not be viewed as any form of recommendation as to a particular course of action or as investment advice. It is not intended as an offer or solicitation for the purchase or sale of any financial instrument or as an official confirmation of any transaction. Opinions, estimates and assumptions expressed herein are made as of the date of this communication and are subject to change without notice. This communication has been prepared based upon information, including market prices, data and other information, believed to be reliable; however, Trade Nation does not warrant its completeness or accuracy. All market prices and market data contained in or attached to this communication are indicative and subject to change without notice.

US30 - Intraday Playbook for NY Session 27/10/2025Here’s my structured 15M game plan heading into the US session today. We’re currently sitting inside a bullish trend, but we’re also at a point where price could either continue higher or shift momentum if key demand levels fail. So I’m prepared for both bullish continuation and a possible bearish reversal scenario.
✅ Overall Trend Context:
Higher highs / higher lows remain intact on the 4H / 1H.
Recent bullish leg may need a liquidity sweep / pullback before continuation.
Key intraday structure levels are now clearly defined.
📈 Bullish Continuation Scenario (Primary Bias)
I’ll look for long setups if price pulls back into demand zones and shows bullish rejection.
⚠️ Valid only while price holds above 47,200.
✅ Long Zone #1: 47,300 – 47,350 (first demand / shallow pullback zone)
✅ Long Zone #2: 47,150 – 47,200 (deeper liquidity pool)
Bullish Confirmation Triggers (15M or 5M):
Rejection wick from demand
Bullish engulfing / candle flip
Break of minor 5M structure after tap
🎯 Bullish Targets:
TP1: 47,450 (reaction zone)
TP2: 47,500 – previous high
TP3: 47,600+ if momentum extends
📉 Bearish Reversal Scenario (Alternate Plan)
I will only shift bearish if price breaks below the key higher-low level.
🔻 Bearish bias becomes active if we break & hold below 47,200.
✅ Plan: Wait for a break → retest of 47,200 – 47,250 as resistance → look for rejection
(5M / 15M bearish engulfing, failed reclaim, or lower high confirmation)
🎯 Bearish Targets:
TP1: 47,050 – first liquidity pocket
TP2: 46,900 – prior swing low / demand zone
TP3: 46,750 – deeper structural support
📍 Key Notes
✅ I won’t chase anything at market open — I’ll wait for liquidity grab and confirmation.
❌ No longs if 47,200 breaks decisively and turns into resistance.
❌ No shorts while above 47,200 unless a clear fakeout rejection occurs at 47,500.

Us30 long US30 (Dow Jones Index) – Market Outlook & Trade Setup
Currently observing a potential bullish reaction from the demand zone around the 47,500 region after multiple rejections at this level.
If price maintains above this support, I’m anticipating a continuation toward the 48,180 area — aligning with prior liquidity and supply levels.
This setup combines:
• Structure confirmation from previous higher lows
• Demand zone retest for potential entry
• Clear risk-to-reward framework with defined targets
Patience and precision remain key. Let’s see how price action develops going into the next session. 📊
#US30 #MarketAnalysis #TradingInsights #DowJones #TechnicalAnalysis #FinancialMarkets

DowJones key support at 47260Key Support and Resistance Levels
Resistance Level 1: 48085
Resistance Level 2: 48255
Resistance Level 3: 48500
Support Level 1: 47260
Support Level 2: 47040
Support Level 3: 46880
This communication is for informational purposes only and should not be viewed as any form of recommendation as to a particular course of action or as investment advice. It is not intended as an offer or solicitation for the purchase or sale of any financial instrument or as an official confirmation of any transaction. Opinions, estimates and assumptions expressed herein are made as of the date of this communication and are subject to change without notice. This communication has been prepared based upon information, including market prices, data and other information, believed to be reliable; however, Trade Nation does not warrant its completeness or accuracy. All market prices and market data contained in or attached to this communication are indicative and subject to change without notice.

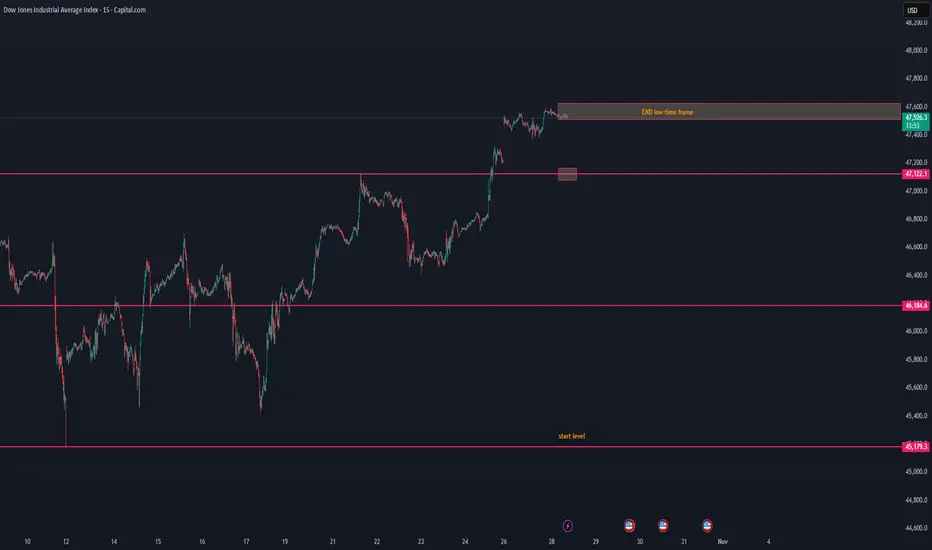
US30 lost its low time frame — possible breakdown aheadUS30 lost its low time frame — possible breakdown ahead ⚠️
US30 has lost its low time frame structure, showing early signs of weakness after the recent push to 47.5K.
The current price action suggests that momentum is fading, and sellers may start to take control.
📉 Short-term view:
Structure break below 47.5K zone confirms loss of bullish control.
The next visible support area sits around 47.1K, followed by 46.1K.
With time, price could continue to drift down toward the start level near 45.1K if buyers fail to defend.
📊 Observation:
Volume has started to cool off, and price is trading below the short-term EMA range — a typical setup before a gradual downward retrace.
💬 Summary:
US30 lost its low time frame momentum and looks to break down step by step toward the start level zone. We’ll monitor if buyers can react near 47.1K or if this becomes a broader correction phase.
DowJones at pivotal trading zoneKey Support and Resistance Levels
Resistance Level 1: 48085
Resistance Level 2: 48255
Resistance Level 3: 48500
Support Level 1: 47260
Support Level 2: 47040
Support Level 3: 46880
This communication is for informational purposes only and should not be viewed as any form of recommendation as to a particular course of action or as investment advice. It is not intended as an offer or solicitation for the purchase or sale of any financial instrument or as an official confirmation of any transaction. Opinions, estimates and assumptions expressed herein are made as of the date of this communication and are subject to change without notice. This communication has been prepared based upon information, including market prices, data and other information, believed to be reliable; however, Trade Nation does not warrant its completeness or accuracy. All market prices and market data contained in or attached to this communication are indicative and subject to change without notice.

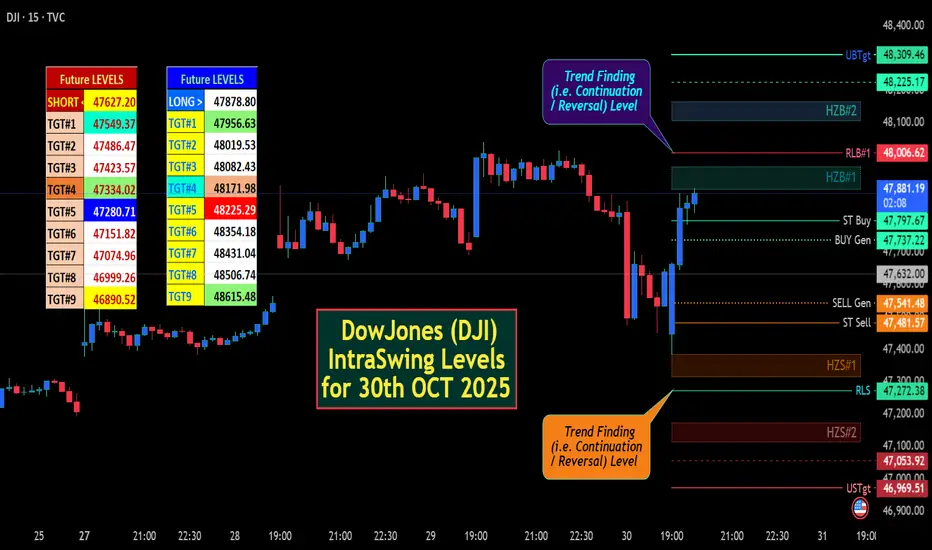
DowJones (DJI) IntraSwing Levels for 30th OCT 2025✍🏼️ "FUTUREY Levels" mentioned in BOX format.
🌡️Plot Levels Using 3 Min, 5 Min Time frame in your Chart for Better Analysis
L#1: If the candle crossed & stays above the “Buy Gen”, it is treated / considered as Bullish bias.
L#2: Possibility / Probability of REVERSAL near RLB#1 & UBTgt
L#3: If the candle stays above “Sell Gen” but below “Buy Gen”, it is treated / considered as Sidewise. Aggressive Traders can take Long position near “Sell Gen” either retesting or crossed from Below & vice-versa i.e. can take Short position near “Buy Gen” either retesting or crossed downward from Above.
L#4: If the candle crossed & stays below the “Sell Gen”, it is treated / considered a Bearish bias.
L#5: Possibility / Probability of REVERSAL near RLS#1 & USTgt
HZB (Buy side) & HZS (Sell side) => Hurdle Zone,
*** Specialty of “HZB#1, HZB#2 HZS#1 & HZS#2” is Sidewise (behaviour in Nature)
Rest Plotted and Mentioned on Chart
Color code Used:
Green =. Positive bias.
Red =. Negative bias.
RED in Between Green means Trend Finder / Momentum Change
/ CYCLE Change and Vice Versa.
Notice One thing: HOW LEVELS are Working.
Use any Momentum Indicator / Oscillator or as you "USED to" to Take entry.
⚠️ DISCLAIMER:
The information, views, and ideas shared here are purely for educational and informational purposes only. They are not intended as investment advice or a recommendation to buy, sell, or hold any financial instruments. I am not a SEBI-registered financial adviser.
Trading and investing in the stock market involves risk, and you should do your own research and analysis. You are solely responsible for any decisions made based on this research.
"As HARD EARNED MONEY IS YOUR's, So DECISION SHOULD HAVE TO BE YOUR's".
Do comment if Helpful .
In depth Analysis will be added later (If time Permits)
US30: Bulls Are Winning! Long!
My dear friends,
Today we will analyse US30 together☺️
The recent price action suggests a shift in mid-term momentum. A break above the current local range around 47,765.31 will confirm the new direction upwards with the target being the next key level of 47,916.63 and a reconvened placement of a stop-loss beyond the range.
❤️Sending you lots of Love and Hugs❤️

US30: Price fails to break high, sellers step inSPREADEX:DJI – Price Rejects Previous High, Possible Pullback Ahead
🕒 Timeframe: 30-Minute Chart
📊 Data Source: Spreadex
💵 Currency: USD
________________________________________
🧠 Short Summary (SEO Preview)
US30 (Dow Jones) has rejected its previous swing high near 47,100 after a strong bullish recovery. Price action now shows early signs of weakness from the supply zone, suggesting a potential short-term correction before the next directional move.
#US30 #DowJones #WallStreet #PriceAction #SupplyAndDemand #TechnicalAnalysis #TradingViewIdeas
________________________________________
📈 Market Overview
After forming a solid base around 46,250 – 46,300, the Wall Street Index (US30) has staged a strong V-shaped recovery.
However, recent candles show that price was rejected at the previous high around 47,100, indicating that buying momentum may be fading as the market hits a strong supply zone.
________________________________________
🔍 Key Technical Zones
Supply Zone (Resistance):
47,000 – 47,150
This zone aligns with the previous swing high where strong selling pressure emerged.
The rejection from this level signals potential exhaustion of buyers in the short term.
Demand Zone (Support):
46,750 – 46,850
This is a former resistance area turned support. A retest here could trigger a short-term bullish reaction before the market decides its next move.
________________________________________
🎯 Trading Scenarios
Scenario 1 – Rejection from Supply Zone (Main Bias)
1. Price has tested the 47,000 – 47,150 zone and rejected the previous high.
2. If sellers remain in control, a pullback toward 46,750 – 46,850 is likely.
3. A deeper correction could extend toward 46,600 – 46,650 if momentum builds.
Scenario 2 – Breakout Above Supply Zone
1. A confirmed candle close above 47,150 would invalidate the short-term bearish bias.
2. In that case, 47,150 may flip into support, opening room for 47,300 – 47,400 as the next bullish targets.
________________________________________
🧭 Technical Outlook
• The rejection of the previous high at 47,100 confirms a key resistance zone.
• Momentum is slowing, suggesting a likely short-term pullback before any new highs.
• Potential strategy: Wait for bearish confirmation (e.g., rejection candle, lower-high formation) around 47,000 – 47,150 before making any decision.
________________________________________
Disclaimer
This analysis is for educational and technical purposes only — not financial advice.
Always manage risk and follow your own trading plan before taking any trades.
Please like and comment below to support our traders. Your reactions will motivate us to do more analysis in the future 🙏✨
Harry Andrew @ ZuperView

24-10-2025 Intraday Plan (CPI + NY Open Scenario) – US30 5M/1M💬 Intraday Plan (CPI + NY Open Scenario) – US30 5M/1M
📍 Bias remains bullish above 46,700 (structure still forming higher lows).
📍 Expecting CPI at 13:30 to create a liquidity grab — ideally sweeping lows into the ascending trendline/support.
📍 After CPI spike settles, looking for a NY Open breakout above 46,850 (key resistance).
📍 If we get a break + retest of 46,850, I’ll look for long entries targeting:
✅ TP1: 47,000
✅ TP2: 47,100
✅ TP3: 47,200 (liquidity extension)
❌ If CPI breaks below 46,700 and fails to recover, I’ll reassess for a bearish scenario.
🕒 No trades during initial CPI spike – waiting for structure confirmation post-news & into NY session.
📌 Plan: CPI grab → NY breakout → retest entry → continuation.

US30 | CPI to Dictate Market DirectionUS30 | Direction Awaits CPI Data
The Dow Jones is set to react strongly to today’s CPI release —
a higher-than-expected reading could trigger bearish momentum,
while a softer print may extend the bullish trend.
Technically:
The index shows bullish potential if it can close a 1H candle above 46,915, targeting 47,090 → 47,230.
However, a 1H close below 46,780 would shift momentum bearish, opening the path toward 46,600 → 46,420.
Pivot Line: 46,850
Resistance: 47,090 – 47,230
Support: 46,600 – 46,420

US30 Technical Breakdown – 10/30/2025
📍 US30 Technical Breakdown – 10/30/2025
US30 cooled off after a strong rally last week 🔥 Price printed a local high around 47,800, then started retracing as momentum slowed. The index is now testing the 47,500–47,400 support zone, sitting right around the EMAs — a crucial spot for bulls to defend 👀
📊 Market Behavior:
🔹 Higher highs and higher lows still intact (bullish structure)
🔹 EMAs starting to flatten → possible short-term pullback
🔹 Buyers defending 47.4K area so far
📌 Key Levels:
🔹 Resistance Zones:
47,790 → recent high / intraday resistance
48,000 → major breakout level
48,200 → continuation target
🔹 Support Zones:
47,400 → EMA & structure support
47,100 → previous breakout zone
46,520 → demand base
🧠 Bias:
Bullish overall ⚡
➡️ Above 47,800 → breakout continuation toward 48,200+
⬅️ Below 47,400 → short-term correction back toward 47,100

Possibility of uptrend It is expected that the upward trend will continue and the index will advance to the specified resistance levels. Otherwise, a correction to the support area will be possible, and then a change in the trend scenario will be likely.

possibility of uptrend It is expected that after some fluctuation, an upward trend will form and advance to the resistance range. As long as the price fluctuates above the support range, an upward trend is likely.

US30 (Dow Jones) Technical Breakdown – 10/24/2025📍 US30 (Dow Jones) Technical Breakdown – 10/24/2025
US30 bouncing strong off the 46,500 demand zone and reclaiming EMAs 📈 Bulls showing strength again, but price now pressing into a major resistance area near 46,830–46,900, where it’s been rejected multiple times 🔥
📊 Market Behavior:
🔹 EMAs flipped bullish after a clean higher low
🔹 Price retesting key structure at 46.8K
🔹 Buyers defending the 46.5K region aggressively
📌 Key Levels:
🔹 Resistance Zones:
46,830 → current intraday cap
46,900 → breakout confirmation
47,100 → bullish continuation target
🔹 Support Zones:
46,520 → local demand
46,300 → EMA retest zone
45,550 → major higher-timeframe support
🧠 Bias:
Bullish ⚡
➡️ Above 46,900 → bullish breakout toward 47,100+
⬅️ Below 46,500 → possible correction back to 46,300

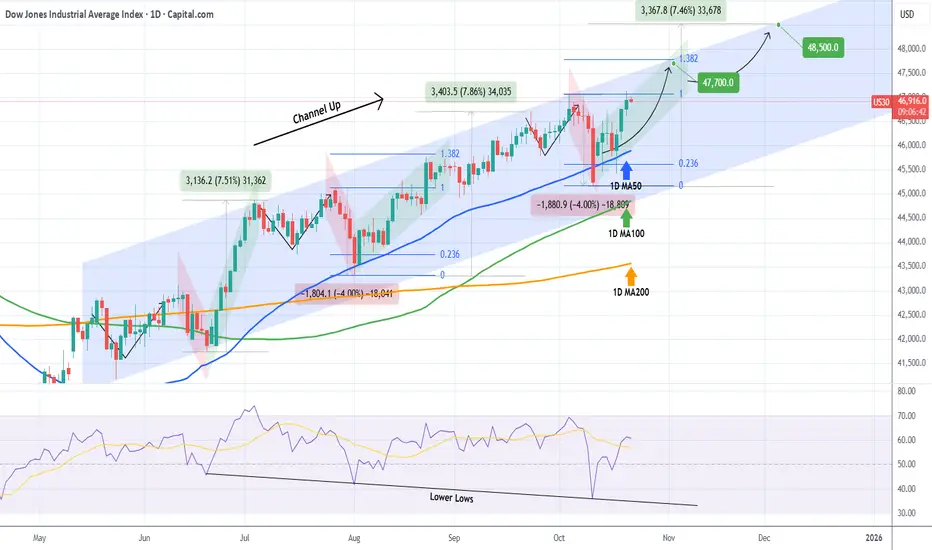
DOW JONES eyes two Bullish Targets before the end of the year.Dow Jones (DJI) has been trading within a 5-month Channel Up and is currently on its new Bullish Leg following the October 10 bounce on its 1D MA50 (blue trend-line).
As you can see, there is a high degree of symmetry between both the Bearish and Bullish Legs within this pattern and if that continues to hold, the immediate Target of the current Bullish Leg is the 1.382 Fibonacci extension at 47700, which we've already mentioned on our previous analysis.
This time however, we also set a second Target towards the end of the year, being a +7.50% rise (standard Leg as you can see) from the bottom at 48500. Both Targets would make ideal technical Higher Highs for the Channel Up.
Notice also how the October 10 bounce took place also on the 1D RSI's Lower Lows trend-line. An additional indication of a strong support for the long-term bullish trend.
-------------------------------------------------------------------------------
** Please LIKE 👍, FOLLOW ✅, SHARE 🙌 and COMMENT ✍ if you enjoy this idea! Also share your ideas and charts in the comments section below! This is best way to keep it relevant, support us, keep the content here free and allow the idea to reach as many people as possible. **
-------------------------------------------------------------------------------
💸💸💸💸💸💸
👇 👇 👇 👇 👇 👇