US30 APRIL11'24 BUY 4H + DSo the fibs ended up disrespecting 78.6% and kissed 88.6%
currently long from this level. i dont anticipate strong selling pressure until the highs get liquidated. until then im in this long idea. trailing on the lower time frames
US30 trade ideas

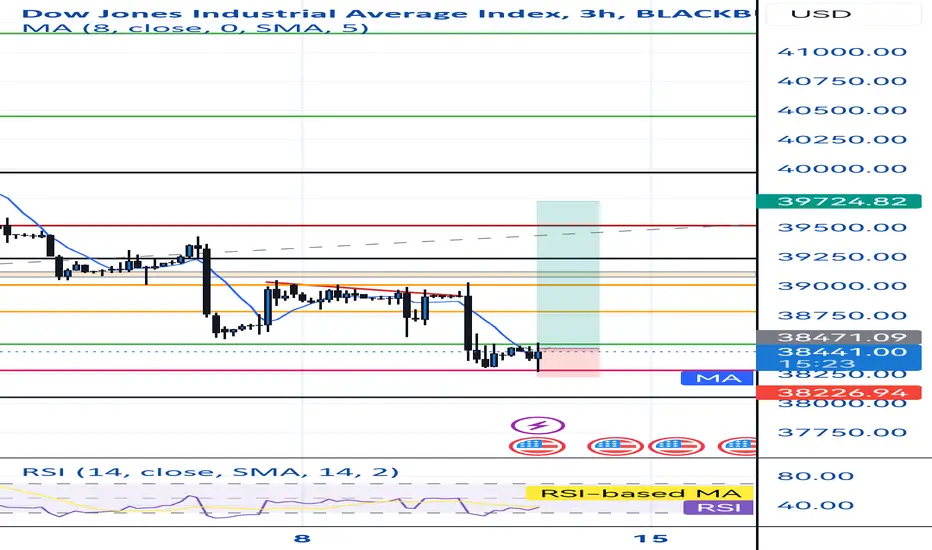
US30: The First Selling Signs US30: The First Selling Signs
After a long time US30 confirmed an "Ascending Channel Pattern"
The price broke down from the channel thus confirming that a possible bearish wave
may happen soon.
Considering that we have the US CPI data tomorrow it is likely that we may see US30
moving down further as it is shown in the chart.
Strong support is found near 38190 and 37280
You may find more details in the chart!
Thank you and Good Luck!
❤️PS: Please support with a like or comment if you find this analysis useful for your trading day❤️

Start changing the trendWhen it hits the floor and starts an upward wave, it can probably move up to its ceiling and then fall

Analysis and Idea on US30 ChartDisclaimer: This is not financial advice. Prices can move in any direction, so manage your risk accordingly.
Situation Overview:
In the US30 chart, there has been a significant drop in the Consumer Price Index (CPI) recently, causing the price to hit a strong swing level.
Analysis:
Given this context, there's an expectation for an overall correction in price, followed by a bullish trend.
Trading Idea:
Entry Point: Buy above 38,470, especially after a confirmed breakout observed on lower timeframes.
Breakout Confirmation: A break above this level is likely, based on technical analysis.
First Target: Aim for a gain of 200+ points/pips.
Second Target: Similarly, target another 200+ points/pips.
Overall Target: The goal is to capture around 400 points in total.
Risk Management:
It's crucial to remember that this is just an idea and not financial advice. Prices can fluctuate unexpectedly, so it's essential to manage risk effectively.
By following these guidelines, traders can align their strategies with potential market movements while prioritizing risk management.

Us30 long 11/04Price has retraced into weekly support, and made an 88 percent retracement. Support formed, doubke bottom, 4hr csndle broke he previous ones high and is forming a bullish rejection. News came out mixed for the dollar so a bullish leg could be inbound
Are we in the last wave up in an Expanding Ending Diagonal?Check this out...
The strong wave from Oct. 2022 into the beginning of 2023 had the same structure and ended with an extension (See below: purple 12345 > Expanding Ending Diagonal).
We are now at the yellow arrow, only this one is in a wider setup (so it takes more time to complete).
Does history repeat with a last push up to somewhere between 39200-39600?


Hellena | DJI (4H): Long to the resistance area of 39419. Dear colleagues, the price has passed many points in the downward movement and at the moment I suppose that the price is completing the corrective wave "4" and very soon will start the upward movement in the wave "5". It is possible to update the low in the area of 38458 and then move to the resistance area of 39419. It is possible that the price will immediately start an upward movement, so I consider only long positions and will look for the best entries to this position.
Manage your capital correctly and competently! Only enter trades based on reliable patterns!

US30 2024/04/1115min bearish range, waiting op premium for possible shorts
also looking to go for buys possibly from A-low during London Sesh

DJ30 has a strong downside momentum, could it drop further?Price is rising towards a resistance level which is a pullback resistance level which aligns with the 23.6% Fibonacci retracement and could reverse from tis level to our take profit
Entry: 38582.06
Why we like it:
There is a pullback resistance level which aligns with the 23.6% Fibonacci retracement
Stop loss: 39081.03
Why we like it:
There is an overlap resistance level
Take profit: 38139.92
Why we like it:
There is an overlap support level
Please be advised that the information presented on TradingView is provided to Vantage (‘Vantage Global Limited’, ‘we’) by a third-party provider (‘Everest Fortune Group’). Please be reminded that you are solely responsible for the trading decisions on your account. There is a very high degree of risk involved in trading. Any information and/or content is intended entirely for research, educational and informational purposes only and does not constitute investment or consultation advice or investment strategy. The information is not tailored to the investment needs of any specific person and therefore does not involve a consideration of any of the investment objectives, financial situation or needs of any viewer that may receive it. Kindly also note that past performance is not a reliable indicator of future results. Actual results may differ materially from those anticipated in forward-looking or past performance statements. We assume no liability as to the accuracy or completeness of any of the information and/or content provided herein and the Company cannot be held responsible for any omission, mistake nor for any loss or damage including without limitation to any loss of profit which may arise from reliance on any information supplied by Everest Fortune Group.

us30 April 10 4h + 1hr Downtrend entryif 23% holds as resistance then we short to head lower. the better the premium price the better. let see what liquidity builds over night.
target 1 is always the lows and target 2 is -27%

US30 PRICE PREDICTIONUS30 looks to be reversing on the high (daily) timeframe. it made a perfect M formation and has now closed below the 50 ema on the daily timeframe.
when price is below the 50 EMA it indicates a down trend vice versa
price may retest the 50 ema before going down.
NOTE : price pulled back to the 618 on fibs (daily timeframe)
looking for price to reach the 200 ema on d1 timeframe

US30 4H EOD Idea April10 24'Key Bull area @ 88.6 % area.
waiting for market to create a pocket of liquidity and then grab it
so we can head up, bearish until then.
gonna post next tokyo and london session setups for smaller timeframes.

Handling The Draw DownCurrently in Draw-Down. Remember always to limit your loss to 1%. The trader with the remaining capital to trade again, always stands a chance to win in the end.

Dow Jones, interpretation of where we areDespite the fact that i calculated the dates, this is just my calculation and correction could easily end in 2033rd, but for now we are monitoring the index and in the future it will be clearer to us where we are, and idea can be updated.
According to my interpretation, the bull market ended in 2021 and now we are in a rising sideways leg, which should end at the beginning or end of summer 2024.
I have two prefered calculation's of target for rising sideway's leg(wave, local rally):
1)39150$ +-500$
2)39950$
Then we go to 1st area(white lines) and bear market within flat should last about 1 year.
Next rally(leg) in the context of the expected flat correction should end around 36000$ in Spring of 2027.
And i hope that all the correction will be finished in March of 2028(Prefered, because it should be fast destroy like tsunami) or December 2029, at the 2nd area(red lines), so we won't be too old by then.)

US 30 - Ranges overview We are taking out the weekly sellside liquidity on US 30.
Keep a close eye to it and watch how we close this week.
IF we hold it expect us to target back towards the highs
IF we fail to hold expect further pa to the downside
Don't hesitate to correlate it with DXY and its current trading range.
Stay safe and never risk more than 1-5% of your capital per trade. The following analysis is merely a price action based analysis and does not constitute financial advice in any form.

US30 April 10'24 Daily EODPremium Area on the daily time frame. If current market candles can close above in 2 hours then that would be added confluence towards a buy bias. It would be an 80% chance we reach all time highs again if respected. Lower time frame analysis coming soon.

US30 April 10 HTF M + WAfter a long break from posting on TV. I am back with Dow jones updates.
Currently under a consistency Routine in a mission to progress through. I am funded and trading Forex and Futures.
Now getting into tecnicals, I was waiting for a top to form so I could have a clear Point to establish the swing high where i can place the fibs. Anticipating buy levels for end of month activity with these significant retracement levels.
Going to aim to post HTF ideas as often as the candles close.


DOW JONESVery short time chart 15 minutes counts
I may be wrong but seems to have done wave 1 or A downside.


US30 VS CPIThe Consumer Price Index (CPI) has exceeded expectations for the third consecutive month. This development suggests that the US30 price may have reached a monthly low and could potentially continue its upward trajectory, establishing new higher highs as investors are likely to maintain their investments.
What are your thoughts?
Tradebudz
