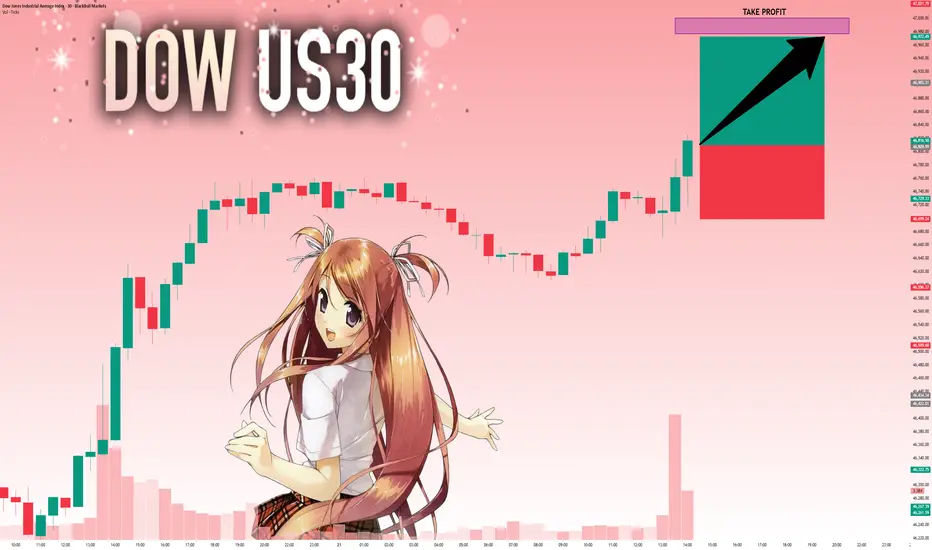
Dow Jones Swing Trade Setup – Is 48,000 the Next Stop?📈 US30 "Dow Jones Industrial Average" CFD: Thief's Wealth Strategy Map (Swing/Day Trade) 🚨
🎯 Swing/Day Trade Setup: US30 (Dow Jones Industrial Average CFD)
Get ready to sneak into the market with the Thief Strategy — a cheeky, layered limit-order approach to steal profits from the Wall Street shadows! 😎 This bullish plan is designed for swing or day trading, with a professional yet playful vibe to maximize your market heist. Let’s break it down! 🕵️♂️
🧠 Trade Idea: Bullish Heist on US30 🚀
Asset: US30 (Dow Jones Industrial Average Index CFD)
Market: Wealth Strategy Map (Swing/Day Trade)
Outlook: Bullish 📈
Strategy: The Thief Strategy — using multiple buy limit orders in a layered entry style to catch the best price levels. Think of it as setting traps for profits! 🕸️
📝 The Thief’s Plan: Layered Entry & Key Levels
🔑 Entry Strategy:
Deploy multiple buy limit orders to layer your entries like a master thief:
🎯 46,500
🎯 46,600
🎯 46,700
🎯 46,800
Pro Tip: Feel free to add more layers based on your risk appetite or market conditions. The more traps, the merrier! 😜
Flexible Entry: You can enter at any price level within this range, but layering helps you average into the position like a sneaky pro.
🔐 Stop Loss (SL):
Set at 46,300 — the Thief’s escape hatch! 🚪
Note: Dear Ladies & Gentlemen (Thief OGs 🕶️), this SL is my suggestion, but it’s your heist! Adjust based on your risk tolerance and account size. Only risk what you can afford to lose!
🎯 Take Profit (TP):
Primary target: 47,600 — a juicy profit zone before the Police Barricade (resistance) at 48,000.
Why 47,600? This level avoids the overbought trap and potential reversal at 48,000, where strong resistance and market shenanigans may lurk. 🕵️♂️
Note: Thief OGs, this TP is my call, but you’re the boss! Take profits at your own discretion and secure the bag. 💰
🔍 Why This Setup? Key Analysis Points
Market Context: The US30 is showing bullish momentum, supported by recent economic data and market sentiment (check social posts and financial news for real-time vibes).
Technical View:
The layered entry approach leverages potential pullbacks within a bullish trend, maximizing your entry efficiency.
The 46,300 SL is placed below key support to protect against sudden reversals.
The 48,000 level acts as a major resistance (overbought zone + psychological barrier), making 47,600 a safer TP.
Risk Management: The Thief Strategy spreads risk across multiple entry points, reducing the impact of volatility spikes.
💹 Related Pairs to Watch (Correlated Assets in USD)
To boost your market awareness, keep an eye on these correlated assets:
SP:SPX (S&P 500 Index CFD): Moves closely with US30 due to shared exposure to U.S. large-cap stocks. A bullish US30 often aligns with SPX strength. 📈
PEPPERSTONE:NAS100 (Nasdaq 100 Index CFD): Tech-heavy index that can amplify or diverge from US30 moves. Watch for tech sector momentum. 💻
FX:USDJPY (Forex Pair): A stronger USD often supports bullish US equity indices like US30. Monitor for USD strength or Yen weakness. 💵
Key Correlation Insight: If SP:SPX and PEPPERSTONE:NAS100 show similar bullish patterns, it reinforces the US30 setup. Conversely, a sharp USDJPY drop could signal caution for US indices.
⚠️ Disclaimer
This Thief Style trading strategy is just for fun and educational purposes! 😜 Trading involves risks, and past performance doesn’t guarantee future results. Always conduct your own analysis, manage risk wisely, and only trade what you can afford to lose.
✨ If you find value in my analysis, a 👍 and 🚀 boost is much appreciated — it helps me share more setups with the community!
#US30 #DowJones #ThiefStrategy #SwingTrading #DayTrading #Bullish #TechnicalAnalysis #TradingView #WealthStrategy
Trade ideas

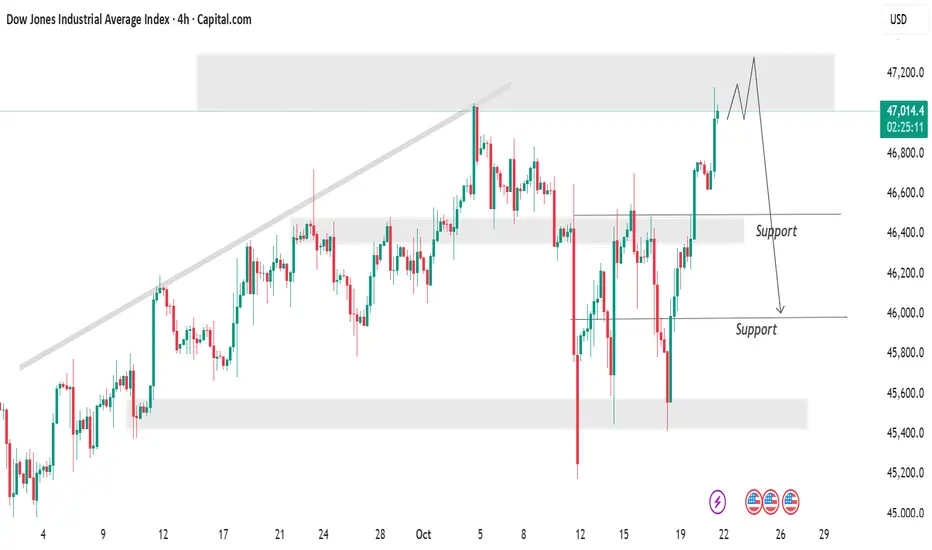
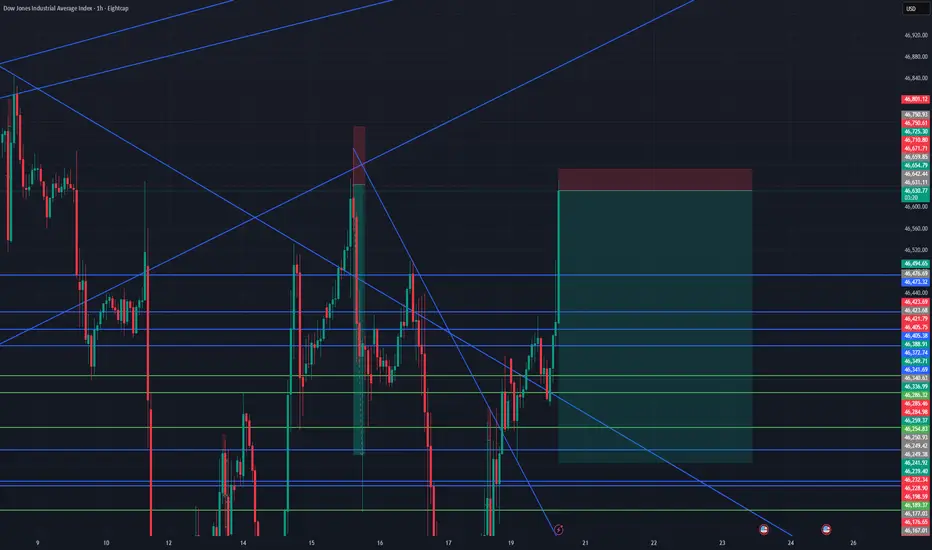
uptrend Given the failure of the resistance area, the consolidation above the resistance area is expected to continue the upward trend to the specified resistance levels.

Plan Your Stop Loss Before the Market Plans It for YouStop loss is not just a level on your chart, it’s your safety belt in trading. It’s what protects your capital when things don’t go in your favor.
Before you enter a trade, you should already know where your stop loss will be. It is less meaningful to decide it after you are in a trade because that’s where emotions take over.
Stoploss is not just a “feel comfortable" point, rather it is the place beyond which your whole idea goes wrong.
There are a few points that need to be focused before deciding your stoploss-
Support and Resistance
Open your trading time frame and go one step up.
Ex. if you trade on 5minute chart, go to 15minutes chart and if you trade on 1hour chart, go to 4hourly chart to identify support and resistance
Here are some clean step ups-
For day trade 1-5, 5-15, 15-60 (minutes)
For Swing trade 30-120, 60-240 (minutes)
For long term 1D-1W, 1W-1M
On the higher timeframe chart, identify important Support and resistance levels
Important support/resistance levels are those which have been tested multiple times or from where strong reactions have already been seen.
Identify the market direction
Up- Price making higher highs- higher lows
Down- Price making lower lows- lower highs formation
Sideways- Price trading in a tight range with no clear direction
If market is up- look for buying a pullback near support zones
If market is down- look for a selling a pullback near resistance zones
If market is sideways- buy near support and sell near resistance
Before you take your trade first know your risk in the trade
Identify the level beyond which your whole idea behind the trade goes wrong- this level is your stoploss
A stoploss could be below the support if you are looking to buy at support
Or this could be above resistance if you are looking to sell at resistance
Identify the next significant level- this is you target
The next resistance in case of long trade
Next support in case of short trade
Calculate if the distance from your entry and your target is more than the distance of your entry from the stoploss.
If it is more then, the reward-risk ratio is in your favor, and the idea is executable.
On the other hand, if the risk in a trade is more than the reward then the trade idea can be avoided.
Also decide your position size according to your stoploss
A wider stoploss means small position size so that you don't lose more than a fixed percentage per trade
A small stoploss means you can increase position size as you have more room to accommodate.
If you find that your stop has to be too wide to make sense, just don’t force the trade. Wait for a cleaner, tighter setup that fits your plan.
Deciding a stoploss is an essential part of your strategy. You might know all the candlestick patterns but without stoploss, they are more like tossing a coin.
Do you decide your stoploss beforehand or after taking a trade?
Tell me in the comment section.

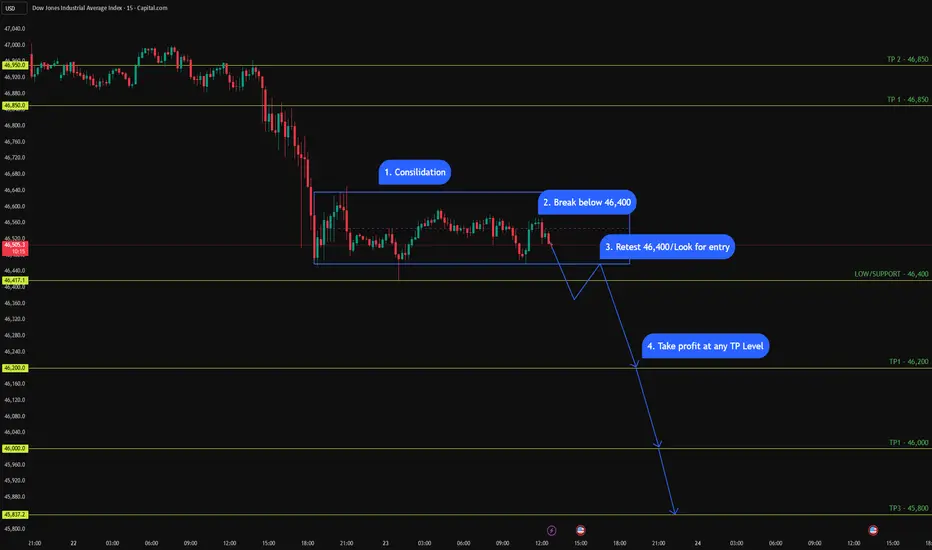
US30 (15M - 1M Daily Setup) - Bearish Bias US30 (15M - 1M Daily Setup) - Bearish Bias 📉
Price is consolidating under key resistance, forming lower highs. I’m watching 46,400 as the make-or-break level.
✅ Plan:
1️⃣ Consolidation phase complete
2️⃣ Looking for a clean break below 46,400
3️⃣ Retest → possible short entry
4️⃣ Target zones:
• TP1 → 46,200
• TP2 → 46,000
• TP3 → 45,800
📍 Bias stays bearish as long as price remains below 46,850 – 47,000.
Let’s see if the breakdown plays out. 👀
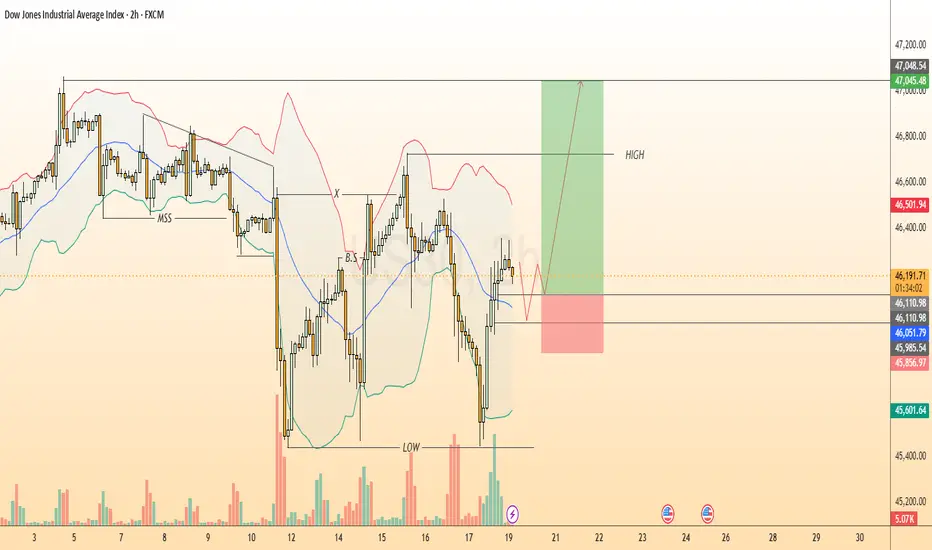
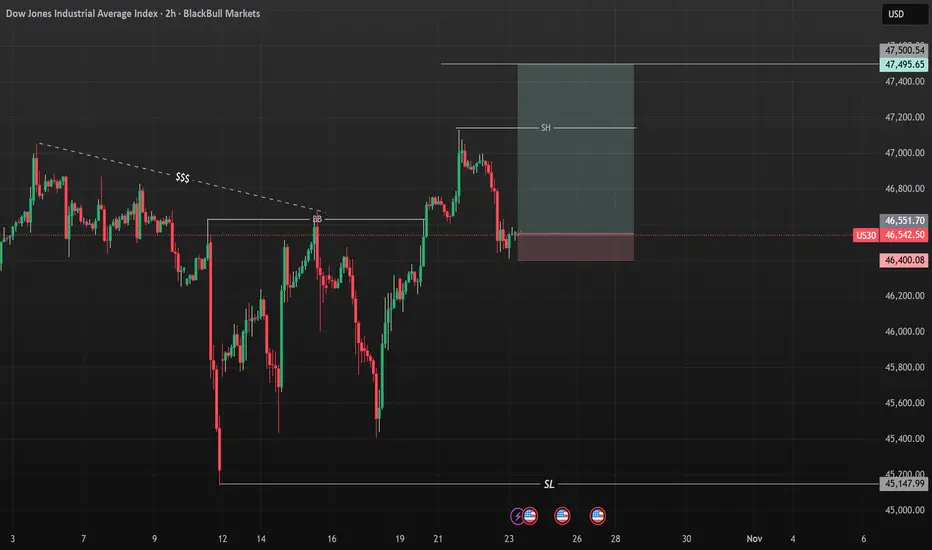
US30 UpdateNext move on the way, focus on proper risk management & stay disciplined. Wishing you successful trades..!
Key Reason:
1. BSL hunting still in pending.
2. Hidden OB formation.
3. When price tap this area and rejected this area along with strong volume. Then we'll see a upside move.
This is not a financial advise. Confirmation is most important. Let's see how it will work.
US30 | CPI to Dictate Market DirectionUS30 | Direction Awaits CPI Data
The Dow Jones is set to react strongly to today’s CPI release —
a higher-than-expected reading could trigger bearish momentum,
while a softer print may extend the bullish trend.
Technically:
The index shows bullish potential if it can close a 1H candle above 46,915, targeting 47,090 → 47,230.
However, a 1H close below 46,780 would shift momentum bearish, opening the path toward 46,600 → 46,420.
Pivot Line: 46,850
Resistance: 47,090 – 47,230
Support: 46,600 – 46,420

US30 Bearish Leg from $46,800Hi everyone,
Sharing a 15m US30 chart for you guys.
This morning, price traded above previous days high and then gave a bearish reaction.
On the shared chart I have the Asian Low (AL) marked out, which has not been swept or traded below yet.
So this could potentially be a good interim bearish target.
This current $46,800 price level could potentially act as a pivot point if the correct confluences form on the lower time frame such as the 5m chart.
Confluences @ $46,800:
- 61.8% FIB
- OB area
- 1h FVG area
Kind regards,
Aman

US30 longI see great buying power coming.
sentiments are looking risk on and positive for US stocks as Us and china look to be interested in making a trade deal.
technicals show that at the current price levels buyers have come in to purchase driving price up
US30 Eyes 46,600 Resistance as Correction Extends Within TrendHey Traders, in tomorrow’s trading session we are monitoring US30 for a potential selling opportunity around the 46,600 zone. The Dow Jones remains in a broader downtrend and is currently in a corrective phase, approaching a key resistance level aligned with the descending trendline.
Structure:
Price continues to form lower highs and lower lows, indicating persistent bearish momentum. The ongoing pullback toward 46,600 could offer a potential continuation setup in line with the prevailing downtrend.
Key level in focus:
46,600 — a significant resistance zone and trendline confluence area where sellers have previously regained control.
Fundamentals:
Market sentiment remains fragile as uncertainty over US fiscal policy and geopolitical risks weigh on risk assets, supporting potential downside pressure on the Dow.
Next move:
Watching for bearish confirmation signals near 46,600 — a rejection from this zone could open the door for a continuation toward recent lows.
Trade safe,
Joe.

US30 ForecastUS30 Industrial Average Index shows a strong bullish recovery toward the 47,000 level, where price is currently testing a major resistance zone. The projection suggests a potential short-term consolidation or double-top formation around this area, followed by a bearish retracement toward the 46,400 and 46,000 support zones. These key levels may act as demand areas for a possible rebound if the correction unfolds as anticipated.
"Thank you for your support! If you found this idea valuable or learned something new, please consider liking and leaving a comment. I’d really appreciate hearing your feedback and thoughts."
US30 Sell Biadusing CRT Model
old high purged
turtle soup formed
Model 1 entry point
Take profit at 50% fib of range.

US30: Bulls Are Winning! Long!
My dear friends,
Today we will analyse US30 together☺️
The recent price action suggests a shift in mid-term momentum. A break above the current local range around 46,809.99 will confirm the new direction upwards with the target being the next key level of 46,976.92 and a reconvened placement of a stop-loss beyond the range.
❤️Sending you lots of Love and Hugs❤️
DowJones at pivotal 46450 levelKey Support and Resistance Levels
Resistance Level 1: 47156
Resistance Level 2: 47285
Resistance Level 3: 47413
Support Level 1: 46450
Support Level 2: 46270
Support Level 3: 46126
This communication is for informational purposes only and should not be viewed as any form of recommendation as to a particular course of action or as investment advice. It is not intended as an offer or solicitation for the purchase or sale of any financial instrument or as an official confirmation of any transaction. Opinions, estimates and assumptions expressed herein are made as of the date of this communication and are subject to change without notice. This communication has been prepared based upon information, including market prices, data and other information, believed to be reliable; however, Trade Nation does not warrant its completeness or accuracy. All market prices and market data contained in or attached to this communication are indicative and subject to change without notice.

US30 BEARISH SETUP Price is currently knocking on resistance 46783. By the momentum of the double bottom price should push to new levels

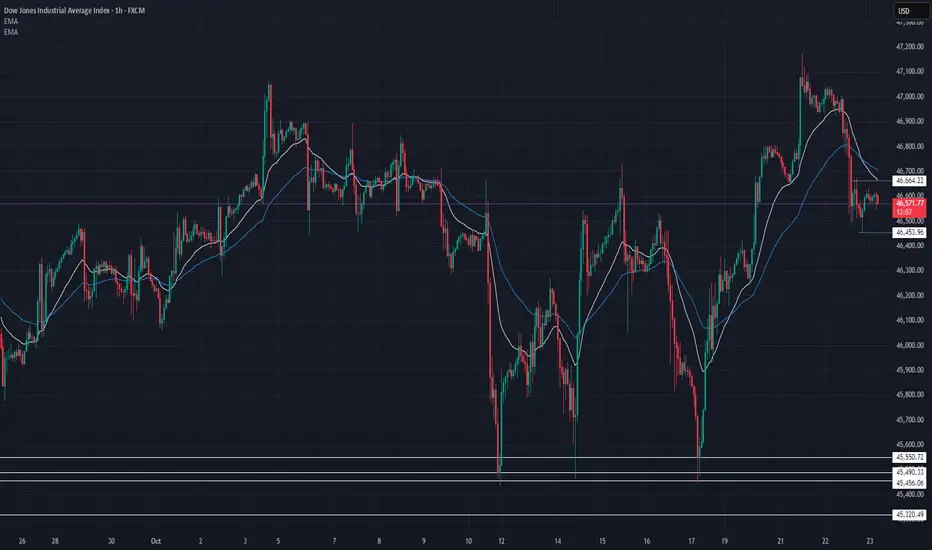
US30 Technical Breakdown – 10/23/2025📍 US30 Technical Breakdown – 10/23/2025
US30 seeing a sharp rejection from the 47,100 area, now consolidating around the 46,600 zone. Bears have regained short-term control as EMAs flip bearish — momentum slowing after recent upside pushes 😴📉
📊 Market Behavior:
🔹 Clean rejection off 47,000 resistance
🔹 EMAs crossing down, showing bearish pressure
🔹 Price ranging between 46,450 – 46,700
📌 Key Levels:
🔹 Resistance Zones:
46,664 → intraday resistance
46,850 → key supply zone
47,100 → breakout threshold
🔹 Support Zones:
46,450 → near-term demand
46,226 → structure support
45,550 → macro support for bulls
🧠 Bias:
Bearish ⚠️
➡️ Below 46,450 → sell momentum could push to 46,200
⬅️ Above 46,700 → bulls may try to retest 46,900
US30 BUY NOW!!!!!!!!US30 took out the internal structure high with a minor pull back indicating a buying bias am going in on a buy from this zone holding till price gets to 47k.
LETS SEE YOUR THOUGHTS ON US30...
US30 | Correction Continues Below PivotUS30 – Overview | Bearish Correction Toward 46,000
US30 is showing a bearish correction, with price expected to retest the 46,140–46,000 zone before any potential rebound.
If the index closes below 46,000 (1H), it may extend losses toward 45,680 → 45,470.
Technical View
A 1H close above 46,560 would shift momentum bullish, targeting 46,820 → 47,000.
Pivot: 46,410
Bias: Bearish below 46,400

Possible bearish outlookSeeing how Tuesdays candle closed below the previous hogh , would be watching a bearish drop to the downside

going shorttoday we are looking at shorting opportunities on Us30 this is a very high risk trade given the trend sentiment

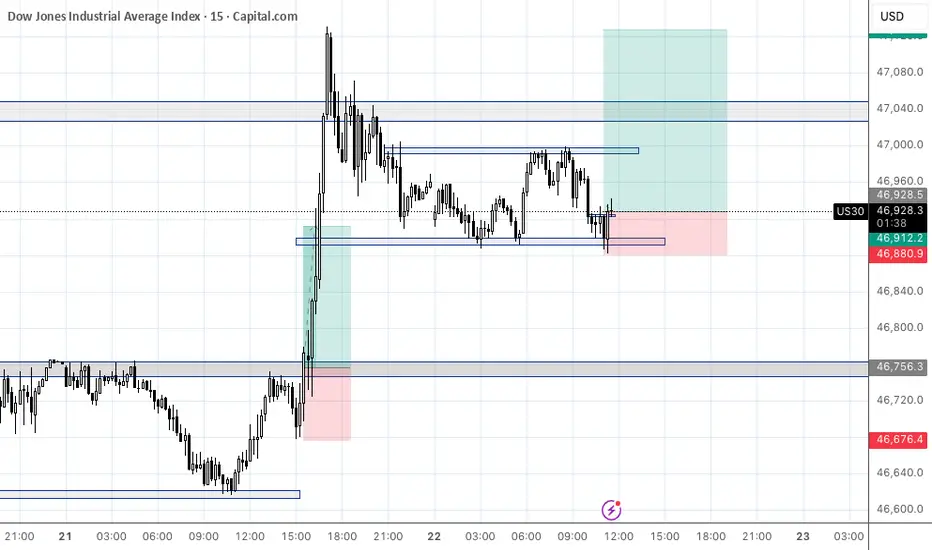
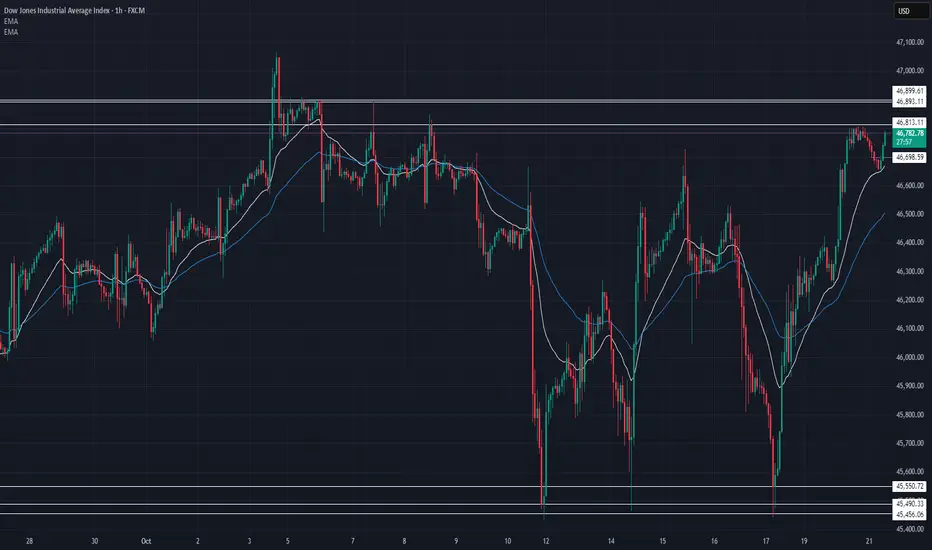
US30 Technical Breakdown – 10/21/2025📍 US30 Technical Breakdown – 10/21/2025
US30 showing strong bullish momentum after reclaiming the 46,600 zone 🚀. Buyers have stepped in aggressively, pushing price back toward key resistance — the market’s testing whether this is just a retracement or the start of a bigger breakout.
📊 Market Behavior:
🔹 Price broke above 46,500 structure zone
🔹 Now consolidating just under 46,800 resistance
🔹 EMAs fanning upward — short-term trend favoring bulls
📌 Key Levels:
🔹 Resistance Zones:
46,813 → intraday rejection zone
46,893 → major breakout target
46,900+ → bullish continuation potential
🔹 Support Zones:
46,700 → EMA short-term support
46,505 → key retest level
46,100 → lower structure support
45,550 → macro floor for bulls
🧠 Bias:
Bullish ⚡
➡️ Above 46,900 → continuation to 47,200 possible
⬅️ Below 46,500 → momentum weakens, 46,100 retest likely
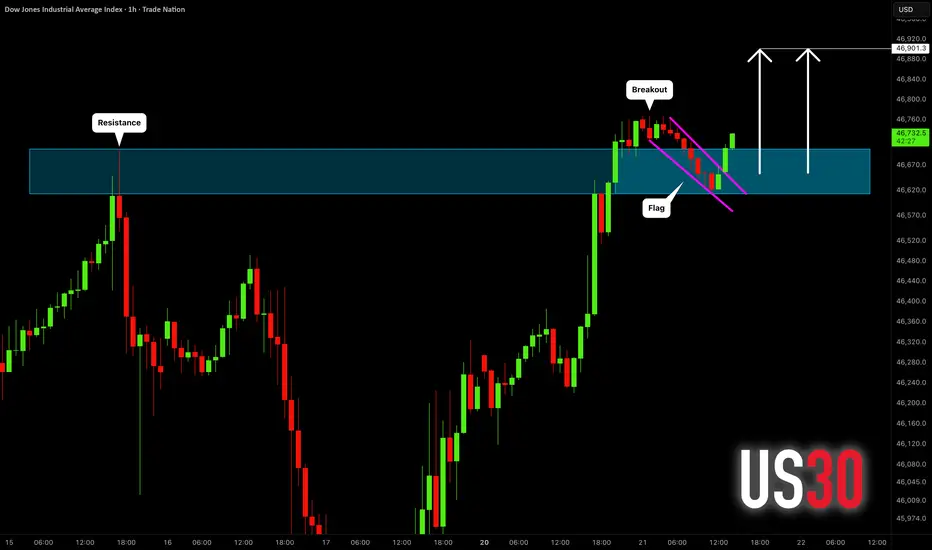
DOW JONES INDEX (US30): Bullish Continuation Confirmed
US30 index violated a major horizontal resistance yesterday.
The price started a correctional movement then, steadily
falling within a bullish flag pattern.
A breakout of its resistance line is a strong bullish signal.
Odds will be high, the index will hit 46900 level soon.
❤️Please, support my work with like, thank you!❤️
I am part of Trade Nation's Influencer program and receive a monthly fee for using their TradingView charts in my analysis.
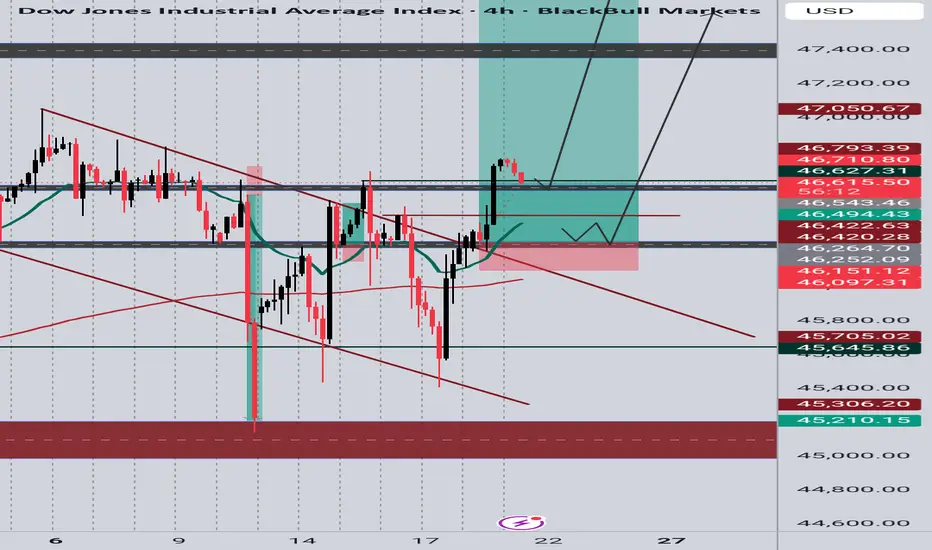
US30 (Dow Jones) 4H AnalysisPrice has broken out of the falling wedge pattern and is now approaching a key retest zone around 46,600–46,650 & 46 400. I’m watching for a bullish confirmation on the retest to enter long, targeting the next resistance zones.
✅ Entry: On confirmed retest of the breakout zone
🎯 First Target: 47,450
🎯 Final Target: 48,227
🛑 Stop Loss: Below the support area around 46,450
The recent break of structure combined with bullish momentum and neckline breakout signals potential continuation to the upside this week.
📅 Looking for bullish continuation into higher resistance levels if price holds above the breakout zone.