uptrend Given the failure of the resistance area, the consolidation above the resistance area is expected to continue the upward trend to the specified resistance levels.
Trade ideas


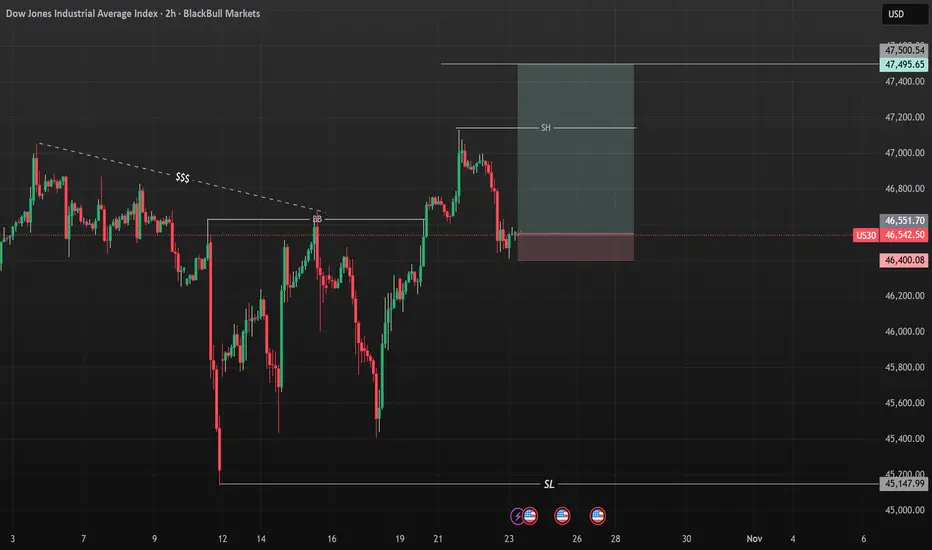
US30 BUY NOW!!!!!!!!US30 took out the internal structure high with a minor pull back indicating a buying bias am going in on a buy from this zone holding till price gets to 47k.
LETS SEE YOUR THOUGHTS ON US30...
Us30 Trade Set Up Oct 22 2025Price swept a daily BSL and closed under it and has left a lot of SSL plus a daily gap below so i will want to see a sweep of internal BSL followed by a CISD on the 1m-5m to target PDL and 50% of the daily gap

Dow bullish breakout supported at 46600Key Support and Resistance Levels
Resistance Level 1: 47156
Resistance Level 2: 47285
Resistance Level 3: 47413
Support Level 1: 46600
Support Level 2: 46460
Support Level 3: 46270
This communication is for informational purposes only and should not be viewed as any form of recommendation as to a particular course of action or as investment advice. It is not intended as an offer or solicitation for the purchase or sale of any financial instrument or as an official confirmation of any transaction. Opinions, estimates and assumptions expressed herein are made as of the date of this communication and are subject to change without notice. This communication has been prepared based upon information, including market prices, data and other information, believed to be reliable; however, Trade Nation does not warrant its completeness or accuracy. All market prices and market data contained in or attached to this communication are indicative and subject to change without notice.

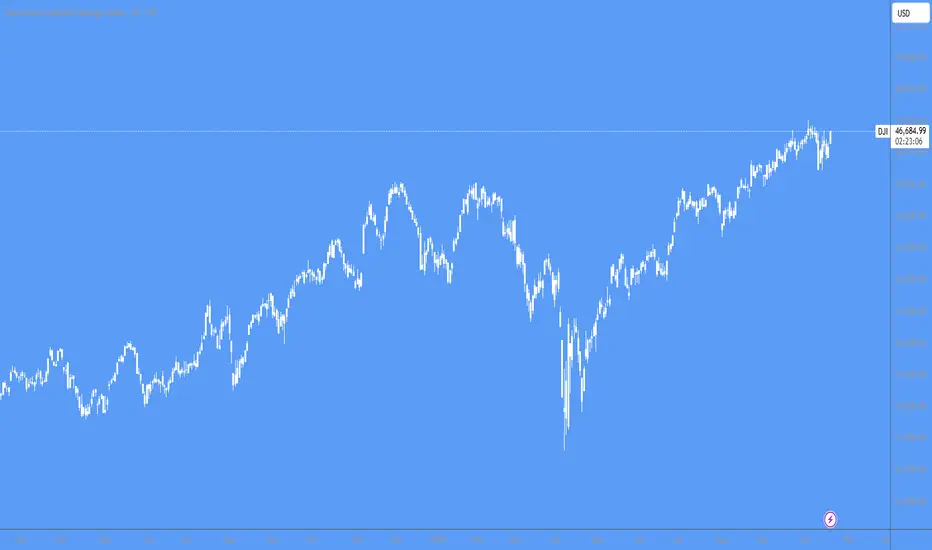
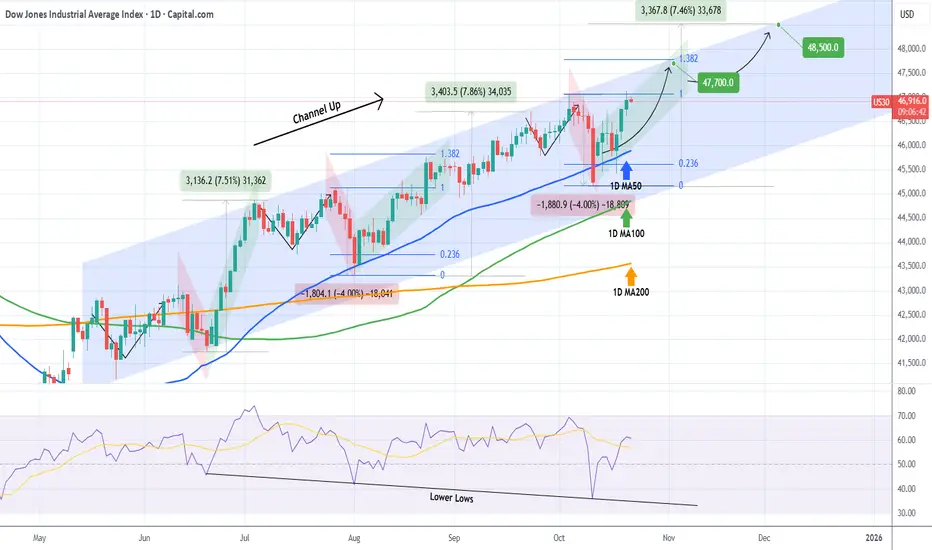
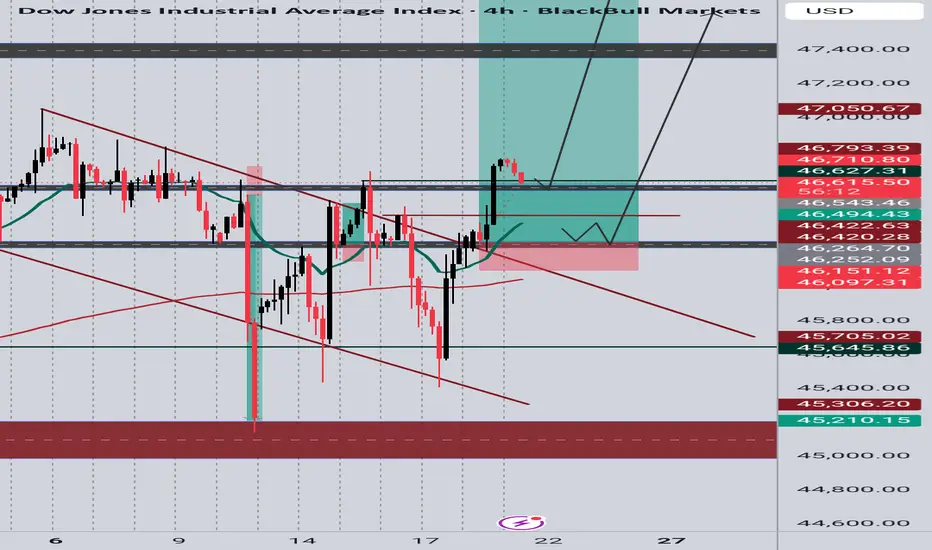
DOW JONES eyes two Bullish Targets before the end of the year.Dow Jones (DJI) has been trading within a 5-month Channel Up and is currently on its new Bullish Leg following the October 10 bounce on its 1D MA50 (blue trend-line).
As you can see, there is a high degree of symmetry between both the Bearish and Bullish Legs within this pattern and if that continues to hold, the immediate Target of the current Bullish Leg is the 1.382 Fibonacci extension at 47700, which we've already mentioned on our previous analysis.
This time however, we also set a second Target towards the end of the year, being a +7.50% rise (standard Leg as you can see) from the bottom at 48500. Both Targets would make ideal technical Higher Highs for the Channel Up.
Notice also how the October 10 bounce took place also on the 1D RSI's Lower Lows trend-line. An additional indication of a strong support for the long-term bullish trend.
-------------------------------------------------------------------------------
** Please LIKE 👍, FOLLOW ✅, SHARE 🙌 and COMMENT ✍ if you enjoy this idea! Also share your ideas and charts in the comments section below! This is best way to keep it relevant, support us, keep the content here free and allow the idea to reach as many people as possible. **
-------------------------------------------------------------------------------
💸💸💸💸💸💸
👇 👇 👇 👇 👇 👇
US30: Breakout or Pullback? Key zones in play
SPREADEX:DJI Technical Analysis – Price Action Scenarios Based on Supply & Demand Zones
Timeframe: 30-Minute
Chart: Wall Street Index (US30)
Source: TradingView
________________________________________
🔍 Overview
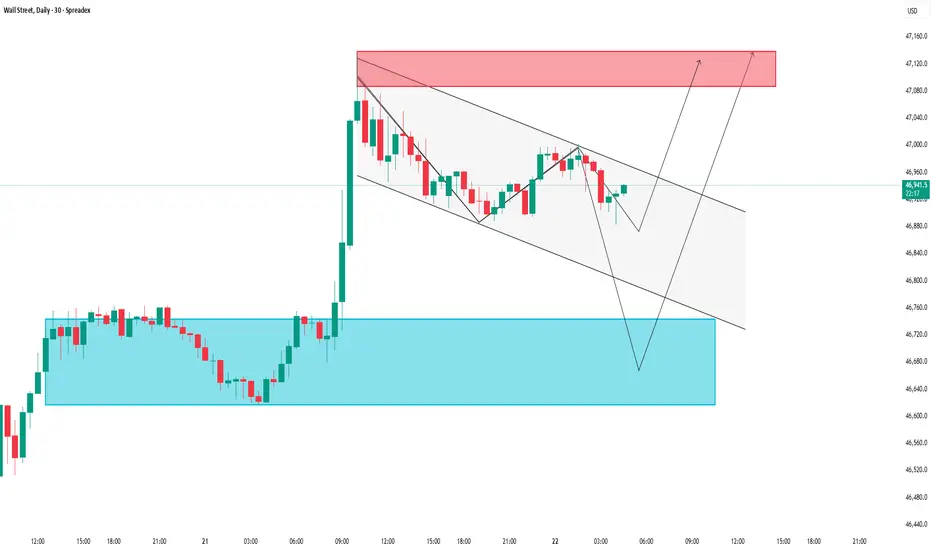
In this Wall Street index analysis, the US30 is currently consolidating within a descending price channel after a sharp bullish breakout from a key demand zone. The chart outlines potential price action scenarios based on key support and resistance levels derived from supply and demand dynamics.
________________________________________
Key Supply & Demand Zones
🔵 Demand Zone (Support Area): 46,660 – 46,720 USD
This is the deep support zone where price previously reversed sharply. It represents a high-probability buying area if retested.
🟢 Short-Term Support / Accumulation Zone: 46,880 – 46,950 USD
Price has shown multiple reactions here, indicating accumulation and temporary demand. A break below this area could lead to a move toward the lower demand zone.
🔴 Supply Zone (Resistance Area): 47,100 – 47,160 USD
This is a potential reversal zone where sellers may become active again. A breakout above this area could signal continuation of the bullish trend.
________________________________________
🧭 Technical Structure & Price Action Scenarios
The chart shows two main forecast scenarios for US30:
📉 Scenario 1: Bearish Pullback to the Lower Demand Zone
• Price gets rejected at the upper boundary of the descending channel.
• If bearish momentum continues, expect a decline toward the 46,660 – 46,720 USD zone.
• Look for bullish reversal signals such as a hammer or bullish engulfing candle before considering long positions.
📈 Scenario 2: Bullish Breakout Toward the Supply Zone
• If price sustains above 46,950 USD and breaks the descending trendline, a bullish move may be confirmed.
• Target zone: 47,100 – 47,160 USD.
• A successful breakout here could open up a continuation toward higher levels.
________________________________________
📌 Supporting Indicators
• Parabolic SAR: Dots are showing a potential shift during the retracement. Watch for dots flipping below price to support bullish continuation.
• Breakout Confirmation: The previous breakout above the 46,880 range adds weight to the current bullish outlook.
________________________________________
✅ Trading Setup Summary
Scenario Key Zone Action
📉 Pullback 46,660 – 46,720 Watch for long entry (support test)
📈 Breakout 46,950 Long toward 47,100 – 47,160
• Support Holding Above: 46,880 – 46,950 USD
• Resistance Zone to Watch: 47,100 – 47,160 USD
________________________________________
⚠️ Final Thoughts
The current structure indicates a pullback within a broader bullish context. Watch how price reacts at support zones and the descending channel. Traders should wait for clear confirmation before entering positions and maintain strict risk management.
📈 This setup is suitable for day traders and short-term swing traders looking to trade the US30 index based on clean price action and supply & demand logic.
Please like and comment below to support our traders. Your reactions will motivate us to do more analysis in the future 🙏✨
Harry Andrew @ ZuperView
Dow Jones Testing 46,760 – Bounce or Breakdown Ahead?Hey Traders, in today’s trading session we’re closely monitoring US30 for a buying opportunity around the 46,760 zone. The Dow Jones remains in a broader uptrend and is currently undergoing a correction phase, approaching a key support and resistance confluence at 46,760.
Market Structure:
The index continues to print higher highs and higher lows, confirming bullish market structure. The current retracement could offer a potential continuation setup if buyers regain control near this level.
Key Level:
46,760 — an important technical zone where trendline support meets horizontal structure, providing a potential reaction point for bulls.
Outlook:
If buying pressure emerges from this area, a move toward 47,400–47,600 could be on the table in the coming sessions.
💬 What’s your take on US30 here?
Do you see a bounce from support or a deeper pullback coming? Share your view in the comments!
Trade safe,
Joe.
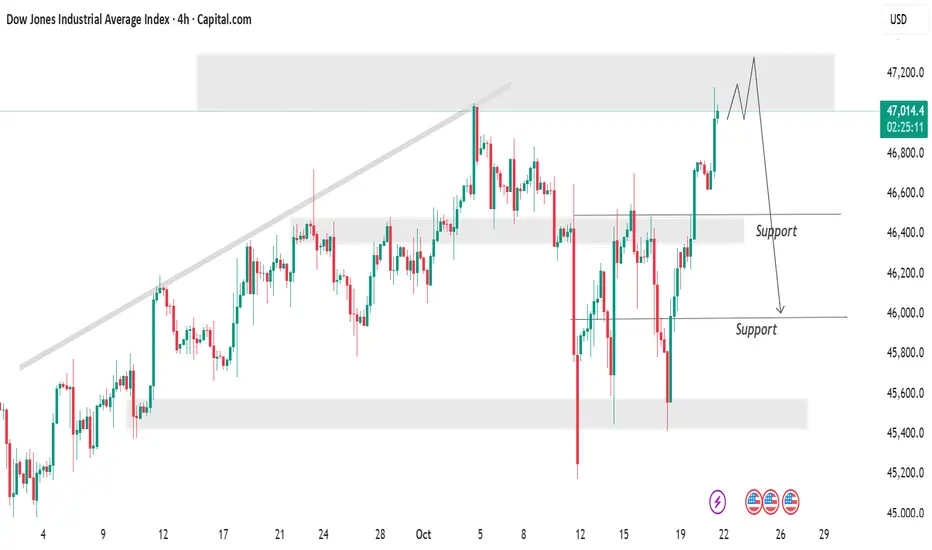
US30 ForecastUS30 Industrial Average Index shows a strong bullish recovery toward the 47,000 level, where price is currently testing a major resistance zone. The projection suggests a potential short-term consolidation or double-top formation around this area, followed by a bearish retracement toward the 46,400 and 46,000 support zones. These key levels may act as demand areas for a possible rebound if the correction unfolds as anticipated.
"Thank you for your support! If you found this idea valuable or learned something new, please consider liking and leaving a comment. I’d really appreciate hearing your feedback and thoughts."
Dow Jones Industrial Index (US30) Technical AnalysisThe Dow Jones is moving within a bullish corrective structure on the 2H timeframe, after sweeping downside liquidity and rebounding from a demand zone.
The price is expected to continue rising toward the 47,050 – 47,980 zone, representing the 161% – 200% Fibonacci extensions, which may act as key resistance areas for potential profit-taking.
If the price fails to break above 47,980, a short-term correction toward 46,130 could occur before any renewed bullish momentum.
📊 Fundamental Outlook:
The U.S. indices remain supported by strong corporate earnings and reduced expectations of further Fed rate hikes.
However, rising bond yields and upcoming inflation data could limit the upside momentum in the short term.
📅 Short-term Bias: Mildly Bullish with correction risk
🎯 Upside Targets: 47,050 – 47,980
📉 Pullback Target: 46,130
⛔ Invalidation Level: Below 45,900
#US30 #DowJones #TechnicalAnalysis #FundamentalAnalysis #EmaraCapital #Rami_Hajj_Bakour #Trading #Markets

Possible bearish outlookSeeing how Tuesdays candle closed below the previous hogh , would be watching a bearish drop to the downside

US30 Sell Biadusing CRT Model
old high purged
turtle soup formed
Model 1 entry point
Take profit at 50% fib of range.

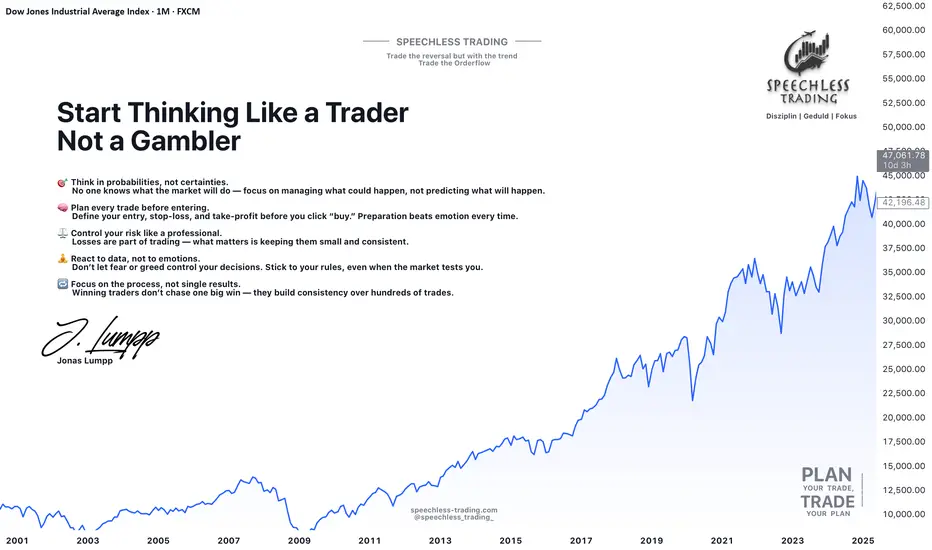
Start Thinking Like a Trader – Not a Gambler.Most people don’t lose in trading because they lack knowledge — they lose because they think the wrong way.
They chase signals, follow the noise, and react emotionally to every candle. They trade out of fear when the market drops, and out of greed when it rises. They believe the next trade will finally make everything right.
But real trading doesn’t work like that.
A real trader knows: the market owes you nothing. Every trade carries uncertainty. You can’t control outcomes — only your decisions.
That’s why traders think in probabilities, not certainties. They understand that a single trade means nothing, but consistent execution over time means everything.
Professional traders don’t rely on luck.
They plan every move before entering:
-> They define their entry and exit.
-> They set a stop-loss to protect their capital.
-> They accept that losses are part of the business, not a reflection of their skill.
Risk control is the foundation — without it, even the best strategy will fail.
Because the goal is not to win every trade. The goal is to stay in the game long enough for your edge to play out.
Think like a trader:
-> Focus on the process, not just the result.
-> React to what you see, not what you feel.
-> Stay calm, even when the market tests your patience.
-> Be consistent, even when emotions push you off balance.
-> Keep learning — the best traders are lifelong students of the market.
Trading isn’t gambling. It’s a business built on discipline, strategy, and mindset.
And once you truly start thinking like a trader, you’ll realize: you don’t need to predict the market — you just need to prepare for it.
Thanks for reading, and have a great start to your trading week!
Let us know in the comments if you found this post valuable - and we might create a full series on applied trading psychology.
Jonas Lumpp
Speechless Trading
Disclaimer: This tutorial is for educational purposes only and does not constitute financial advice. Its goal is to help traders develop a professional mindset, improve risk management, and make more structured trading decisions.
US30: Bulls Are Winning! Long!
My dear friends,
Today we will analyse US30 together☺️
The recent price action suggests a shift in mid-term momentum. A break above the current local range around 46,809.99 will confirm the new direction upwards with the target being the next key level of 46,976.92 and a reconvened placement of a stop-loss beyond the range.
❤️Sending you lots of Love and Hugs❤️
going shorttoday we are looking at shorting opportunities on Us30 this is a very high risk trade given the trend sentiment

Us30 Trade Set Up Oct 21 2025Daily BSL have been swept and price is at a strong 4h resistance so if price sweeps PDL and closes under i will look for bearish structure on the 1m/5m forming IFVG/CISD to take sells to SSL or 50% of the 4h FVG but if price comes for SSL/London lows first i will look for short term buys to PDH

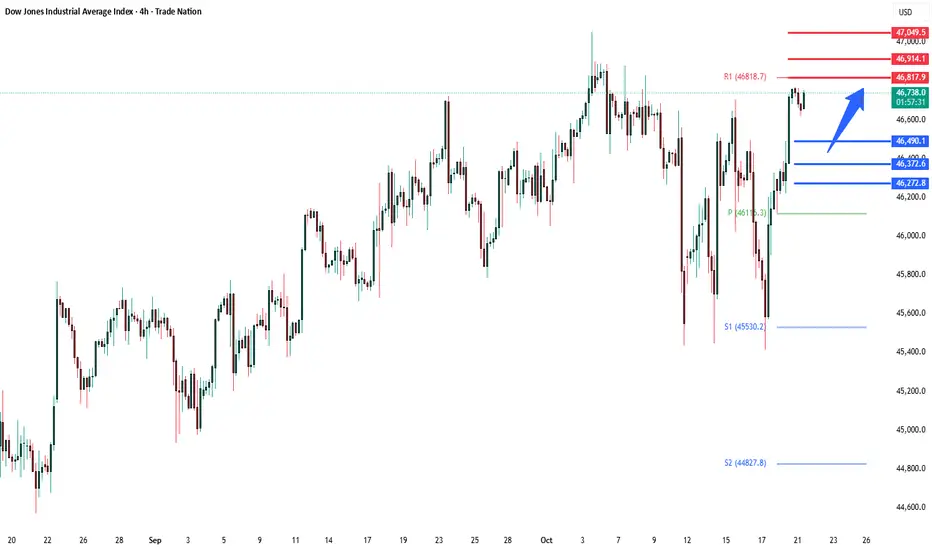
DowJones Key Trading LevelsKey Support and Resistance Levels
Resistance Level 1: 46817
Resistance Level 2: 46915
Resistance Level 3: 47050
Support Level 1: 46490
Support Level 2: 46370
Support Level 3: 46270
This communication is for informational purposes only and should not be viewed as any form of recommendation as to a particular course of action or as investment advice. It is not intended as an offer or solicitation for the purchase or sale of any financial instrument or as an official confirmation of any transaction. Opinions, estimates and assumptions expressed herein are made as of the date of this communication and are subject to change without notice. This communication has been prepared based upon information, including market prices, data and other information, believed to be reliable; however, Trade Nation does not warrant its completeness or accuracy. All market prices and market data contained in or attached to this communication are indicative and subject to change without notice.
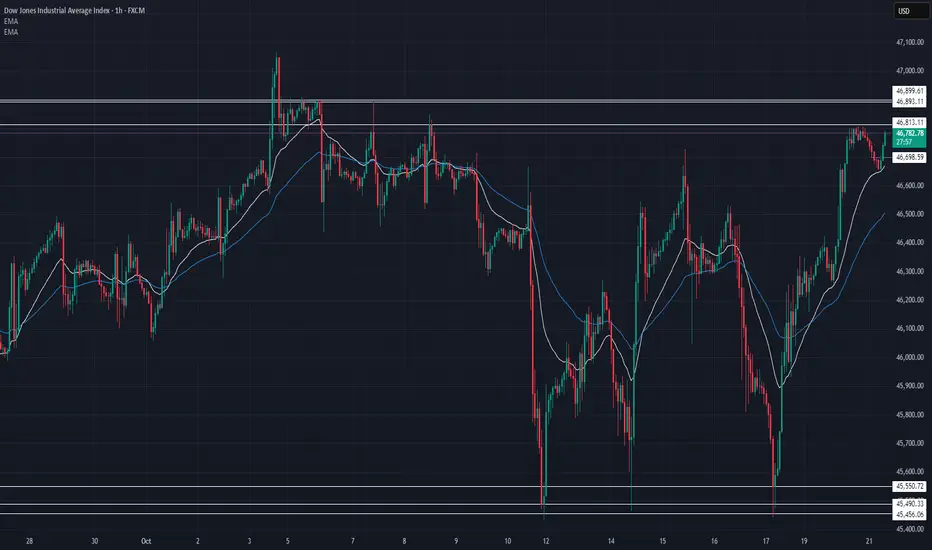
US30 Technical Breakdown – 10/21/2025📍 US30 Technical Breakdown – 10/21/2025
US30 showing strong bullish momentum after reclaiming the 46,600 zone 🚀. Buyers have stepped in aggressively, pushing price back toward key resistance — the market’s testing whether this is just a retracement or the start of a bigger breakout.
📊 Market Behavior:
🔹 Price broke above 46,500 structure zone
🔹 Now consolidating just under 46,800 resistance
🔹 EMAs fanning upward — short-term trend favoring bulls
📌 Key Levels:
🔹 Resistance Zones:
46,813 → intraday rejection zone
46,893 → major breakout target
46,900+ → bullish continuation potential
🔹 Support Zones:
46,700 → EMA short-term support
46,505 → key retest level
46,100 → lower structure support
45,550 → macro floor for bulls
🧠 Bias:
Bullish ⚡
➡️ Above 46,900 → continuation to 47,200 possible
⬅️ Below 46,500 → momentum weakens, 46,100 retest likely
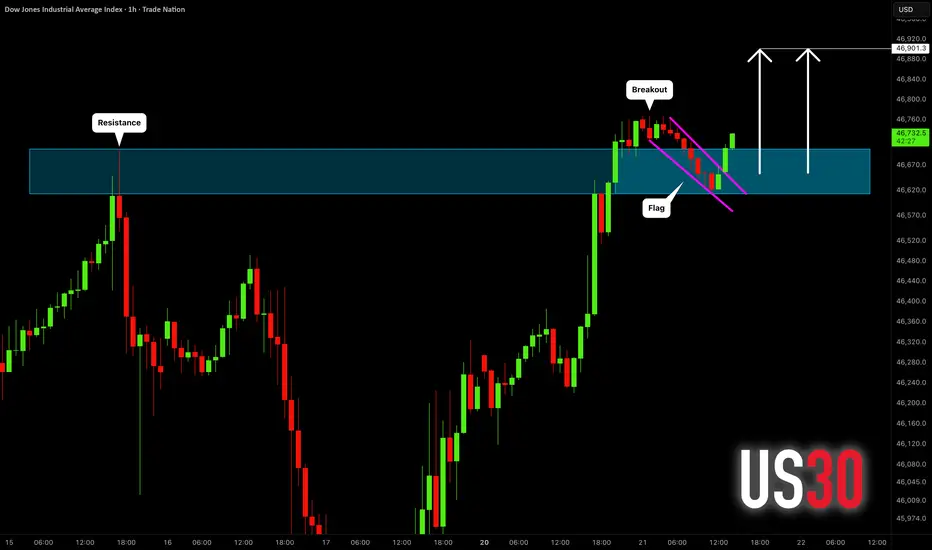
DOW JONES INDEX (US30): Bullish Continuation Confirmed
US30 index violated a major horizontal resistance yesterday.
The price started a correctional movement then, steadily
falling within a bullish flag pattern.
A breakout of its resistance line is a strong bullish signal.
Odds will be high, the index will hit 46900 level soon.
❤️Please, support my work with like, thank you!❤️
I am part of Trade Nation's Influencer program and receive a monthly fee for using their TradingView charts in my analysis.
US30 (Dow Jones) 4H AnalysisPrice has broken out of the falling wedge pattern and is now approaching a key retest zone around 46,600–46,650 & 46 400. I’m watching for a bullish confirmation on the retest to enter long, targeting the next resistance zones.
✅ Entry: On confirmed retest of the breakout zone
🎯 First Target: 47,450
🎯 Final Target: 48,227
🛑 Stop Loss: Below the support area around 46,450
The recent break of structure combined with bullish momentum and neckline breakout signals potential continuation to the upside this week.
📅 Looking for bullish continuation into higher resistance levels if price holds above the breakout zone.
Plan Your Stop Loss Before the Market Plans It for YouStop loss is not just a level on your chart, it’s your safety belt in trading. It’s what protects your capital when things don’t go in your favor.
Before you enter a trade, you should already know where your stop loss will be. It is less meaningful to decide it after you are in a trade because that’s where emotions take over.
Stoploss is not just a “feel comfortable" point, rather it is the place beyond which your whole idea goes wrong.
There are a few points that need to be focused before deciding your stoploss-
Support and Resistance
Open your trading time frame and go one step up.
Ex. if you trade on 5minute chart, go to 15minutes chart and if you trade on 1hour chart, go to 4hourly chart to identify support and resistance
Here are some clean step ups-
For day trade 1-5, 5-15, 15-60 (minutes)
For Swing trade 30-120, 60-240 (minutes)
For long term 1D-1W, 1W-1M
On the higher timeframe chart, identify important Support and resistance levels
Important support/resistance levels are those which have been tested multiple times or from where strong reactions have already been seen.
Identify the market direction
Up- Price making higher highs- higher lows
Down- Price making lower lows- lower highs formation
Sideways- Price trading in a tight range with no clear direction
If market is up- look for buying a pullback near support zones
If market is down- look for a selling a pullback near resistance zones
If market is sideways- buy near support and sell near resistance
Before you take your trade first know your risk in the trade
Identify the level beyond which your whole idea behind the trade goes wrong- this level is your stoploss
A stoploss could be below the support if you are looking to buy at support
Or this could be above resistance if you are looking to sell at resistance
Identify the next significant level- this is you target
The next resistance in case of long trade
Next support in case of short trade
Calculate if the distance from your entry and your target is more than the distance of your entry from the stoploss.
If it is more then, the reward-risk ratio is in your favor, and the idea is executable.
On the other hand, if the risk in a trade is more than the reward then the trade idea can be avoided.
Also decide your position size according to your stoploss
A wider stoploss means small position size so that you don't lose more than a fixed percentage per trade
A small stoploss means you can increase position size as you have more room to accommodate.
If you find that your stop has to be too wide to make sense, just don’t force the trade. Wait for a cleaner, tighter setup that fits your plan.
Deciding a stoploss is an essential part of your strategy. You might know all the candlestick patterns but without stoploss, they are more like tossing a coin.
Do you decide your stoploss beforehand or after taking a trade?
Tell me in the comment section.

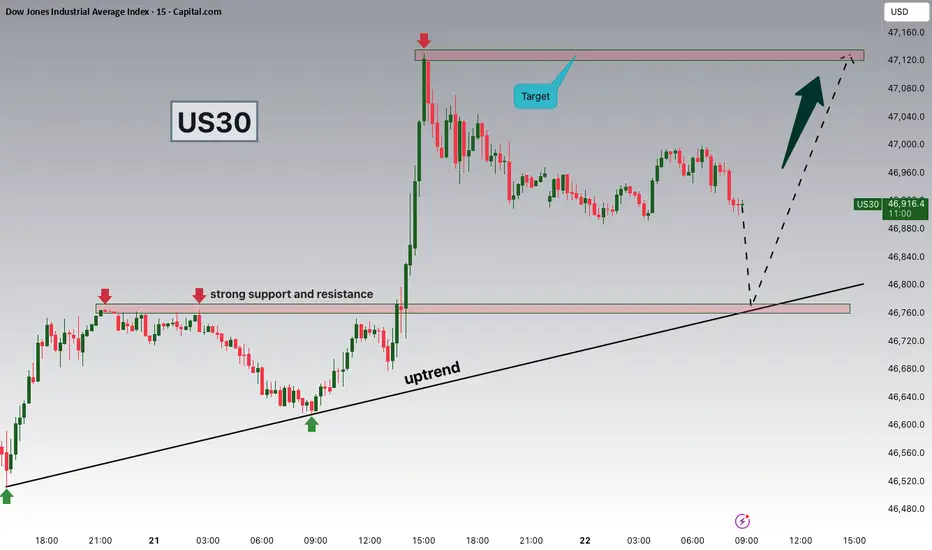
US30 Long Idea: Bullish Retest of Key Flipped LevelHello TradingView Community,
This post outlines a potential long trade setup on the Dow Jones Industrial Average Index (US30) on the 15-minute timeframe.
Technical Analysis:
The chart shows the price has been trading within a range, with a key horizontal level at approximately 46,732.10 acting as a significant resistance. We have recently seen a strong bullish breakout above this level, indicating that buyers may be taking control.
The trading idea is based on a classic "resistance-turned-support" pattern. After breaking out, the price is now pulling back to retest this former resistance from above. The expectation is that this level will hold as new support, providing a solid base for a continuation of the upward move.
Trade Setup:
The long position tool on the chart visualizes a potential trade plan for this bullish scenario:
Entry: Approximately 46,732.10 (at the retest of the new support).
Stop Loss: 46,490.84 (placed below the key support structure to invalidate the idea if the level fails to hold).
Take Profit: 47,430.58 (targeting a new higher high).
This setup provides a structured plan with a favorable risk-to-reward ratio for a potential continuation of the bullish momentum.
Disclaimer: This analysis is for educational and discussion purposes only and should not be considered as financial advice. Trading indices involves a high level of risk. Please conduct your own research and manage your risk appropriately.

Fractal Regression Analysis 2024-2025+ ...Imitation crab is one of my favorite breakfast meals. Somebody bought me a bowl of poke and left it in my building mailroom for me with no note for cutie.
Today is a bullish enfracting candle, which I pen and coin as what you see as the latter of the 2-3 days prior.
If you understand my prior fractal analysis and have not been removed from TradingView staff in the past two weeks, you are funny to me.
Most people don't understand me. Don't expect to see anything but dollar signs in your eyes.
With love,
Mostrararte