Trade ideas

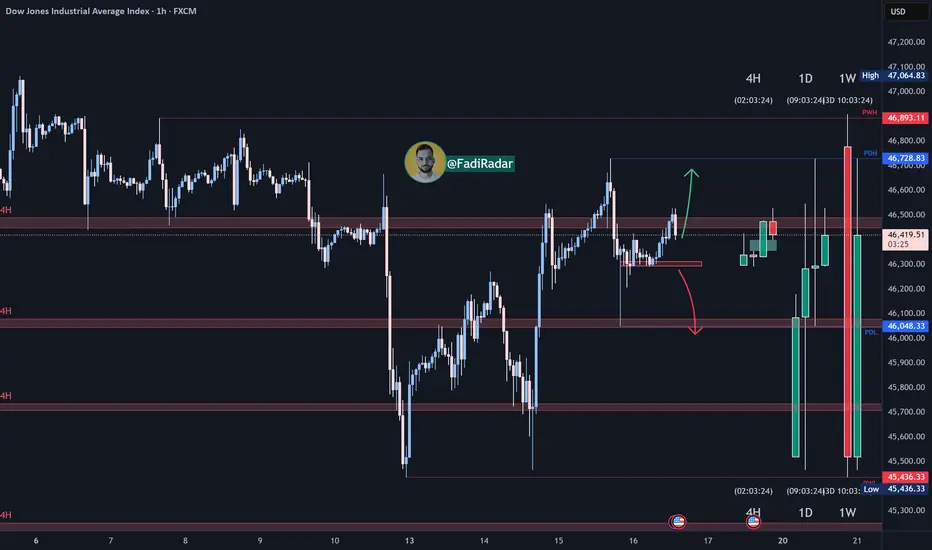
Us30 Trade Set Up Oct 16 2025Price is trading in between PDH/PDL and has filled a 4h and 1h bearish FVG so for sells id want to see London highs/BSL swept but closed under followed by internal 1m bearish structure to take sells to Asia lows/SSL or PDL but for buys id want to see Asia lows/SSl swept first to then look for bullish structure on the 1m to catch buys to PDH

Dow Jones (US30) Analysis:The Dow Jones index is moving in a short-term uptrend and is currently heading to test the 46,300 support zone, which is considered a good buying area if a bullish rebound occurs.
🔻 Bearish Scenario:
If the price breaks below 46,300 and holds, traders can look for short-term selling opportunities.
📈 Best Buy Zone: 46,300
📉 Best Sell Zone: below 46,300 after a confirmed break
US30 Technical Breakdown – 10/16/2025📍 US30 Technical Breakdown – 10/16/2025
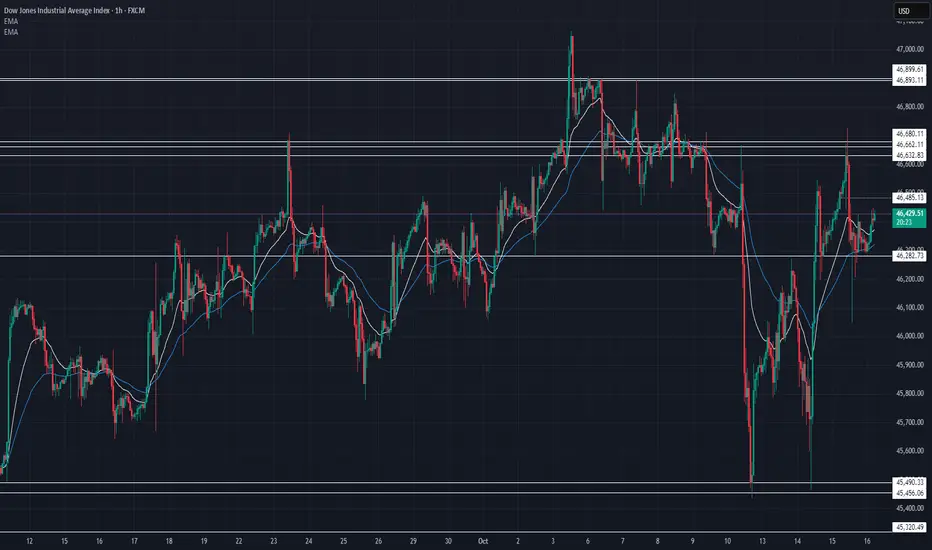
US30 showing strength again after defending the 46,200 zone 💪 Bulls holding control short-term but facing heavy resistance near 46,480–46,680. Market looks coiled for a breakout move soon ⚡️
📊 Market Behavior:
🔹 Strong bounce off 46,200 support zone
🔹 EMAs crossing bullishly on lower timeframes
🔹 Price retesting mid-range resistance — watching for momentum continuation
📌 Key Levels:
🔹 Resistance Zones:
46,485 → intraday barrier
46,632 → strong resistance
46,680 → breakout confirmation 🚀
46,893 → extended target
🔹 Support Zones:
46,282 → short-term support
46,200 → major pivot
45,837 → lower demand
🧠 Bias:
Bullish–Neutral 🟢
➡️ Above 46,680 → room toward 46,900
⬅️ Below 46,200 → momentum shift back to bears
US30 LONGThis is what im looking for in NY session waiting for a candlestick engulfing or pin bar or any bullish rejection form the zone to the upsisde. This is base of the 4hr time frame analysis

US30: Rebound before the stormTechnical Outlook – Wall Street Index (30-Minute Chart)
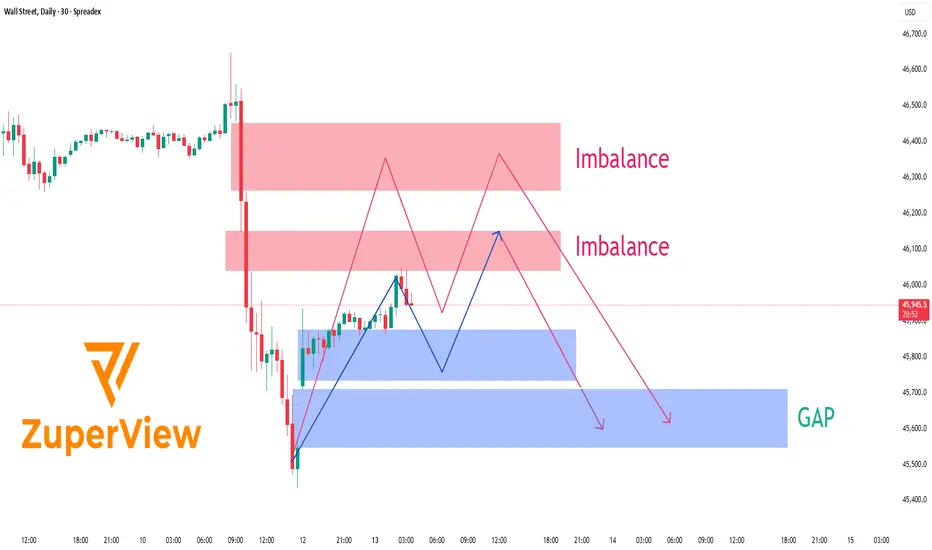
After the announcement that the U.S. will impose a 100 % tariff on Chinese imports, Wall Street ⚡ plunged sharply, leaving behind distinct Imbalance zones and an unfilled GAP lurking below current price levels.
At present, price is hovering around 45,950 💵, showing a modest rebound after tapping into a short-term demand zone. Above, two notable Imbalance areas stand out — around 46,000-46,150 and 46,250-46,450 - both formed as aggressive sell orders flooded the market following the latest wave of trade-war headlines 🌍.
The likely scenario 🎯:
Price could continue to retrace upward ↗️ to test one of these supply/imbalance zones before sellers re-enter the market. If selling pressure remains dominant, the index may resume its decline toward the GAP area around 45,500 - 45,650 📉, where liquidity is still unfilled and buyers may look to step back in.
Current price action indicates a corrective pullback rather than a full reversal. Trading volume is thinning 📉, candlestick patterns show signs of exhaustion 🕯️, and the upper imbalance zones remain untouched — all signaling that sellers still hold the upper hand.
________________________________________
🌍 Fundamental Context – U.S. vs. China Tensions Heating Up
On October 10, President Trump officially declared a 100 % additional tariff on Chinese goods, effective November 1, 2025 — the most aggressive move since the 2018-2019 trade war.
Beijing immediately condemned the plan, warning of “corresponding countermeasures”, including restrictions on rare-earth exports and higher port fees on U.S. vessels. While strong in tone, China has so far stopped short of announcing a direct tariff retaliation, signaling a cautious approach while keeping the door open for talks.
Washington, meanwhile, insists the measure aims to “protect American interests and reduce over-reliance on China’s supply chains,” but officials also noted that negotiations remain possible if China shows “substantive goodwill.”
Financial markets reacted swiftly 💥:
• U.S. and Asian equities dropped 2–3 % on average.
• USD strengthened, while gold and JPY rallied as safe-haven flows increased.
• Tech and industrial stocks with strong China exposure saw the largest losses.
Overall, risk sentiment remains fragile as investors brace for a prolonged phase of trade uncertainty.
________________________________________
💡 Trading Summary
Short-term structure favors a sell-the-rally approach. The market may retest upper imbalance zones before resuming its downtrend toward the 45,500 USD GAP area.
If U.S.–China tensions intensify further, downside momentum could accelerate. Conversely, any sign of renewed dialogue or tariff delay could trigger a short-term rebound — but bias remains bearish until the market reclaims 46,300 USD convincingly.
In short: patience, risk control, and reaction to headlines are key this week. ⚖️
Please like and comment below to support our traders. Your reactions motivate us to do more analysis in the future 🙏✨
Harry Andrew @ ZuperView
US30: Flash pump not enough to break resistanceSPREADEX:DJI Analysis – Weak flash pump signals a possible pullback ahead.
📊 Technical Overview
On the 30-minute timeframe, Wall Street (US30) has recently shown a quick rebound — a flash pump — after a strong flash dump earlier in the week. Price is now trading near the 46,400 – 46,500 area, right below the major resistance zone between 46,600 – 46,750 (highlighted in green).
Below, the support range around 46,050 – 46,200 (marked in red) remains the key demand area.
⚙️ Market Structure Insight
The recent flash pump recovered quickly from the previous drop, but the momentum appears insufficient to break through the prior flash dump zone. This imbalance often indicates a short-term exhaustion in buying pressure, meaning the market could need one more corrective leg before finding new strength.
🧭 Main Scenario
The most likely scenario is that price will move sideways or slightly pull back toward the 46,200 support zone before deciding its next major move.
• If buyers defend 46,200 successfully, the index could attempt another test of 46,700.
• However, failure to hold that support might open the door to a deeper correction.
💡 Personal View
The weak flash pump following the previous flash dump signals that the market is still in a consolidation and absorption phase. A short-term pullback could help reset momentum before a more sustainable trend emerges.
⛔ This analysis represents a personal technical perspective and should not be taken as investment advice. Always manage your risk before entering any position.
Please like and comment below to support our traders. Your reactions will motivate us to do more analysis in the future 🙏✨
Harry Andrew @ ZuperView

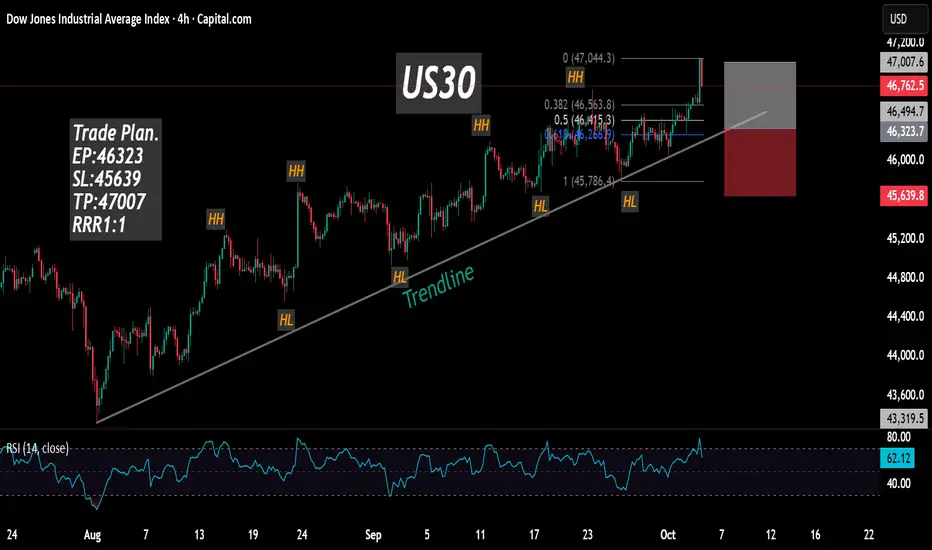
US30 Trade Plan – Range Breakout + Smart Money ManipulationI’m currently watching the US30 (Dow Jones Index) 🏦. On the 4-hour timeframe, we can see a strong uptrend forming — higher highs and higher lows 📈. Whether this trend continues remains to be seen, but having a solid trading plan is key ✅.
Here’s mine: On the 30-minute timeframe, price is currently moving within a defined range. If we see a break above the range, followed by a retracement and failed retest of the range high, I’ll be looking for a long opportunity 🚀.
If price instead breaks below the range, there could also be a short opportunity, though my preference is to stay long given the higher-timeframe bullish structure ⚙️.
⚠️ Keep an eye out for market manipulation — smart money algorithms often trigger fake breakouts to draw in buyers before sweeping liquidity and continuing the move. Stay alert and manage risk carefully.
📉 Disclaimer: This content is for educational purposes only and not financial advice.

Liquidity Sweep + PRZ = The Perfect Setup? Dow Jones Outlook🔹 Multi–Timeframe Liquidity & PRZ Analysis
Welcome traders! 👋
I’m glad to have you here — we’re all learning and growing together in this amazing trading journey.
Let’s dive into today’s analysis on DJI 👇
Today, we’ll break down the Dow Jones setup step-by-step — identifying where liquidity sits and what the institutions might be planning next.
📊 On the weekly timeframe, the Dow Jones Index remains in a strong bullish trend.
However, on the daily timeframe, we can clearly see a bearish correction phase taking place.
Yesterday, price collected buy-side liquidity from the upper zones and then started a sharp downward move.
🧩 H4 Timeframe
On the 4-hour chart, price is currently approaching a Potential Reversal Zone (PRZ) — an area where several key confluences align:
🟢 1H Breaker Block
🟣 Imbalance Zone
🔵 50% of the Daily Candle Shadow
This confluence area makes the zone highly significant for potential reactions.
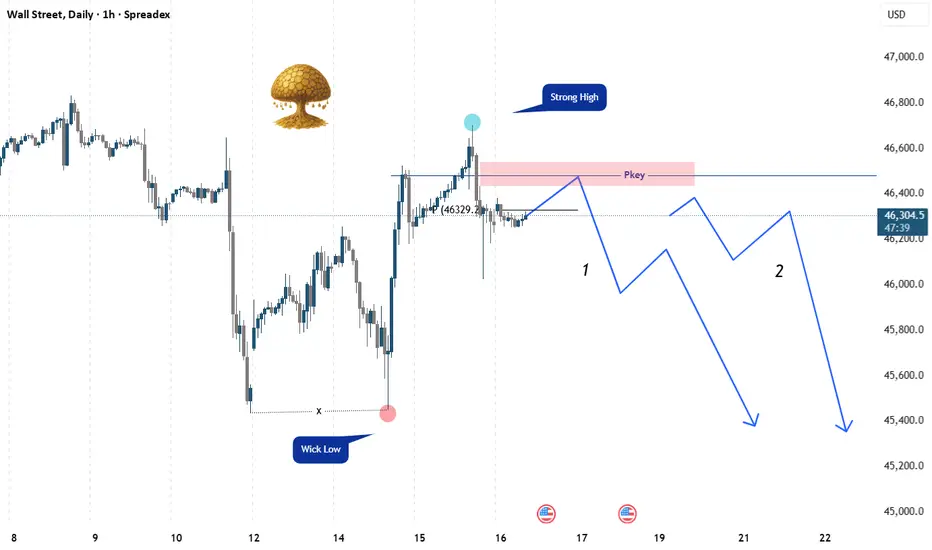
🎯 My Scenarios for Dow Jones:
📉 Scenario 1:
After tapping into the PRZ and forming a confirmation signal on lower timeframes (M15–M5), price may start a downward move.
This move could happen during the London Session, after sweeping the Asian high, or during the New York Session following a liquidity grab above.
📉 Scenario 2:
Alternatively, price may start dropping without fully reaching the PRZ.
In that case, if we see lower highs and lower lows forming on the 1H or 4H, we can take an entry after confirmation.
🎯 The main target would be the liquidity below the double-bottom area.
⚠️ Important Note:
No analysis is 100% certain — always wait for clear confirmations before entry, manage your risk, and stay aware of market news.
💬 I’d love to hear your thoughts 👇
Do you think Dow Jones will drop from here or go for one more liquidity grab above?
📘 Educational Note:
This analysis is for educational and illustrative purposes only.
Always follow your own plan, confirm with your strategy, and manage risk carefully.
Success in trading comes from discipline, patience, and consistency. 💪
🚀 Empowering traders through clarity, confidence & clean charts.
Follow 👉 @parisa_tl for more SMC setups and weekly insights 💙
#DowJones #DJI
Midnight SeekerI doubt there will be a downward manipulative move before an initial one, what do you see?

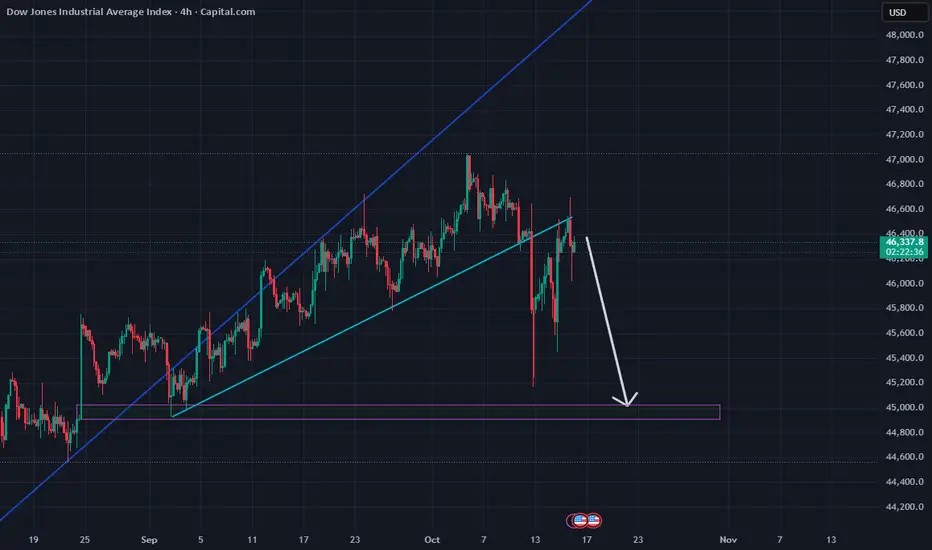

US30 remains in a broader bearish trendThe US30 futures advanced on Monday, recovering from Friday’s pullback as investors shifted back into risk assets following reports of a softer stance from former President Trump on China. This improved sentiment led to short-term buying across U.S. equity futures.
Technical Analysis
Technically, the US30 remains in a broader bearish trend, with the recent bounce seen as a potential pullback toward resistance As long as price holds below key resistance levels, the bias remains bearish, and a reversal to the downside is likely.
Resistance zone: 46,000 – 46,300
Support levels: 45,200 → 44,500
A rejection from resistance could confirm continuation of the downtrend, targeting the support zones mentioned above. However, a break and close above 46,300 would invalidate the bearish structure and open the way for further upside momentum.
You may find more details in the chart.
Trade wisely best of Luck.
Ps; Support with like and comments for better analysis Thanks for Supporting.
US30 Short From Resistance!
HI,Traders !
#US30 went up sharply
But the price will soon hit
A wide horizontal resistance
Of 46641.8 from where we will
Be expecting a pullback and
A local move down !
Comment and subscribe to help us grow !

The ugliest crash in our history close? I truly believe with western powers developing digital IDs and other technology, etc. to monitor and control the public... and in some cases replace the human race... it's in line with what I believe will be one of the biggest market crashes in human history, equal or bigger to 1929.
GET READY.
IT WILL HAPPEN WITHIN THE BLACK ZONE.
The powers in control know!
The 2030 Agenda is prepared for this.
And they are keeping the public distracted.
History repeats!
There is a purpose to everything!

Us30 Trade Set Up Oct 15 2025Price has swept PDH and has formed a bullish 4h FVG which i am expecting price to come to 50% of it before continuing higher

Can Dow Jones Maintain Bullish Momentum? Analysis🎯 US30 Dow Jones: The Great Heist Setup! 🏦💰
📊 Asset Overview
US30 (Dow Jones Industrial Average) - CFD Index
Trade Type: Swing/Day Trade
Bias: BULLISH 🐂
🔍 The Master Plan: Double Moving Average Confirmation
We're hunting for a pullback retest at two critical moving averages acting as dynamic support:
✅ Simple Moving Average (SMA) alignment
✅ Kijun-Sen (Ichimoku baseline) confluence
This double confirmation gives us the green light to ride the bullish trend with institutional-level precision. Think of it as the market leaving the vault door slightly open... 🚪💎
🎯 Entry Strategy: The "Thief Layering" Method
Primary Approach: Multiple Buy Limit Orders (Layering Strategy)
Recommended Layer Entry Zones:
🟢 Layer 1: 46,000
🟢 Layer 2: 46,200
🟢 Layer 3: 46,400
💡 Pro Tip: You can add more layers based on your risk appetite and position sizing. This strategy allows you to average into the position as price pulls back to support—like catching falling diamonds! 💎
Alternative: Market execution at any pullback to the moving average confluence zone.
🛡️ Risk Management
Stop Loss: 45,600
⚠️ Important: This is MY stop loss level based on technical invalidation. You're the captain of your own ship—adjust according to YOUR risk tolerance and account size. Trade at your own risk!
🎯 Target Zone: The Police Barricade
Take Profit Target: 47,600 🚨
This level represents:
🚧 Strong resistance zone (the "Police Barricade")
📈 Potential overbought conditions
Bull trap territory
Strategy: Scale out or secure profits as we approach this level. Remember: realized profits are better than paper gains!
⚠️ Reminder: This is MY take profit target. Your exit strategy should align with your trading plan and risk management rules. Lock in profits when YOU'RE comfortable!
🌐 Correlated Assets to Watch
Keep an eye on these related instruments for confluence:
SP:SPX (S&P 500): Broad market sentiment indicator—if SPX shows strength, US30 typically follows
SEED_ALEXDRAYM_SHORTINTEREST2:NQ (Nasdaq 100): Tech-heavy index correlation—risk-on appetite confirmation
TVC:DXY (US Dollar Index): Inverse correlation—weaker dollar often supports equity indices
TVC:TNX (10-Year Treasury Yield): Rate sensitivity—lower yields can fuel equity rallies
TVC:VIX (Volatility Index): Fear gauge—declining VIX supports bullish setups
Key Correlation Note: When these indices move in harmony with declining dollar strength, it strengthens the bullish case for US30. Watch for synchronized moves!
📝 Technical Summary
Trend: Bullish structure intact
Confirmation: Dual moving average support
Risk/Reward: Favorable with 400-1,600 point profit potential (depending on entry layer)
Time Frame: Swing to day trade duration
Strategy Style: "Thief layering" - accumulate on pullbacks
✨ If you find value in my analysis, a 👍 and 🚀 boost is much appreciated — it helps me share more setups with the community!
⚠️ Disclaimer
This "Thief Style" trading strategy is shared for educational and entertainment purposes only. This is NOT financial advice. Trading involves substantial risk of loss. Always conduct your own analysis, manage your risk appropriately, and never trade with money you cannot afford to lose. Past performance does not guarantee future results. You are solely responsible for your trading decisions.
#US30 #DowJones #SwingTrading #DayTrading #TechnicalAnalysis #MovingAverages #LayeringStrategy #IndexTrading #BullishSetup #TradingStrategy #CFDTrading #PriceAction #SupportAndResistance #TradingIdeas #MarketAnalysis #ThiefStyle

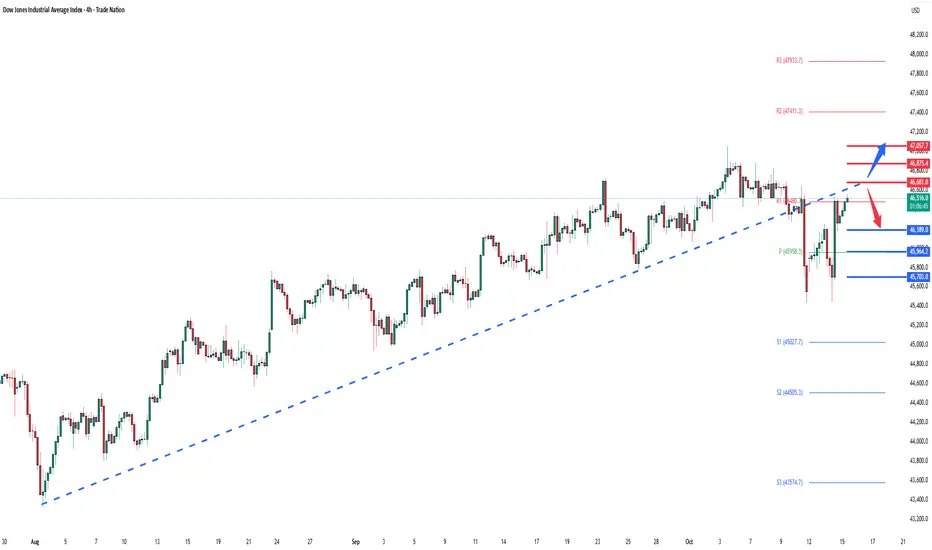
DowJones retest of pivotal 46680 level? Key Support and Resistance Levels
Resistance Level 1: 46680
Resistance Level 2: 46875
Resistance Level 3: 47060
Support Level 1: 46190
Support Level 2: 45965
Support Level 3: 45700
This communication is for informational purposes only and should not be viewed as any form of recommendation as to a particular course of action or as investment advice. It is not intended as an offer or solicitation for the purchase or sale of any financial instrument or as an official confirmation of any transaction. Opinions, estimates and assumptions expressed herein are made as of the date of this communication and are subject to change without notice. This communication has been prepared based upon information, including market prices, data and other information, believed to be reliable; however, Trade Nation does not warrant its completeness or accuracy. All market prices and market data contained in or attached to this communication are indicative and subject to change without notice.
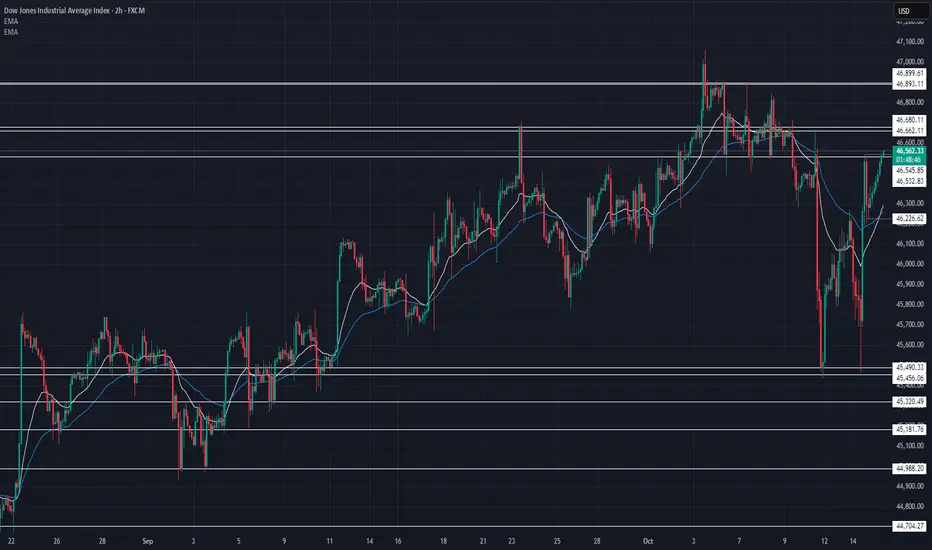
US30 Technical Breakdown – 10/15/2025📍 US30 Technical Breakdown – 10/15/2025
US30 bouncing strong from 45,600 support 🔥 — bulls pushing price back into a key resistance zone near 46,550–46,680. Momentum picking up but still under a heavy ceiling 💪📈
📊 Market Behavior:
🔹 Sharp recovery after double bottom around 45,600
🔹 EMAs turning bullish again after crossover
🔹 Price testing resistance — potential breakout or rejection zone
📌 Key Levels:
🔹 Resistance Zones:
46,545 → intraday resistance
46,662 → strong ceiling
46,680–46,900 → breakout area 🚀
🔹 Support Zones:
46,226 → short-term support
45,837 → mid-level demand
45,490 → deep pullback zone
🧠 Bias:
Bullish–Neutral 🟢
➡️ Above 46,680 → potential breakout toward 46,900
⬅️ Below 46,220 → possible retrace to 45,800
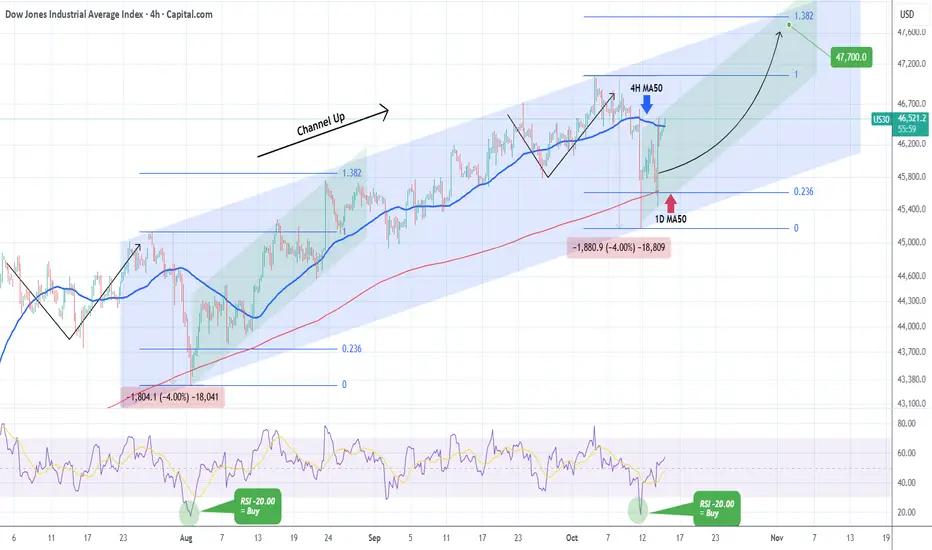
DOW JONES bounced at the bottom of the Channel Up. Buy signal.Dow Jones (DJI) has been trading within a 3-month Channel Up, with last Friday's flash crash breaching marginally below its 1D MA50 (red trend-line). That touched the bottom of the pattern and is technically a Higher Low, identical to the what the previous Bearish Leg did on the August 01 Low.
As you can see both Legs declined by -4.00% with their 4H RSIs touching the -20.00 level and rebounded. That is a technical Buy Signal, the strongest you can get within this Channel Up, and as long as the pattern's bottom holds, we expect another rise to the 1.382 Fibonacci extension (Our Target is 47700), similar to August's Bullish Leg.
-------------------------------------------------------------------------------
** Please LIKE 👍, FOLLOW ✅, SHARE 🙌 and COMMENT ✍ if you enjoy this idea! Also share your ideas and charts in the comments section below! This is best way to keep it relevant, support us, keep the content here free and allow the idea to reach as many people as possible. **
-------------------------------------------------------------------------------
💸💸💸💸💸💸
👇 👇 👇 👇 👇 👇
US30DJI - Dow Jones
- Bullish Channel as an corrective pattern in Long Time Frame
- Break of Structure
- Fibonacci Level - 38.20% / 50.00%
- Completed " 12345 " Impulsive Waves and " A " Corrective Waves
- Demand Zone

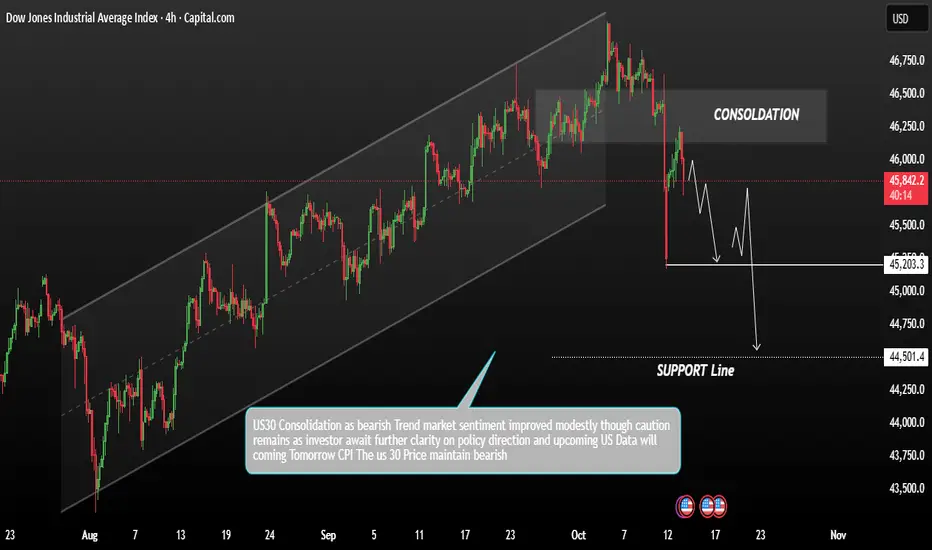
US30 | Sellers in Control Below ResistanceUS30 – Overview | Bearish Momentum Below 46,565
The index holds a bearish momentum while trading below the 46,565–46,640 zone, signaling continued downside pressure after recent rejections near resistance.
As long as price remains under this pivot area, the trend is expected to stay bearish, targeting 46,400 → 46,250 → 46,000.
A 1H close above 46,640 would shift sentiment bullish, opening the path toward 46,810 → 47,090.
Pivot Zone: 46,565 – 46,640
Support: 46,400 – 46,250 – 46,000
Resistance: 46,810 – 47,090 – 47,300
