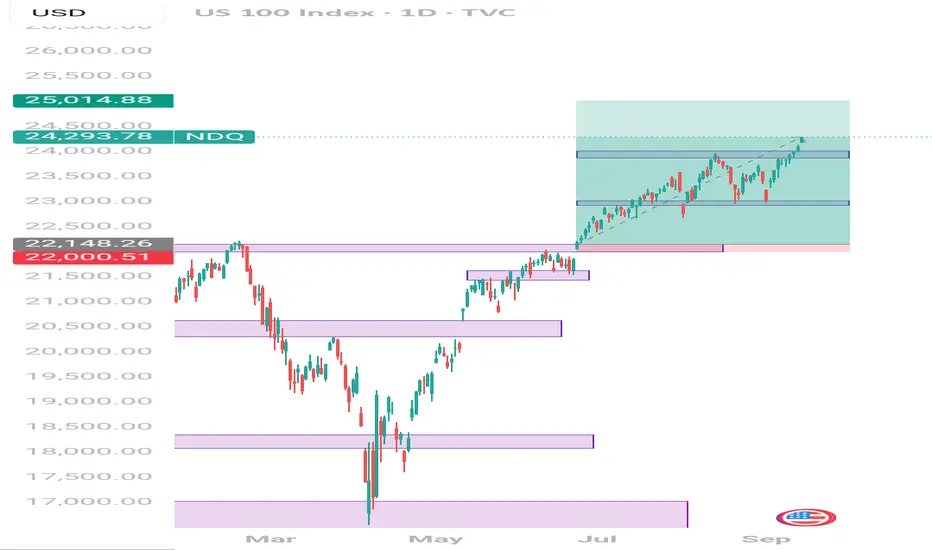
Nasdaq long position Nasdaq headed for $25,000. Recently Nasdaq surpassed my target of $24,000 and seems like the bullish momentum won't be stopping anytime soon. I have optimism of Nasdaq reaching $26,000 before the year ends.
NDQM trade ideas
NAS100 Breakout – Eyeing New HighsPrice is breaking out of range. Aggressive: retest of range top toward trend line. Conservative: deeper pullback to 50% of range with stops outside.

NSDQ100 awaits Fed rate decision supported at 23940Nasdaq 100 Trading Takeaways
Fed in focus: Markets expect a 25bp cut today, though risks of larger/smaller moves exist with potential dissents on both dovish and hawkish sides. Trump’s newly sworn-in appointee Miran may push for 50bp, while Schmid could dissent hawkishly. This adds event risk and volatility for tech stocks.
Macro backdrop: Trump state visit to the UK highlights investment pledges and a potential US-UK tech partnership, which could support sentiment in large-cap tech.
Market moves:
S&P 500 (-0.13%) pulled back from record highs.
Nasdaq leadership held firm: Magnificent 7 (+0.55%) hit a new record, showing resilience even as breadth weakened.
Broader weakness evident – third straight day of more decliners than advancers.
Sector divergence: Energy (+1.73%) outperformed on higher Brent crude (+1.53%), but tech still provided upside leadership.
Implication for Nasdaq 100:
Short-term: Expect heightened sensitivity to Fed outcome – dovish signals/50bp risk would boost mega-cap tech, while hawkish dissent could trigger profit-taking.
Medium-term: Tech remains the relative outperformer, with new highs in the Magnificent 7 signaling continued defensive growth positioning despite weaker breadth.
Key Support and Resistance Levels
Resistance Level 1: 24470
Resistance Level 2: 24600
Resistance Level 3: 24800
Support Level 1: 23940
Support Level 2: 23760
Support Level 3: 23430
This communication is for informational purposes only and should not be viewed as any form of recommendation as to a particular course of action or as investment advice. It is not intended as an offer or solicitation for the purchase or sale of any financial instrument or as an official confirmation of any transaction. Opinions, estimates and assumptions expressed herein are made as of the date of this communication and are subject to change without notice. This communication has been prepared based upon information, including market prices, data and other information, believed to be reliable; however, Trade Nation does not warrant its completeness or accuracy. All market prices and market data contained in or attached to this communication are indicative and subject to change without notice.

NAs100 ShortElite Analysis
Confirmation met
Price reacting off structural liquidity
Targeting lower liquidity pools

3rd Short term trade with NASDAQAfter two consecutive profits on the NASDAQ, I hope this third trade will also yield satisfactory result. A good risk-reward ratio is crucial in trading.

NASDAQ | H2 Double Top | GTradingMethodHello Traders! 👋
🧐 Market Overview:
CPI is out today — and it could be the spark the NASDAQ needs. Price is stalling at the previous all-time high, and that’s where I’m watching closely.
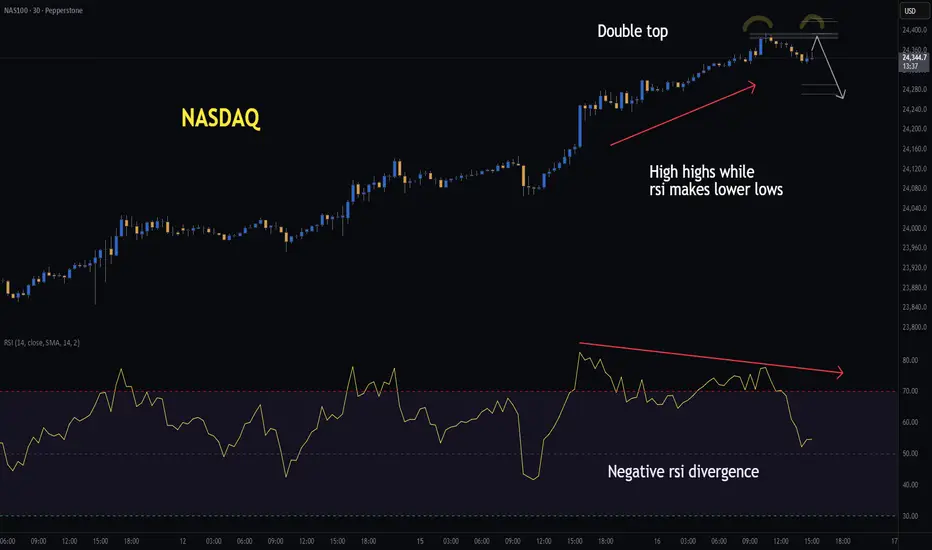
I’ve been tracking a double top on the daily for a while now, and today the H2 chart is starting to show the same structure. That kind of multi-timeframe alignment doesn’t happen often.
📊 Trade Plan:
I’ve entered a starter short on the daily structure. If the H2 confirms, I’ll scale in with a second position.
Risk/Reward:
Entry:
Stop Loss:
Take Profit 1 (50%):
Take Profit 2 (50%):
💡 GTradingMethod Tip:
Double tops work best when paired with other signals. In my system, I look for:
- RSI negative divergence
- Lower volume on the second top
- A confirmation candle close within my entry range
This reduces false signals and adds conviction.
🙏 Thanks for reading! Do you trade double tops?
📌 Disclaimer:
This is not financial advice. This content is to track my trading journey and for educational purposes only.

Nasdaq bullish trendThe Nasdaq trend is quite bullish, but we must be very cautious in selling positions and not take trades against the trend. The best ranges for buying MPLs have been identified.

NASDAQ | H1 Double Top | GTradingMethodHello Traders,
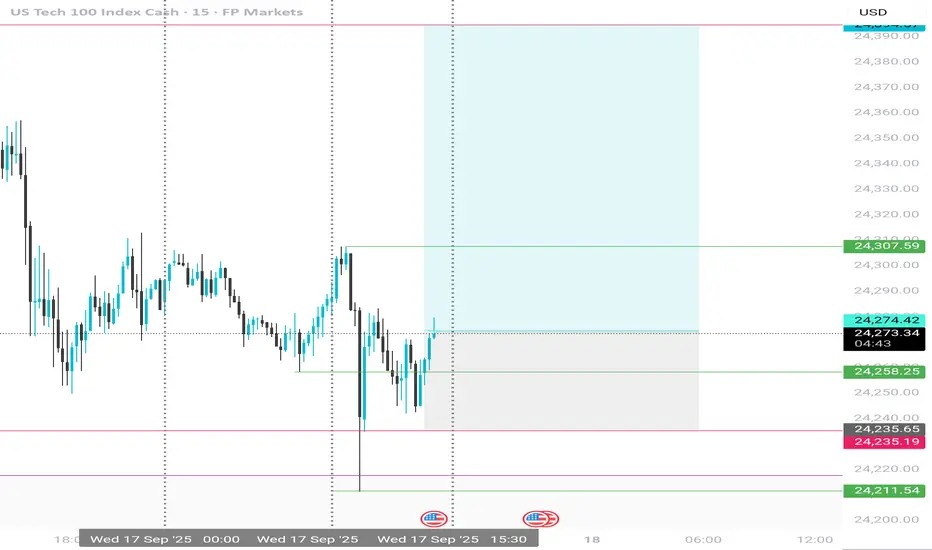
I’m watching the Cash100 for a potential double top that could set up a short opportunity. Price is currently making higher highs while RSI is making lower lows — a clear sign of weakening buying momentum, also known as negative RSI divergence.
As further confluence, we have the FOMC tomorrow, and markets often prefer to de-risk ahead of such events. Also, there is a rising wedge on the S&P500 on the hourly chart and the chance that there is also a potential double top on the 30min timeframe.
✅ Conditions before entry:
- 30min candle must close within the range and at the correct level
- The closing candle must meet my required closure rate
- Ideally, volume should be lower (though I’ll allow an exception given it will be the U.S open)
- RSI should confirm with another divergence
📊 Trade Plan:
Risk/Reward: 2.9
Entry: 24,385.1
Stop Loss: 24,418.6
Take Profit 1 (50%): 24,290
Take Profit 2 (50%): 24,271
💡 GTradingMethod Tip:
Patterns like double tops are powerful, but they’re strongest when combined with momentum divergence. Always confirm multiple factors before entering.
🙏 Thanks for checking out my post!
Follow me for the next update and feel free to share your thoughts below — I’d love to hear them.
📌 Please note: This is not financial advice. This content is to track my trading journey and for educational purposes only.
NAS100 Technical Forecast: Key Levels & Traps🚀 NAS100 Technical Forecast: Key Levels & Traps 🐻
*Analysis as of Sept 20, 2025 (12:50 AM UTC+4)*
📊 Overall Market Context:
Price: 24,610. Geopolitical events remain a key volatility driver. Current price action suggests a cautious market seeking direction after recent moves.
🔍 Key Technical Indicators:
• RSI (14): Neutral zone (~50). No strong overbought/oversold signal.
• Bollinger Bands (20): Price near the middle band, indicating balanced volatility.
• Moving Averages: Watching for a potential bearish crossover on the 4H chart. Key resistance at the 50-EMA.
• VWAP: Current price trading around the session's VWAP; a break above signals intraday bullish bias.
🎯 Critical Support & Resistance:
• Immediate Resistance: 24,800 -> 25,000 (Psychological)
• Strong Resistance: 25,250 (Previous High)
• Immediate Support: 24,500 -> 24,300
• Strong Support: 24,000 (Key Level)
⚠️ Pattern Watch:
• Bull Trap Risk: A false breakout above 24,800 could lure buyers before a drop.
• Bear Trap Risk: A sharp rejection from 24,300 could trap sellers before a rally.
• No clear Harmonic or Elliott Wave pattern on lower timeframes; monitoring for setup.
📈 Intraday Trading (5M-1H Charts):
• BUY (Long): Above 24,650, targeting 24,800. Stop Loss: 24,550.
• SELL (Short): Below 24,500, targeting 24,300. Stop Loss: 24,650.
*Confirmation: Use 5-min RSI divergence and volume spikes.*
📉 Swing Trading (4H-Daily Charts):
• BUY Swing: On a bullish reversal candle at 24,300 support, target 25,000+. SL below 24,000.
• SELL Swing: On a rejection at 24,800 resistance, target 24,000. SL above 25,100.
*Wait for a 4H close above/below key levels for confirmation.*
🎲 Risk Management:
Always use a 1:2 Risk/Reward ratio. Protect your capital.
For individuals seeking to enhance their trading abilities based on the analyses provided, I recommend exploring the mentoring program offered by Shunya Trade. (Website: shunya dot trade)
I would appreciate your feedback on this analysis, as it will serve as a valuable resource for future endeavors.
Sincerely,
Shunya.Trade
Website: shunya dot trade
📝 TRADING CHECKLIST
Before entering any position:
- ✅ Confirm volume supports move
- ✅ Check RSI for divergences
- ✅ Verify multiple timeframe alignment
- ✅ Set stop loss before entry
- ✅ Calculate position size
- ✅ Review correlation with DXY/SPX
- ✅ Check economic calendar
- ✅ Assess market sentiment
⚠️Disclaimer: This post is intended solely for educational purposes and does not constitute investment advice, financial advice, or trading recommendations. The views expressed herein are derived from technical analysis and are shared for informational purposes only. The stock market inherently carries risks, including the potential for capital loss. Therefore, readers are strongly advised to exercise prudent judgment before making any investment decisions. We assume no liability for any actions taken based on this content. For personalized guidance, it is recommended to consult a certified financial advisor.

Nasdaq records near critical resistance! More to go or crash?Strong economic data suggest the soft landing scenario remains intact. Manufacturing strength, combined with improving employment data, appears to provide support. The Fed's dovish pivot also offers liquidity tailwinds, while the Nvidia-Intel partnership signals continued investment in US stocks.
But is the market reading the signals?
Strong employment data could actually be bearish for equities since it reduces the urgency for the Fed to cut. The Fed's dot plot already shows fewer 2026 cuts (only one instead of three) with higher growth and (slightly higher) inflation projections. The Nvidia-Intel deal also excludes Intel's struggling foundry business, a core problem for the company.
Technicals are not too promising either. Multiple resistance factors converge just a tad higher if not at current levels:
Long-term trendline from November 2021
138% Fibonacci level
Triangle pattern measured move completion
100% Fibonacci expansion target
Indicators flash warnings too:
RSI second divergence since May (price up, momentum flat)
Volume oscillator 13% below zero - lack of institutional buying
Missing third-wave volume surge - typical bull pattern absent
Fifth-wave characteristics suggesting impulse completion
As we trade in the historically worst month for equities, where the NASDAQ typically underperforms the S&P 500 during September selloffs, a high-probability short setup could be underway:
Entry : 24,700-24,750 area (resistance test)
Stop : Above 25,000 (avoid false breakout)
Targets : 23,700 → 22,730 → 22,200
Risk-Reward : Approximately 2.6:1 to first major support
Prefer a 5-wave decline if bear case confirms, followed by a 3-wave up, then continuation lower.
Watch 24,500 as it appears to be a decision point where multiple technical and fundamental factors converge.
This content is not directed to residents of the EU or UK. Any opinions, news, research, analyses, prices or other information contained on this website is provided as general market commentary and does not constitute investment advice. ThinkMarkets will not accept liability for any loss or damage including, without limitation, to any loss of profit which may arise directly or indirectly from use of or reliance on such information.

NAS100 Short SetupTrend: Bullish
Divergence: Bearish
Continuation Pattern : None
Reversal Pattern: Double Top
Bias: Bearish
Scenario: Sell Stop at Neckline breakout
Trade Plan
Stop Loss 24750
Entry Level 24400
TP1 24230

NAS100 ShortElite analysis
Discretionary trade with confirmations
Targeting London liquidity
Executed on the 30 second time frame

NAS100 longits broke weekly resistance and i think its going to go up from this current price, since its the stockmarket the tp is high cause of how it moves. long term swing.

Central bank week ahead!Central bank week ahead! We've got interest rate decisions out from the Bank of Canada, FED, Bank of England and Bank of Japan.
BoC 17/09 - 25bps cut 94% - First on the chopping board is the BoC who are set to reduce interest rates by 0.25%. This comes amid steady inflation, holding below the 2% target and below recent expectations for an increase, currently at 1.9%. They've also seen unemployment rising to 7.1%, the highest level since 2021. The BoC has acknowledged the weakening labour market but are expected to follow a wait and see approach after todays cut. Current rates 2.75%
FED 17/09 - 25bps cut 98% - The FED's first rate decision after some very rocky labour market data and a surprise dovish tilt from Powell at Jackson Hole. Inflation remains sticky but the FED has stated that their current focus is set on labour market weakness. As well as the rates, we will also receive updated economic and interest rate projections, likely to carry much more weighting and longer term direction. In the economic projections we'll be looking out for the dot plot, GDP, employment and inflation to gauge future expectations for FED rates. This could undermine or support the rate cuts to trade with caution. Current rates 4.25-4.50%
BoE 18/09 - HOLD 100% - The BoE is set to hold rates steady at 4.00% amid elevated inflation data and recently positive labour market data. Inflation data came in lower than consensus earlier this week but still remains well above target at 3.8%. In the previous BoE meeting we saw a surprise hawkish tilt in the way of MPC voting.
2 members shifted from voting to cut to voting for a hold and the scales are expected to remain fairly heavy on the hold side tomorrow. The member voting and minutes will provide much needed context to the potential hold to come. Current rates 4.00%
BoJ 19/09 - HOLD 87% - Rounding a busy week off with the BoJ who is set to hold rates at 0.50%. There has been some hawkish comments from the BoJ in recent times as inflation holds around 3.1% and unemployment recovers from 2.5% to 2.3% but amid political turbulence a bold move from the BoJ in this decision is less likely. However the other potential would be for a surprise rate hike with a current probability of 11%. The BoJ is no stranger to surprises so will be looking out for any action or comments made to support future JPY strength or weakness. Current rates 0.50%
These fresh rates provide the opportunity for divergences between monetary policy. This could park the continuation higher for pairs such as EURUSD and GBPUSD if the fed sticks to a more dovish tilt and supports this in their economic projections.
Other currency pairs such as AUDCAD and AUDNZD provide some clear divergence with the RBA holding higher rates and the BoC and RBNZ cutting with lower rates. Any clear pullbacks within these assets could provide opportunity to get long and hold through for a bigger move

NAS100 Pullback into Fibonacci Zone: Watching for Bullish Break📊 NASDAQ 100 (NAS100) Update 📊
The NAS100 is in a strong bullish trend 🟢📈, clearly visible on the 4H chart ⏰ with consistent higher highs and higher lows 🔼🔼.
Currently, price has pulled back 🔽 right into my optimal entry zone 🎯 based on the Fibonacci retracement 🔢. From here, I’ll be watching closely for a bullish break of structure (BOS) 🔓 on the 15M timeframe ⏰ — that would be my signal to look for a long entry 🚀.
⚠️ This breakdown is educational only and not financial advice. 📚

Volume YepA repeating pattern whereby the Swing occurs bearish this time, but instead of a single eye, e wait for either a retracement to the gap that will form after the current 4H candle and continue bearish, or we wait to see what happens on a great bullish candle that we have that led to our setup failing, because that is where in this case Volume is.

UntaggedWe were not tagged because the market did not draw to the zone, went just for the Gap, we move on!

Nas100 Trade Set Up Sep 15 2025www.tradingview.com
Price broke PDH and has made a ATH so i will wait for a pull back in to the zone before looking for a continuation higher

Direction bias on Nas100I'm bullish on nas100 and to continue the bullish run I'm expecting a pull back to sweet the inducement liquidity low then continue to the upside.


Buy Nas100Nas is bullish and will continue buying. There are two possible buy entries, being the demand zone, or the liquidity grab zone. Do not enter a trade on the demand zone unless there is another confirmation on lower time frames. Remember it is Friday tomorrow, and the market can be very manipulative on Friday. Do not force trades, there is nothing wrong with not having a trading day. Trade what you see, and not what you feel.

Nasdaq longLooking for longs again .
Asian lows have been swept.
Manipulation amd reversal to the upside.