NAS100 Technical Analysis 1 Hour Chart📉 NAS100 Technical Analysis (1H Chart)
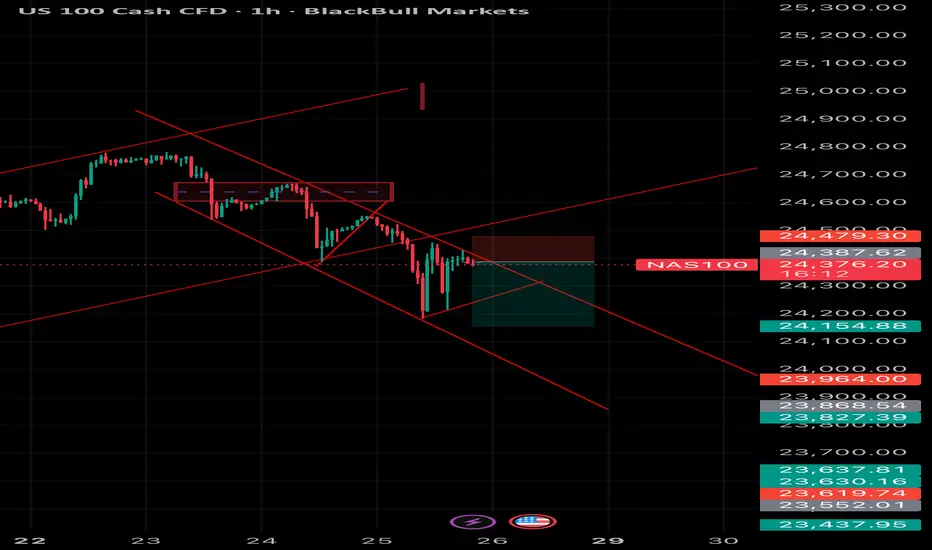
NAS100 is trading around 24,374 and continues to respect a strong descending channel, signaling bearish momentum.
• Trend: Price rejected the previous supply zone (24,470 – 24,500) and failed to break above resistance, confirming sellers are still in control.
• Entry Zone: The retest of broken support turned resistance around 24,387 – 24,479 shows bearish rejection with downside continuation likely.
• Target Levels:
• First target: 24,154 (mid-channel support)
• Next target zone: 23,960 – 23,827 (lower channel support)
• Invalidation: A clean 1H close above 24,500 would invalidate this bearish structure and could trigger a corrective move higher.
👉 Short-term bias remains bearish while under 24,500 with room for continuation toward 24,150 – 23,900.
NDQM trade ideas
Nasdaq records near critical resistance! More to go or crash?Strong economic data suggest the soft landing scenario remains intact. Manufacturing strength, combined with improving employment data, appears to provide support. The Fed's dovish pivot also offers liquidity tailwinds, while the Nvidia-Intel partnership signals continued investment in US stocks.
But is the market reading the signals?
Strong employment data could actually be bearish for equities since it reduces the urgency for the Fed to cut. The Fed's dot plot already shows fewer 2026 cuts (only one instead of three) with higher growth and (slightly higher) inflation projections. The Nvidia-Intel deal also excludes Intel's struggling foundry business, a core problem for the company.
Technicals are not too promising either. Multiple resistance factors converge just a tad higher if not at current levels:
Long-term trendline from November 2021
138% Fibonacci level
Triangle pattern measured move completion
100% Fibonacci expansion target
Indicators flash warnings too:
RSI second divergence since May (price up, momentum flat)
Volume oscillator 13% below zero - lack of institutional buying
Missing third-wave volume surge - typical bull pattern absent
Fifth-wave characteristics suggesting impulse completion
As we trade in the historically worst month for equities, where the NASDAQ typically underperforms the S&P 500 during September selloffs, a high-probability short setup could be underway:
Entry : 24,700-24,750 area (resistance test)
Stop : Above 25,000 (avoid false breakout)
Targets : 23,700 → 22,730 → 22,200
Risk-Reward : Approximately 2.6:1 to first major support
Prefer a 5-wave decline if bear case confirms, followed by a 3-wave up, then continuation lower.
Watch 24,500 as it appears to be a decision point where multiple technical and fundamental factors converge.
This content is not directed to residents of the EU or UK. Any opinions, news, research, analyses, prices or other information contained on this website is provided as general market commentary and does not constitute investment advice. ThinkMarkets will not accept liability for any loss or damage including, without limitation, to any loss of profit which may arise directly or indirectly from use of or reliance on such information.

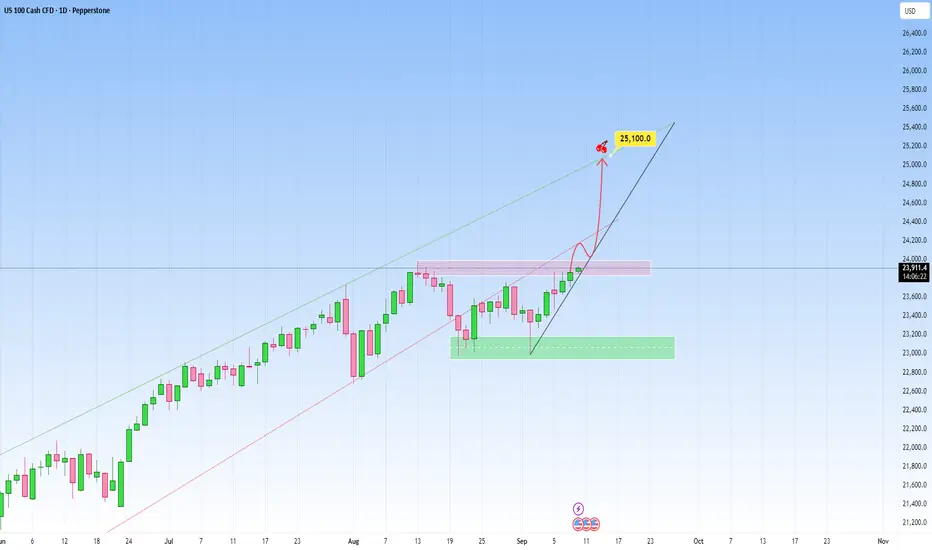
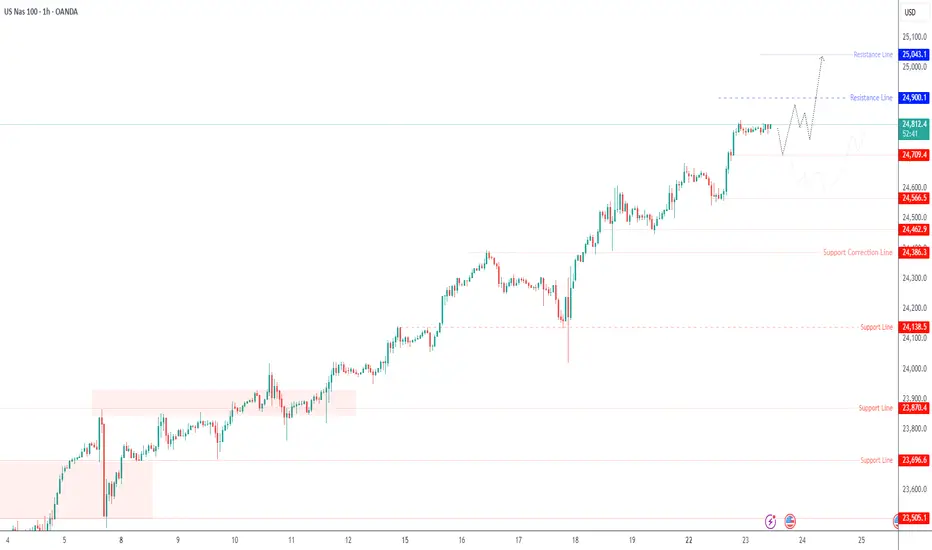
NAS100 Outlook: Recent rise has been steady!Market context on NAS100 remains bullish clearly. The most recent move saw a steady recovery, heading towards the upper boundary of the newly projected channel. And this right here is another great opportunity to get involved.
The market is likely in the early stages of a new impulsive leg to the upside right here.
We could also have short-term consolidation or pullback, then a continuation toward the upper boundary but I believe the latter is more plausible.
My target will be at 25,100.
NASDAQ US100 Long
Entry Zone: 24,542.
Stop-Loss: 24,360
Take-Profit: 24,717
Risk (Stop distance): ~182 points (24,542 – 24,360).
Reward (Target distance): ~175 points (24,717 – 24,542).
RSI Trend: Recently dipped sharply, showing selling pressure, but possible rebound if support holds. Price is respecting a long-term trendline.
USNAS100 – New All-Time High as Tech Headlines Fuel MomentumUSNAS100 – Overview
The Nasdaq 100 recorded a new all-time high (ATH) near 24,820, extending its bullish run as markets continue to digest upbeat tech headlines.
Investor sentiment remains supported by Nvidia’s plan to invest up to $100 billion in OpenAI, with the first data-center gear expected in 2026, and by anticipation of September flash PMIs, which will test U.S. economic resilience amid tariffs and ongoing Fed commentary.
Bullish Scenario
The index maintains strong bullish momentum while trading above the 24,780 – 24,710 pivot zone.
Targets: A sustained move above current highs could drive price toward 24,900 → 25,045.
An hourly close above 24,900 would reinforce upside momentum, potentially opening the way to fresh highs beyond 25,045 if tech sentiment strengthens.
Bearish Scenario
A confirmed 1H close below 24,710 would signal the start of a corrective move.
Targets: 24,570 → 24,460, with deeper losses possible if profit-taking accelerates after recent ATHs.
Key Levels
Pivot Zone: 24,780 – 24,710
Resistance: 24,900 – 25,045
Support: 24,570 – 24,470
Shall Nasdaq keep going with correction phase?US100 index being in correction phase, shall it continue? Share your idea trader!
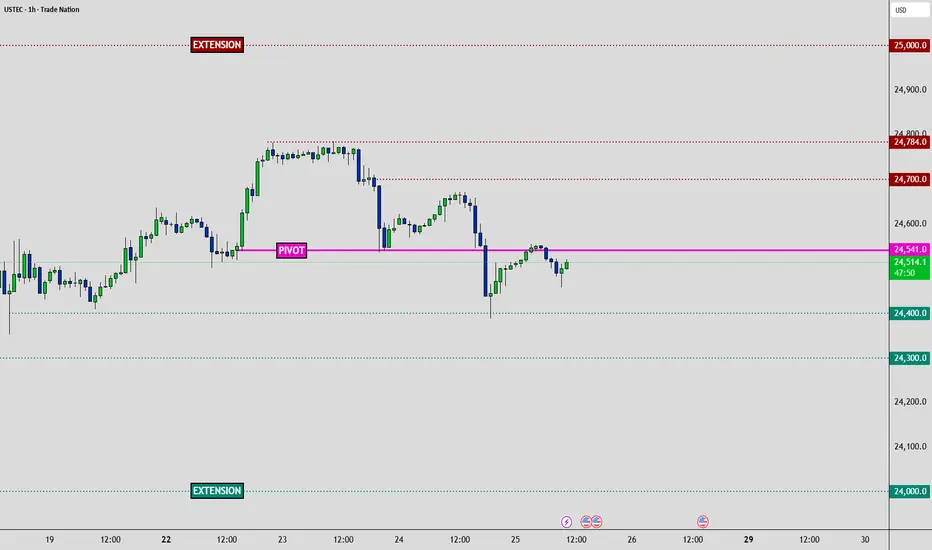
USTEC - 2 Day Traders Edge📈Technical:
MARKET BIAS: Neutral (consolidating at HVN pivot, high-rate sensitivity)
PIVOT ZONE: 24,541 (Exact HVN level)
🥇 Traders Edge - Actionable & Tactical
TRADE SETUPS:
🟧 Risk Warning: Core PCE surprise = 200+ point moves
🟧 Special Risk: High beta to rate moves via PCE
↕️ Bias Flip: Break below 24,400 (bearish) | above 24,700 (bullish)
🟢Long Setup:
• Entry above Pivot | Stop 24,450 | TP: 24,650 | 24,750 | 24,850 - Extended Breakout
🔴Short Setup:
• Entry below 24,400| Stop Above Pivot | TP: 24,300 | 24,000 - Extended Breakdown
🎯KEY LEVELS:
• Strong Resistance: 24,700 | 24,784
• Strong Support: 24,400 | 24,300 | 24,100 | 24,000
🎯PRICE TARGETS:
• Bullish Path: 24,700 → 24,784 → 25,000 (Extended breakout)
• Bearish Path: 24,400 → 24,300 → 24,000 (Extended breakdown)
🚨HIGH-IMPACT EVENTS (48H): (NY Time Zone)
• Sep 25 | 08:30 GDP Q2 Final: 3.3% vs -0.5% → Growth supports tech multiples
• Sep 26 | 08:30 Core PCE MoM: 0.2% vs 0.3% → TECH RATE SENSITIVITY
• Sep 26 | 08:30 Personal Spending: 0.5% vs 0.5% → Tech demand proxy
• Sep 26 | 10:00 Michigan Sentiment: 55.4 → Growth stock appetite
🛑 MASTER RISK EVENT
🟧Friday September 26 | 08:30 (NY Time Zone)
🟧 Core PCE Price Index (MoM) - Forecast: 0.2% vs Previous: 0.3%
🟧 Critical Impact: Fed's preferred inflation gauge determines rate path and USD strength
• Gold: Collapse risk if hot print
• Equities: Rate repricing volatility
• Sectors: Tech rotation sensitivity
⚠️ RISK MANAGEMENT PROTOCOL
• Reduce position sizes before Friday 08:30 EDT
• USD strength reversals impact Gold heavily
• Tech high beta to rate repricing
• Month-end flows amplify volatility
________________________________________
Analysis based on Session Volume POC clusters and HVN methodology
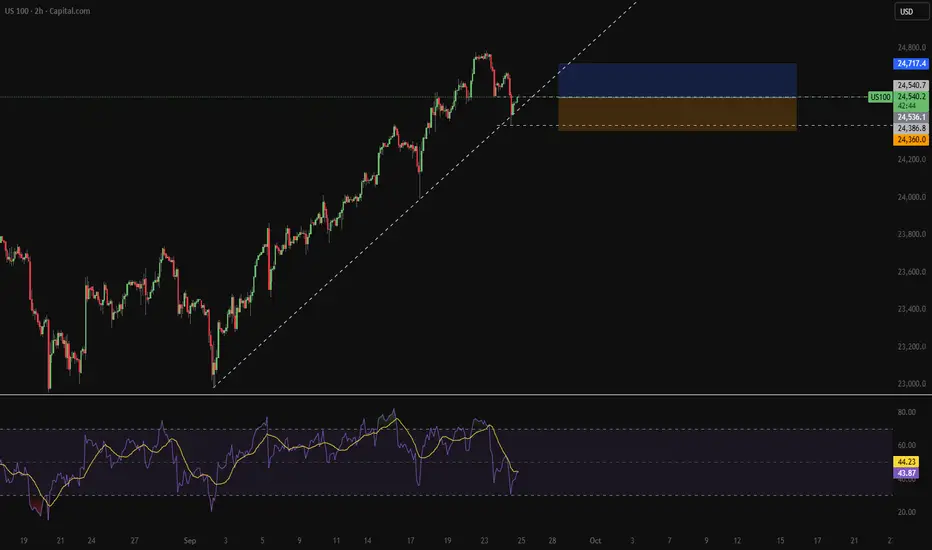
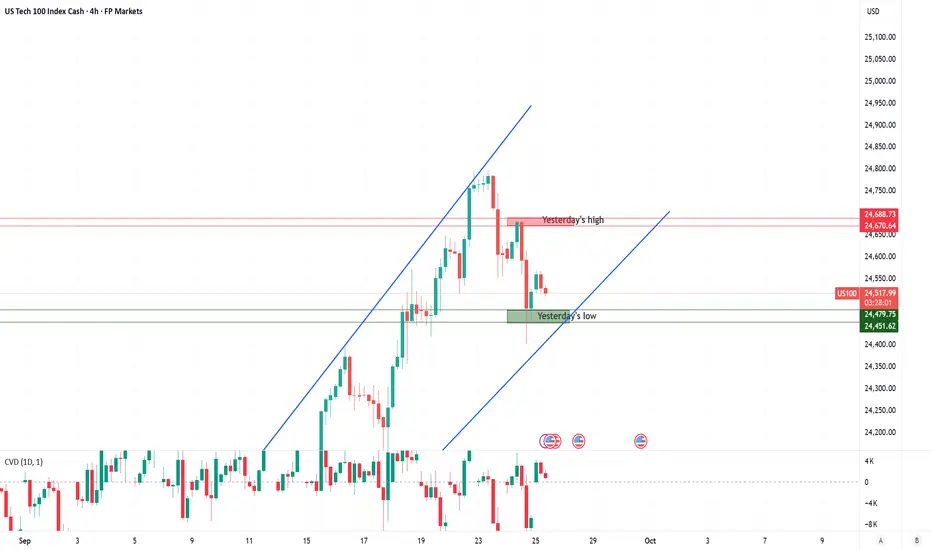
Nas100: Trading Levels in FocusKey Zones in Play
Zone 1 – Yesterday’s High:
Yesterday’s high represents the level where buyers lost momentum and sellers stepped in. If price revisits this zone, traders should expect potential supply pressure. A clean break and sustained hold above would signal renewed strength and could re-ignite bullish momentum.
Zone 2 – Yesterday’s Low:
This zone is the lower boundary of the previous session and now acts as short-term support. Buyers may defend this level to maintain structure, but its reliability is limited given the fresh all-time high environment and lack of historical confirmation. A decisive break below would weaken the bullish case and could invite deeper retracement.
Conclusion:
With US100 trading close to record highs, these zones provide useful guidelines, but they should not be treated as precise buy or sell triggers. In uncharted territory, reactions are often more volatile, making it essential to treat these levels as reference points rather than absolute decision zones.
Morning Sentiment Brief
Market sentiment remains cautiously optimistic. The recent Fed rate cut and ongoing enthusiasm around AI investments continue to underpin a bullish narrative, keeping the US100 near record highs. However, Powell’s cautious tone this week, stressing data-dependence and warning about stretched equity valuations, has cooled some of the initial euphoria.
Traders are now balancing optimism with prudence. Tech momentum is intact, but profit-taking and sector rotation show that conviction is more selective. Political and regulatory headlines add another layer of uncertainty, leaving the market more sensitive to incoming catalysts. Overall, the bias stays positive, but participants are trading with more caution as the index moves in uncharted territory.
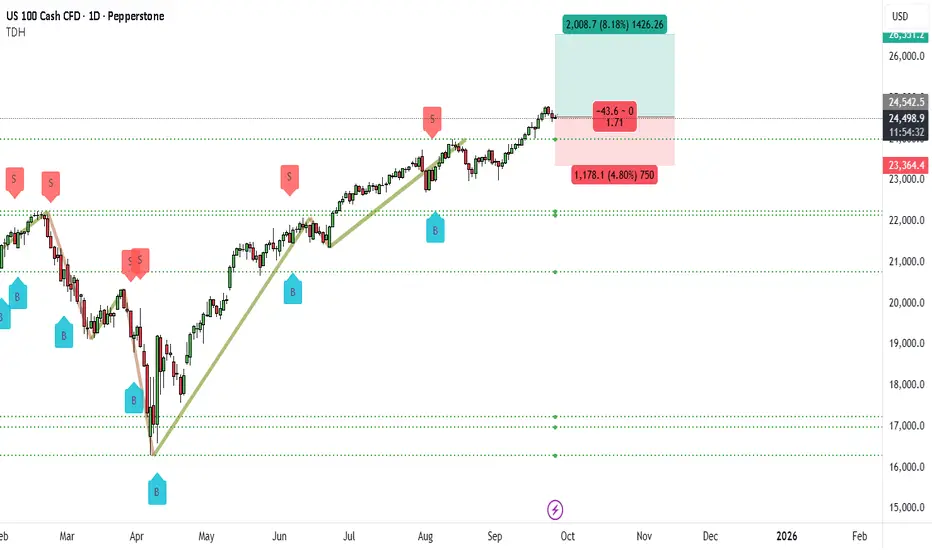
NAS100 Bullish Scenario, Will The Trend Be Followed?The US100 (NASDAQ) daily chart shows a very strong bullish structure. Since April, the index has been in a steady uptrend, creating higher highs and higher lows. Recently, price broke through the important 24,000 zone and is now consolidating just under 24,542. This consolidation at the highs is a healthy sign of strength, suggesting buyers are preparing for the next leg up.
The zone between 24,000 and 24,200 is now a major support base. As long as the market holds above this region, the bullish outlook remains intact. The next major target sits near 26,551, which lines up with an 8% projected upside move. Momentum remains with the bulls, and dips toward support are likely to be bought up quickly.
📌 Trade Setup (Bullish)
• Entry: 24,500 (current market or on breakout above 24,542)
• Stop-Loss: 23,364
• Take-Profit: 26,551
• Risk/Reward: ~1:1.7
short nas2 news today, if news hasn't come out, i think this is worth a short for 1 order. there's volume in entry area. can increase the sl abig higher for lower risk and lower RR.

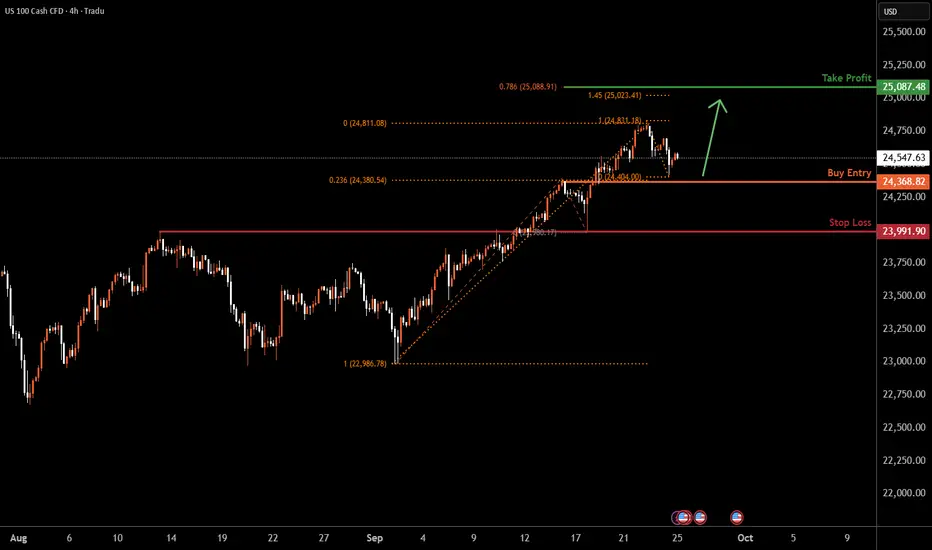
NAS100 H4 | Bullish momentum to extend?NAS100 is falling towards the buy entry at 24,368.82, which is a pullback support that aligns with the 23.6% Fibonacci retracement and could bounce from this level to the upside.
Stop loss is at 23,991.90, which is an overlap support.
Take profit is at 24,087.48, which aligns with the 78.6% Fibonacci projection and the 161.8% Fibonacci extension.
High Risk Investment Warning
Trading Forex/CFDs on margin carries a high level of risk and may not be suitable for all investors. Leverage can work against you.
Stratos Markets Limited (tradu.com ):
CFDs are complex instruments and come with a high risk of losing money rapidly due to leverage. 65% of retail investor accounts lose money when trading CFDs with this provider. You should consider whether you understand how CFDs work and whether you can afford to take the high risk of losing your money.
Stratos Europe Ltd (tradu.com ):
CFDs are complex instruments and come with a high risk of losing money rapidly due to leverage. 66% of retail investor accounts lose money when trading CFDs with this provider. You should consider whether you understand how CFDs work and whether you can afford to take the high risk of losing your money.
Stratos Global LLC (tradu.com ):
Losses can exceed deposits.
Please be advised that the information presented on TradingView is provided to Tradu (‘Company’, ‘we’) by a third-party provider (‘TFA Global Pte Ltd’). Please be reminded that you are solely responsible for the trading decisions on your account. There is a very high degree of risk involved in trading. Any information and/or content is intended entirely for research, educational and informational purposes only and does not constitute investment or consultation advice or investment strategy. The information is not tailored to the investment needs of any specific person and therefore does not involve a consideration of any of the investment objectives, financial situation or needs of any viewer that may receive it. Kindly also note that past performance is not a reliable indicator of future results. Actual results may differ materially from those anticipated in forward-looking or past performance statements. We assume no liability as to the accuracy or completeness of any of the information and/or content provided herein and the Company cannot be held responsible for any omission, mistake nor for any loss or damage including without limitation to any loss of profit which may arise from reliance on any information supplied by TFA Global Pte Ltd.
The speaker(s) is neither an employee, agent nor representative of Tradu and is therefore acting independently. The opinions given are their own, constitute general market commentary, and do not constitute the opinion or advice of Tradu or any form of personal or investment advice. Tradu neither endorses nor guarantees offerings of third-party speakers, nor is Tradu responsible for the content, veracity or opinions of third-party speakers, presenters or participants.
same stratlooking for first 1m resistance in this order block.
short it back to thsi main support zone
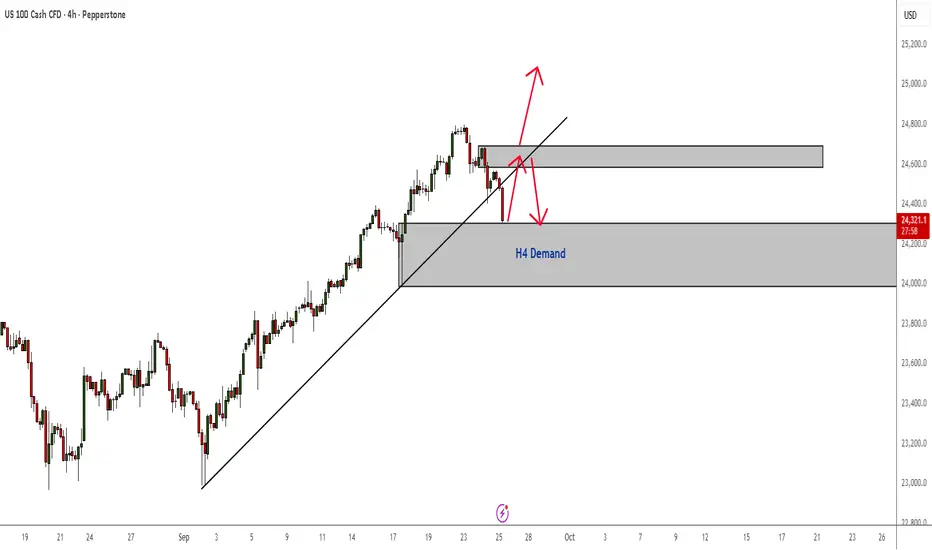
NAS100 Price has dipped into an H4 Demand Zone Price has now retested a demand zone. Look for long confirmations from here. If it reaches supply or retests that broken trendline and gives sell confirmations, then we will short it. However, if momentum to the upside continues, then we long to new ATHs.

NAS100 ShortElite Analysis
Price accumulation
Asian liquidity was taken out
Price action in lower time frames read as bearish
Targeting lower liquidity pools

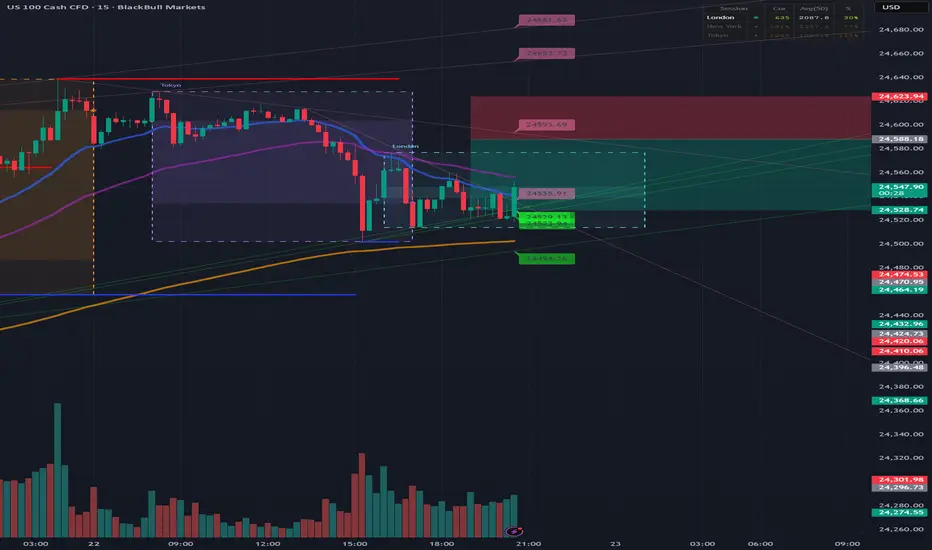
US NAS100Preferably suitable for scalping and accurate as long as you watch carefully the price action with the drawn areas.
With your likes and comments, you give me enough energy to provide the best analysis on an ongoing basis.
And if you needed any analysis that was not on the page, you can ask me with a comment or a personal message.
Enjoy Trading ;)

NAS100 Pullback and Liquidity Sweep in H4 Demand. Time to LongNQ has given a nice deep pullback into H4 demand. Time to pull the trigger.
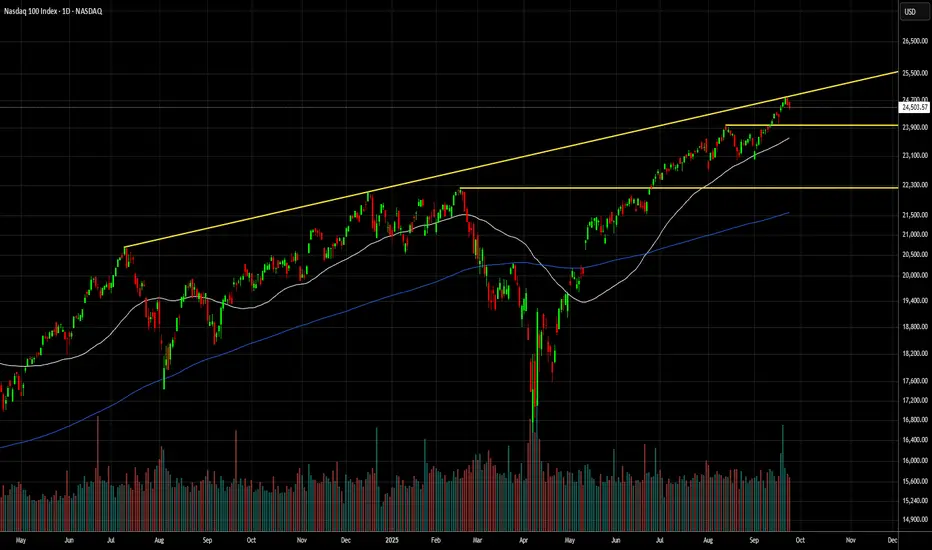
NASDAQ index- Correction alertThe price has reached the yellow trendline, and in the previous two instances this led to significant short-term corrections:
📉 July 2024: -15.6%
📉 December 2024: -7.1%
Currently: optimistic correction target at 23,970 (-3.2%), and if that doesn’t hold – strong support at 22,223 (-10.2%).
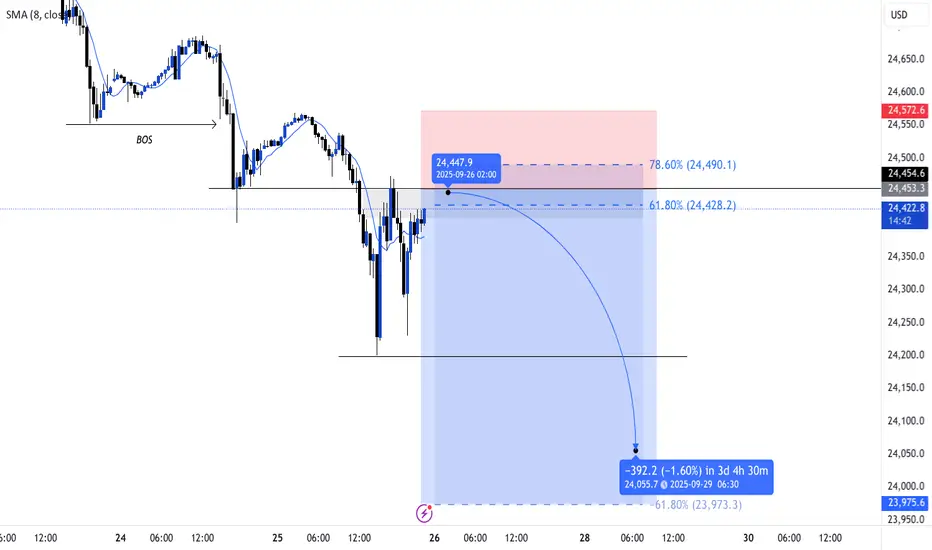
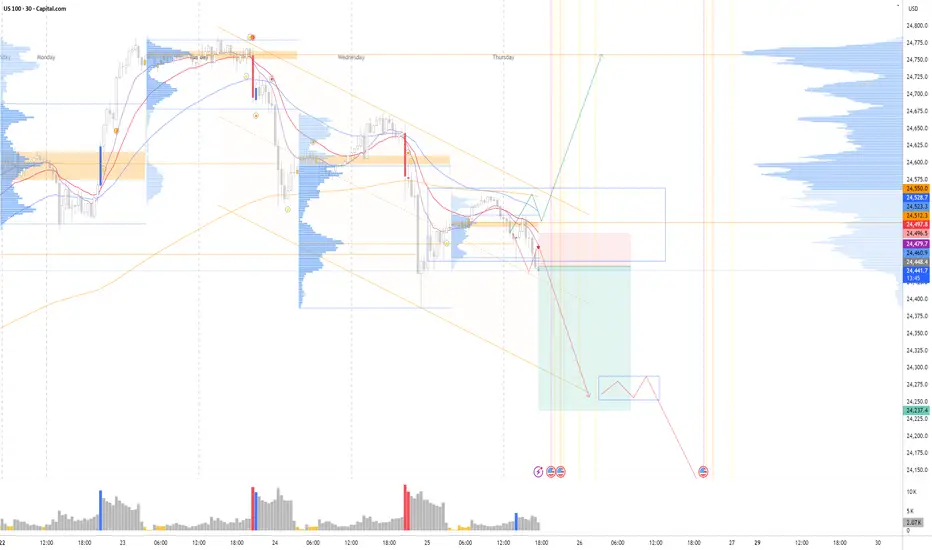
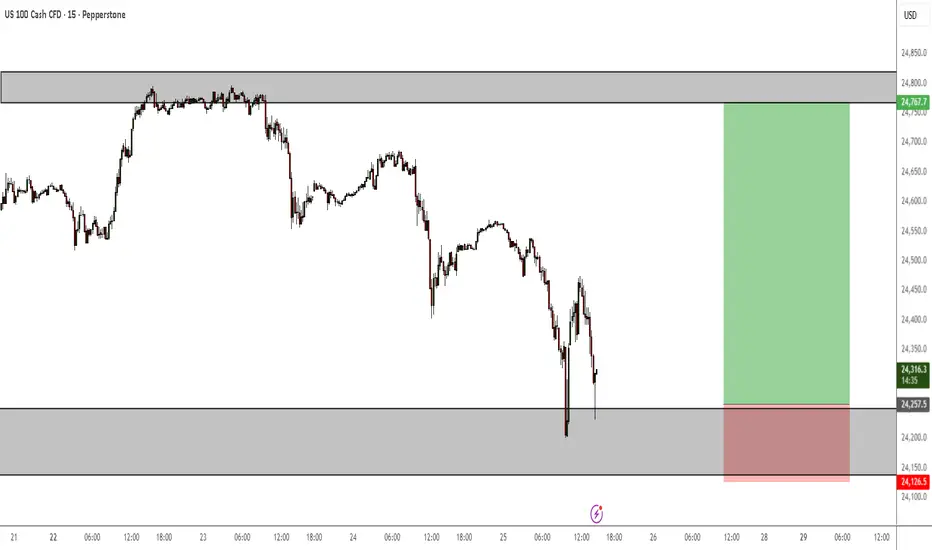
NasdaqNasdaq breaking 24500 pulled back to the 2-day average and returned below this level, we can see a sharper drop to the support region 24100 and 24200

Nasdaq ready for 200 points rally from Daily Trend line supportNasdaq ready for 200 points rally from Daily Trend line support, it was a good confirmation as trend support did wickout and holded, lets goo do you agree?

NASDAQ Bearish Flag SetupPrice is currently in a supply zone. An estimated measured move target will take price to a demand zone.
Always wait for a break out and retest as confirmation before entering.

NAS100 ShortElite Strategy
Waiting price to come tap OB twice to confirm OB to TOB
Execute in smaller time frame
Targeting lower liquidity pools
Main target Structural liquidity
