NASDAQ MARKET STRUCTURE , WHERE NAS GO ? Selling Nasdaq Now Price 2400
Reason Double Top
Takedown The Buy Side Liquidity
Target Sell Side Liquidity
Buying Nasdaq Pending
Buy Nasdaq Cisd ( 23,330)
Buy Nasdaq OB ( 23,10 )
NDQM trade ideas

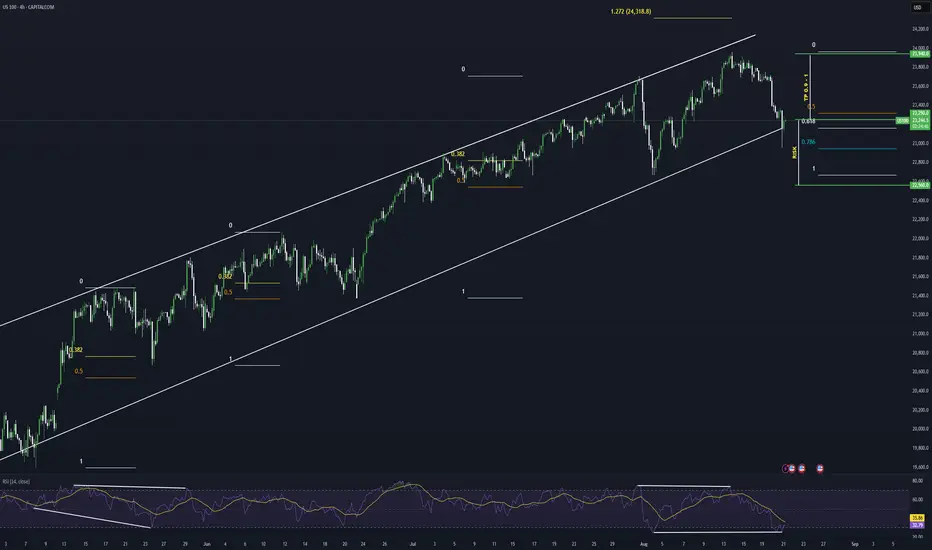
USD100 BULLISH CONTINUATION IDEA 📈 Bullish Continuation Idea
🔹 Technical Analysis
Trend Bias: All higher timeframes confirm a bullish continuation trend.
Key Structure: On the H4 timeframe, price formed a higher low (HL) at the 38.2% Fibonacci retracement, supporting the bullish bias.
Profit Target: First TP at the -27% Fibonacci extension (24,000 – 24,070 zone).
Liquidity Targets: Markets typically hunt liquidity (daily highs/lows, swing points, equal highs/lows). The prior swing high on the daily provides additional confluence for this target.
Lower Timeframe Structure: H1 shows bullish HH/HL structure. Price fully mitigated the recent H1 Fair Value Gap (FVG) and swept the recent data low, possibly offering a strong entry zone for continuation upwards.
🔹 Fundamental Analysis
While N100 often moves independently of news, key events can act as catalysts:
Wednesday 09/10/2025 – Core PPI (Low-Moderate Impact):
If PPI prints lower as expected, this should fuel bullish momentum.
No major rallies or crashes expected, but could provide continuation fuel.
Thursday 09/11/2025 – CPI Y/Y (High-Moderate Impact):
Historically, N100 reacts inversely to bullish CPI prints.
Based on past CPI releases (08/12/25, 07/15/25, 06/11/25, 02/12/24), expect a possible short-term dip before resuming the trend.
Best opportunities may come after NY open liquidity grabs.
⚠️ Risk Disclaimer
This is not financial advice – just my personal analysis. If we all knew exactly where the market was going, we’d all be millionaires. Trade cautiously and always prioritize risk management.
Happy Trading ❤️


Nasdaq 100 Eyes New ATH if CPI Undershoots ExpectationsUSNAS100 – Overview
The Nasdaq will trade under CPI pressure today, with volatility expected around the release.
📉 Bearish scenario: While below 23,870, momentum favors a move toward 23,695, with further downside risk to 23,510 → 23,280.
📈 Bullish scenario: A reversal and stabilization above 23,870–23,940 would open the path toward 24,090 and a new ATH near 24,240.
⚠️ CPI impact:
Below 2.9% → supports bullish continuation for indices.
Above 2.9% → likely triggers bearish momentum.
Key Levels
Pivot: 23,870
Resistance: 24,090 – 24,240
Support: 23,695 – 23,510 – 23,280

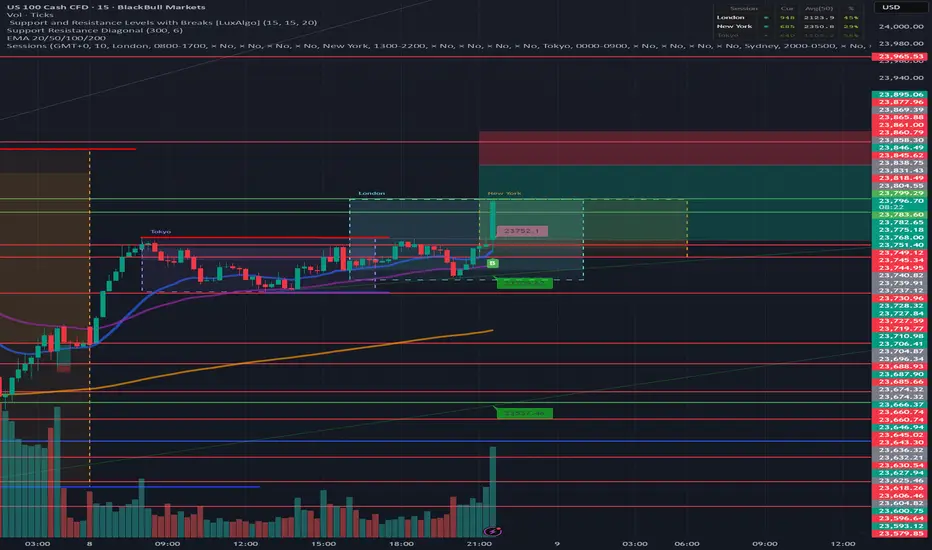
Beyond the Chart – NAS100 Through Technicals & Fundamentals⚖️ CAPITALCOM:US100 Fundamental Impact today
• The core driver is the US CPI (inflation) + Unemployment Claims at 3:30 pm.
• Expect increased volatility on NAS100 around that time:
• ✅ Lower CPI + weaker jobs → Bullish NAS100 (rate cut hopes).
• ❌ Higher CPI + strong jobs → Bearish NAS100 (higher for longer Fed).
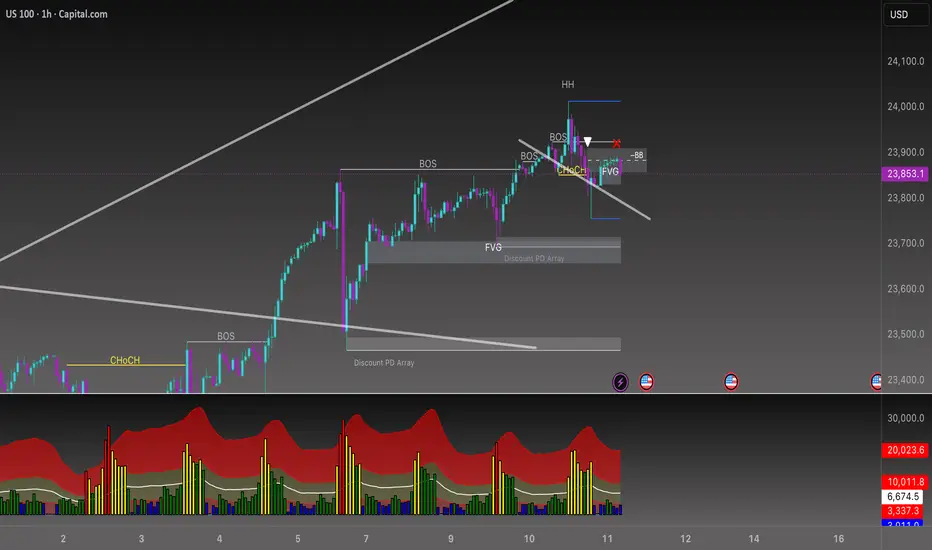
1. Bearish Continuation (Main Scenario)
• Rejection from the bearish FVG + BB zone → downside continuation.
• Targeting:
• 23,750 short-term liquidity sweep.
• Then 23,700–23,650 (discount FVG).
• Extended target: 23,540 (major discount PD array).
2. Deeper Retracement / Liquidity Sweep (Alternative Scenario)
• Price might push slightly above the bearish FVG / BB zone (~23,900–23,930) to sweep late shorts.
• Then reversal down, same targets as scenario 1.
3. Bullish Recovery (Less Likely for Now)
• If price reclaims above 23,950–24,000, structure shifts bullish again.
• Potential revisit of 24,100+ liquidity above the HH.
⸻
⚖️ Bias
• For now, bias is bearish unless 23,950–24,000 is broken with strength.
• Volume histogram also shows selling momentum increasing after the rejection.
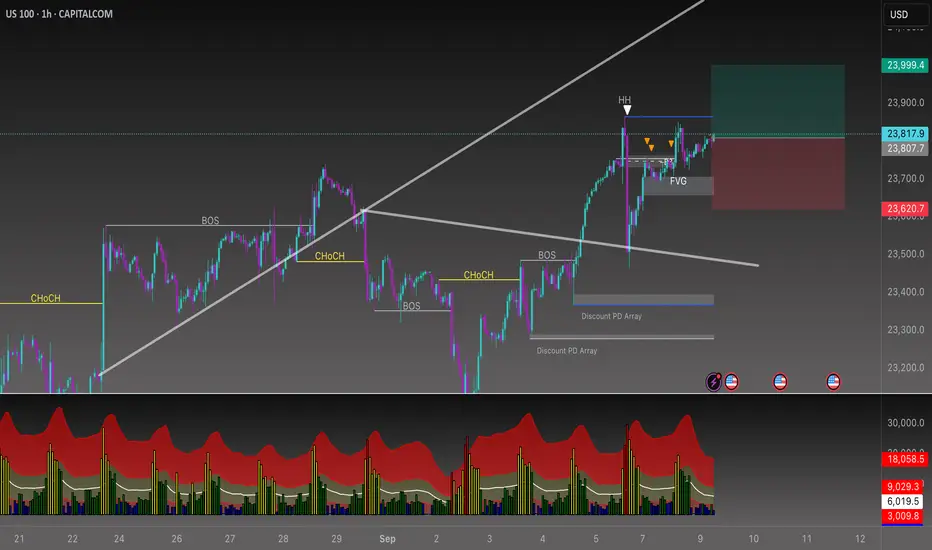
Beyond the Chart – NAS100 Through Technicals & Fundamentals📈 CAPITALCOM:US100 1H
• Strong bullish structure with HH in play.
• Liquidity grab above highs, now consolidating.
• Key support: 23,700 FVG – holds = next leg to 24K+.
• Failure = pullback into discount zones (23,400–23,200)
NSDQ100 Bullish breakout support at 23500Key Developments
US labor market revisions: BLS cut payrolls by -911k through March 2025, implying weaker labor conditions than thought. Markets took it in stride, with rate cut pricing steady at ~27bps for next week (-1.5bps on day).
Fed outlook: Treasury Secretary Bessent urged recalibration of policy, echoing Trump’s criticism of “choking off growth.” Governor Lisa Cook remains in her role after a court blocked Trump’s attempt to remove her, ensuring full FOMC participation next week.
Geopolitics:
Middle East: Israel’s strike on Hamas leaders in Qatar drew criticism from Trump, seen as not aiding conflict resolution.
Europe: Poland shot down drones from a Russian strike on Ukraine, escalating tensions with Moscow.
Market Takeaways
Payroll downgrades confirm a weaker labor backdrop but don’t materially change Fed cut expectations for September.
Political noise around the Fed could fuel uncertainty, but markets are treating it as background risk.
Geopolitical tensions remain elevated but had limited immediate market impact.
Conclusion for Nasdaq 100
The Nasdaq 100 is likely to remain steady to slightly supported:
Weaker labor revisions reduce concerns about overheating, reinforcing the Fed cut narrative.
Limited geopolitical spillover into tech equities so far.
Bond yields and Fed pricing, not payroll revisions, remain the key driver.
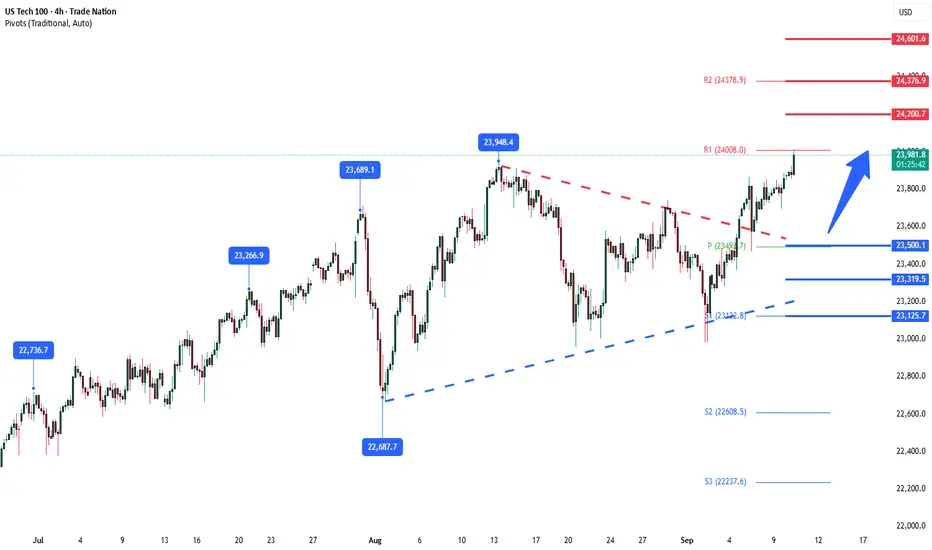
Key Support and Resistance Levels
Resistance Level 1: 24200
Resistance Level 2: 24380
Resistance Level 3: 24600
Support Level 1: 23500
Support Level 2: 23320
Support Level 3: 23125
This communication is for informational purposes only and should not be viewed as any form of recommendation as to a particular course of action or as investment advice. It is not intended as an offer or solicitation for the purchase or sale of any financial instrument or as an official confirmation of any transaction. Opinions, estimates and assumptions expressed herein are made as of the date of this communication and are subject to change without notice. This communication has been prepared based upon information, including market prices, data and other information, believed to be reliable; however, Trade Nation does not warrant its completeness or accuracy. All market prices and market data contained in or attached to this communication are indicative and subject to change without notice.
NAS100 | Bearish DivergenceNAS100 has formed bearish divergence on 1hr TF as well as on 4 hr TF which is quite a strong signal that the due correction is around.


NAS100 | 9sept SHORT SENTIMENTLokking for NAS1000 to sustain below the Pattern with our next target on the TREND SUPPORT DOWN BELOW
SIMPLE PLAYBOOK TRADE WITH A 1:4 RR

NASDAQ Index Analysis (US100 / NASDAQ):The NASDAQ index is moving in an uptrend and is currently testing the 23,800 resistance level.
🔻 Bearish Scenario:
If the price manages to break below 23,750 and hold, it is likely to head towards the lower support level at 23,500.
🔺 Bullish Scenario:
If the price breaks above 23,850 and holds, this could support a continuation of the bullish move toward 24,000.
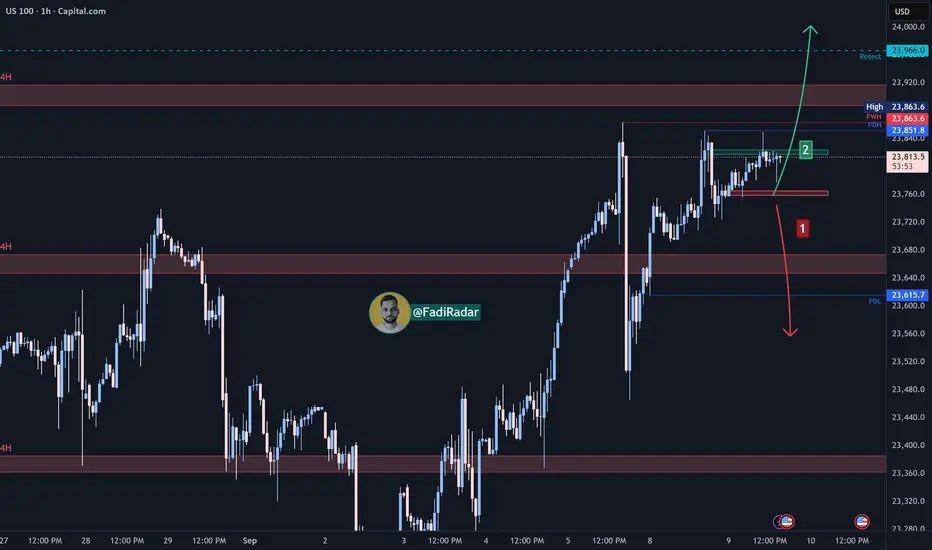
USNAS100 Holds Above 23,690 – Bulls Eye 23,870 ATHUSNAS100 – Overview
The Nasdaq 100 remains in bullish momentum while trading above the pivot at 23,690, with the next target near the ATH at 23,870.
Technical Outlook:
📈 As long as price holds above 23,690, bullish momentum is expected toward 23,860 → 23,940 → 24,090.
📉 A confirmed 1H close below 23,690 would shift bias bearish, opening the way to 23,600 → 23,500 → 23,280.
Key Levels:
Pivot: 23,690
Resistance: 23,860 – 23,940 – 24,090
Support: 23,600 – 23,500 – 23,280

US100 05.09.2025~+ Fed's dovishness + independence concerns
+ NFP Big Miss (22K) -> confirming dovish expectations
- NFP Big Miss (22K) -> growth concerns
NASDAQ NAS100 at a Crossroads: Riding Nvidias Surge with CautionThe immediate reaction to Nvidia's stellar earnings has been decidedly bullish, propelling the NASDAQ higher. We saw a classic "buy the rumor, sell the news" event where the "news" was so powerful it triggered a "fear of missing out" (FOMO) rally with a healthy correction on Friday.
In the next one to two weeks, the near-term bias is bullish, but with extreme caution. The market has received the fundamental "all-clear" it was waiting for from its most important company. However, the index is now technically overextended and sentiment is euphoric, making it vulnerable to a short-term pullback or consolidation. The primary trend, however, remains bullish IMO.
1. The Catalyst: Nvidia Earnings
Nvidia didn't just beat expectations; it shattered them and raised future guidance, validating the entire AI investment thesis.
Revenue & EPS: Significant beats on both the top and bottom lines.
Guidance: Q2 revenue guidance of ~$28B was vastly higher than analyst estimates of ~$26.6B, demonstrating unprecedented demand for its Blackwell and Hopper architecture chips.
Data Center: Revenue of $22.6B, up 427% year-over-year, is the core of the story. This shows that AI infrastructure spending is not slowing; it's accelerating.
Stock Split: The announcement of a 10-for-1 stock split adds a psychological boost for retail investors, improving accessibility and reinforcing bullish sentiment.
Analyst Interpretation: This wasn't just a quarterly report; it was a fundamental confirmation that the AI revolution has tangible, massive earnings power. It alleviated fears that the AI trade was a bubble. For the NASDAQ, which is market-cap weighted and heavily influenced by NVDA, this was rocket fuel.
2. Technical Analysis (One-Day Timeframe Post-Earnings)
Price Action: The NASDAQ gapped up powerfully at the open, breaking cleanly above its previous consolidation range. This was a strong bullish signal.
Volume: The rally was accompanied by massive volume, confirming broad institutional participation. This wasn't a low-volume grind; it was a conviction move.
3. Macro & Fundamental Backdrop
Interest Rates: The market is currently pricing in a higher-for-longer stance from the Fed. However, recent economic data (PMIs, jobless claims) has shown slight signs of softening, which keeps hopes alive for a potential rate cut later in the year. A stable, non-accelerating rate environment is acceptable for tech stocks, especially those like Nvidia with explosive earnings growth that outweighs rate concerns.
Geopolitics: While always a risk (U.S.-China tensions, elections), the market has largely shrugged off these concerns for now, choosing to focus on the stellar corporate fundamentals.
Market Breadth: A key watch-out. The rally has been narrow, led primarily by the "Magnificent 7" (now perhaps the "Fab 1" - Nvidia). For the rally to be sustainable, we need to see broader participation from other sectors and smaller-cap stocks within the NASDAQ.
4. Likely Outcome for the Next 1-2 Weeks: Bullish with a Caveat
Bullish Scenario (60% Probability):
The momentum from Nvidia is likely to carry the NASDAQ higher in the very near term. We could see a continued "melt-up" towards 17,400-17,500 as underinvested funds are forced to chase performance and add equity exposure. Any dip will likely be shallow and bought aggressively, with the 17,000 level holding firm.
Consolidation/Pullback Scenario (35% Probability):
This is the most likely healthy outcome. After such a massive, emotion-driven surge, the market is likely to need a period of digestion. We could see the NASDAQ chop sideways for a week or two to work off the overbought conditions. This would reset the momentum indicators and allow the market to build a new base for the next leg higher. This is not a bearish signal; it is a strengthening signal.
Bearish Reversal Scenario (5% Probability):
A sharp reversal below the 17,000 support level and a fill of the earnings gap (~16,900) would be a significant warning. This would likely require a new, negative macro catalyst (e.g., unexpectedly hot inflation data, a major geopolitical escalation) that forcefully changes the interest rate narrative.
Trading & Investment Implication
For Bulls / Existing Longs: Hold positions. Consider taking partial profits on extreme strength, but avoid selling your entire position. The trend is your friend. Use any pullback to the 17,000 support as a potential buying opportunity.
For New Entrants: Chasing the green spike is high-risk. Be patient. Wait for the inevitable pullback or period of consolidation to establish a position. The risk/reward is poor on the day after a massive gap up.
For Bears: Fighting this tape is exceptionally dangerous. The fundamental news from NVDA is a game-changer for the index. Shorting based solely on overbought conditions is a quick path to losses.
Final Analyst Call: The next week is likely bullish with high volatility, potentially extending gains. However, the following week is highly susceptible to a consolidation or pullback as the initial euphoria settles. The overall trajectory for the next two weeks is cautiously bullish, with the understanding that a 2-4% pullback is a normal and healthy part of a strong uptrend.
The burden of proof is now on the bears to prove they can wrestle control back from a market that just received the best possible news from its most important constituent.
Not financial advice, this is just my opinion.

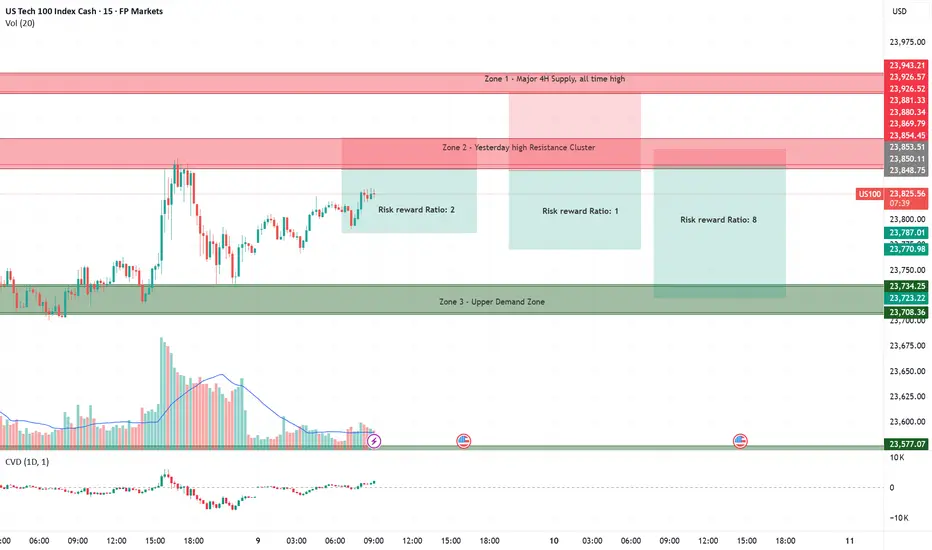
The #1 Trading Skill: Controlling Your RiskThe secret to trading isn’t winning every trade - it’s about managing risk.
Risk management and trading. This is one of the most important topics if you’re
serious about becoming a profitable trader. Risk management is the foundation of trading. If
you don’t manage your risk you won’t make it. Simple as that.
No one can predict whether the market will go up or down with 100%
certainty. That’s why as traders we can never fully control how much profit we make. But we
can control one thing. How much we lose. And that brings us to the first step in risk
management. Understanding the power of the risk-reward ratio.
When choosing a trading strategy that suits you one of the factors to consider is its risk-reward
ratio. Every strategy has its own balance between risk and potential reward and understanding
this is key. This is where we need to put our math brains to work.
What is the risk-reward ratio? Simply put it tells us how much we stand to gain for every unit
of risk we take. It’s a straightforward but powerful metric that helps determine whether a
strategy can be profitable over time.
Let’s break it down with a simple example:
• If your strategy has a 1:1 risk-reward ratio it means that for every $100 you risk you
aim to make $100 in profit. Win or lose the potential gain and loss are the same.
• If your strategy has a 1:2 risk-reward ratio you risk losing $100, but if the trade goes
your way you make $200. This means your potential reward is twice as big as your risk.
• If your strategy has a 1:5 risk-reward ratio for every $100 you risk you have the
chance to make $500. Here the possible reward is much greater than the risk you take.
Your risk-reward ratio has a big impact on your overall profitability. But the risk-reward ratio
alone doesn’t tell the full story. To know if a strategy is truly profitable you also need to
consider another key factor: Win rate.
Your win rate is the percentage of trades that end in profit. This is where math and probabilities come into play.
• If your strategy has a 50% win rate it means that out of 10 trades 5 are winners and 5
are losers.
• If your win rate is 40% 4 out of 10 trades will be profitable.
The key to long-term success is finding the right balance between risk-reward and win rate.
• If you have a 1:1 risk-reward ratio and a 40% win rate your strategy won’t be
profitable. Over 10 trades you win 4 times and lose 6 times. Since you win and lose the
same amount per trade your losses will be bigger than your gains in the long run.
• But with a 1:5 risk-reward ratio and the same 40% win rate your strategy becomes
profitable. That’s because your winning trades make far more than you lose on your
losing trades.
The takeaway? There’s no such thing as a right or wrong strategy only ones that are profitable
or unprofitable. The key is to find a strategy that gives you a mathematical edge over time.
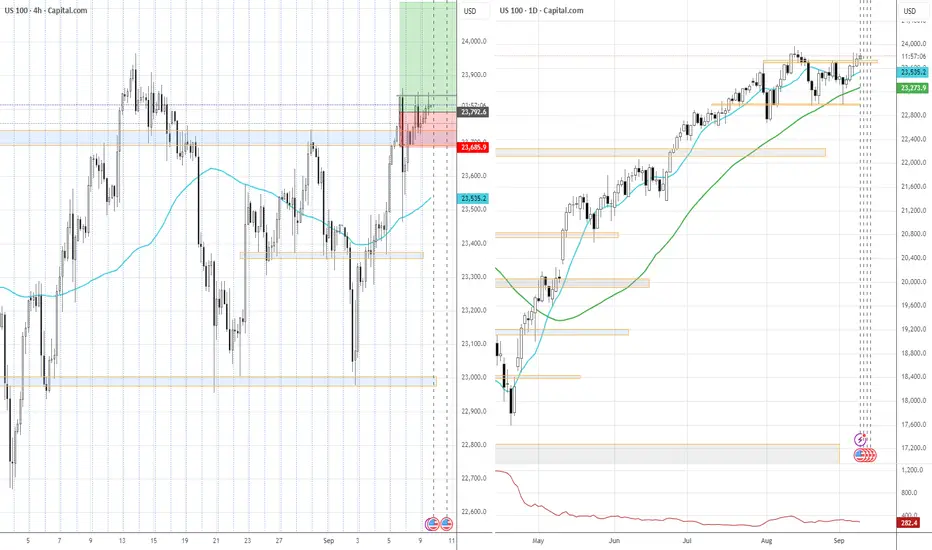
NAS100 H4 | bullish momentum to extendNAS100 has reacted off the buy entry at 23,720.82, which is a pullback support and could bounce from this level to the take profit.
Stop loss is at 23,572.15, which is a pullback support.
Take profit is at 24,065.29, which lines up with the 61.8% Fibonacci projection and the 138.2% Fibonacci extension.
High Risk Investment Warning
Trading Forex/CFDs on margin carries a high level of risk and may not be suitable for all investors. Leverage can work against you.
Stratos Markets Limited (tradu.com ):
CFDs are complex instruments and come with a high risk of losing money rapidly due to leverage. 65% of retail investor accounts lose money when trading CFDs with this provider. You should consider whether you understand how CFDs work and whether you can afford to take the high risk of losing your money.
Stratos Europe Ltd (tradu.com ):
CFDs are complex instruments and come with a high risk of losing money rapidly due to leverage. 66% of retail investor accounts lose money when trading CFDs with this provider. You should consider whether you understand how CFDs work and whether you can afford to take the high risk of losing your money.
Stratos Global LLC (tradu.com ):
Losses can exceed deposits.
Please be advised that the information presented on TradingView is provided to Tradu (‘Company’, ‘we’) by a third-party provider (‘TFA Global Pte Ltd’). Please be reminded that you are solely responsible for the trading decisions on your account. There is a very high degree of risk involved in trading. Any information and/or content is intended entirely for research, educational and informational purposes only and does not constitute investment or consultation advice or investment strategy. The information is not tailored to the investment needs of any specific person and therefore does not involve a consideration of any of the investment objectives, financial situation or needs of any viewer that may receive it. Kindly also note that past performance is not a reliable indicator of future results. Actual results may differ materially from those anticipated in forward-looking or past performance statements. We assume no liability as to the accuracy or completeness of any of the information and/or content provided herein and the Company cannot be held responsible for any omission, mistake nor for any loss or damage including without limitation to any loss of profit which may arise from reliance on any information supplied by TFA Global Pte Ltd.
The speaker(s) is neither an employee, agent nor representative of Tradu and is therefore acting independently. The opinions given are their own, constitute general market commentary, and do not constitute the opinion or advice of Tradu or any form of personal or investment advice. Tradu neither endorses nor guarantees offerings of third-party speakers, nor is Tradu responsible for the content, veracity or opinions of third-party speakers, presenters or participants.

NAS100 - Potential outcome this week.Dear Friends in Trading,
“I share only my perspective. In this industry, learning never ends, but progress comes when we learn from mistakes without repeating them.” - ANROC
1) Can trend hold?
2) I believe risk appetite is diminished due to unstable geopolitical tensions.
Keynote:
The potential for an IR cut this month is good - Is this good or bad for shares in Equities?
📈 Why a rate cut can be good for stocks:
Cheaper borrowing → Companies can finance expansion, buybacks, or refinance debt at lower costs, boosting profitability.
Encourages spending → Consumers borrow more cheaply (credit cards, mortgages, auto loans), which can lift company revenues.
Asset reallocation → Lower yields on bonds make stocks look more attractive, so investors may shift capital into equities.
Weaker dollar → Helps U.S. exporters because their goods become more competitive abroad.
📉 Why a rate cut can be bad for stocks:
Signal of economic weakness → Often, the Fed cuts rates when growth is slowing or risks are rising (recession fears, financial stress). Stocks may fall if investors focus on the reason for the cut.
Diminished confidence → If markets think the Fed is “behind the curve,” sentiment can worsen.
Sector differences → Financial stocks (banks, insurers) may get hurt because their net interest margins shrink.
I sincerely hope my point of view offers a valued insight.
Thank you for taking the time study my analysis.

NASDAQ Potential Bullish ContinuationNASDAQ price action seems to exhibit signs of potential Bullish momentum as the price action may form a credible Higher Low with multiple confluences through key Fibonacci and Support levels which presents us with a potential long opportunity.
Trade Plan:
Entry : 23250
Stop Loss : 22560
TP 0.9 - 1: 23870 - 23940
short nassame strat, if price goes that order block, bullish small green candle or some red candle, looking to short this.
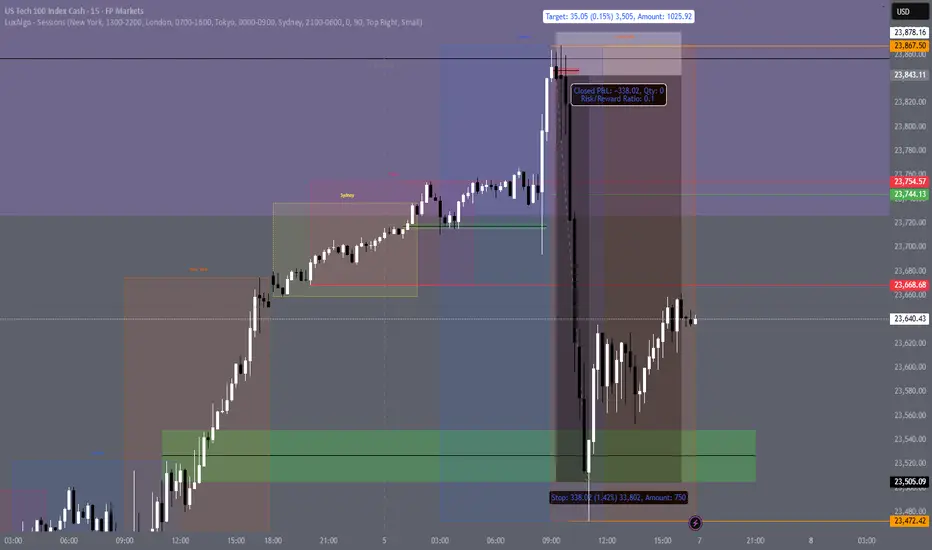
killzone ideal setup to takeSTEP 1: Spot session HH/LL (prefered asia session)
STEP 2: Wait for next session to sweep HH/LL of previous session
STEP 3: Spot FVG,OB or wtv that confirm reversal/continuation
STEP 4: Enter position after confirmation of market reaction
Nasdaq-100 (NDX) Weekly Chart 2025 Chart Context
This weekly timeframe analysis of the Nasdaq-100 Index (NDX) forms a key pillar in our 2025 macro analysis series. Following the breakout structure seen in TOTAL, TOTAL2, BTC.D, and US10Y, this chart utilizes 2 Fibonacci tools (1 trend-based extensions and 1 retracement) to project potential corrective and expansion scenarios.
Fibonacci Tools Used:
Fibonacci Retracement : Applies to the recent smaller swing to determine micro retracement zones and cluster supports.
0=20674 and 100=10504
Trend-Based Fibonacci Extension: Drawn using a three-leg structure (point A= 3993 to B=16724 to C10504) to forecast upside targets beyond ATH.
All take-profit (TP) levels: TP1 (~23,400), TP2 (~26,700), and TP3 (~30,344.49)—are located at confluence zones where Fibonacci levels from different tools align, reinforcing their validity and strength.
There is a 4TP above all the Visible TPs
Key price references:
0% retracement: ~20,674.71
Next Resistance ~23,400 (confluence of extensions and psychological resistance)
Projected TPs:
1TP=~23,400,
2TP=~26,700,
3TP=~30,344.49,
4TP=44000
Support/Resistance:
Red zone: ~16,700–18,300 (historical S/R and correction target and Fib Confluences)
Resistance zone: ~23,000–23,400 ,
22000(ATH area)
Key Technical Observations:
Fibonacci Retracement from ~20674 to ~15732 marks the initial corrective range.
Trend-Based Extensions forecast:
TP1 (~23,400): First breakout resistance
TP2 (~26,700): Medium-term expansion zone
TP3 (~30,344): Long-term target if macro tailwinds persist
Scenario Pathways:
Bullish Continuation: Breaks above ATH to reach TP2/TP3
Healthy Correction: Pullback to ~20,600 or deeper ~18,300 before resumption
Deep Correction: Revisits ~16,700 zone if macro environment deteriorates
Fundamental Context:
Tech Stocks & Economic Sentiment: NDX is often the first to move during liquidity expansions. Its performance signals risk-on behavior across global equity markets.
Rate Cuts in 2025: With anticipated Fed rate cuts, tech stocks are primed for inflows. Forward earnings valuations rise, justifying extended upside in high-beta tech.
AI Boom & Earnings Growth: Nasdaq is heavily weighted toward AI, cloud, and semiconductors—sectors expected to lead earnings surprises.
NDX Influence on Gold and Crypto
When NDX rallies:
Crypto: Risk appetite improves. Capital rotation flows into altcoins and layer-1 assets.
Bitcoin: Often sees parallel inflows, especially during strong tech rallies (e.g., 2020).
TOTAL & TOTAL3: Begin breakout patterns if NDX continues to surge.
Gold: May stall or correct as investors favor risk assets. However, gold still holds due to macro hedging and real yield pressures.
When NDX corrects:
Crypto: Volatility spikes. Altcoins bleed faster.
Bitcoin: Short-term dip but may decouple if viewed as digital gold.
Gold: Benefits from flight-to-safety behavior.
US10Y: Often reacts inversely to NDX moves—used for confirmation.
Search Highlights (2024–2025):
Institutions view NDX correction as signal to rotate into commodities (incl. gold).
Cross-market correlations show NDX peaks often precede crypto mini-rallies.
De-risking from NDX often triggers gold strength, especially in geopolitical or inflationary backdrops.
Bias & Strategy Implication
Primary Bias: Bullish
Expecting upside continuation to 26,700–30,000 zone
Multiple correction opportunities are present even during rally
Strategic Actions:
Monitor for correction to yellow/red zones for accumulation
Use NDX behavior as leading macro signal for crypto rotations
Watch resistance at 23,400 closely; breakout confirms trend extension
Time Horizon
Short-Term (1–2 months): Watch for breakout or correction to ~20,600–18,300
Mid-Term (3–6 months): Probable test of ~26,700
Long-Term (6–12 months): Potential expansion to ~30,344.49

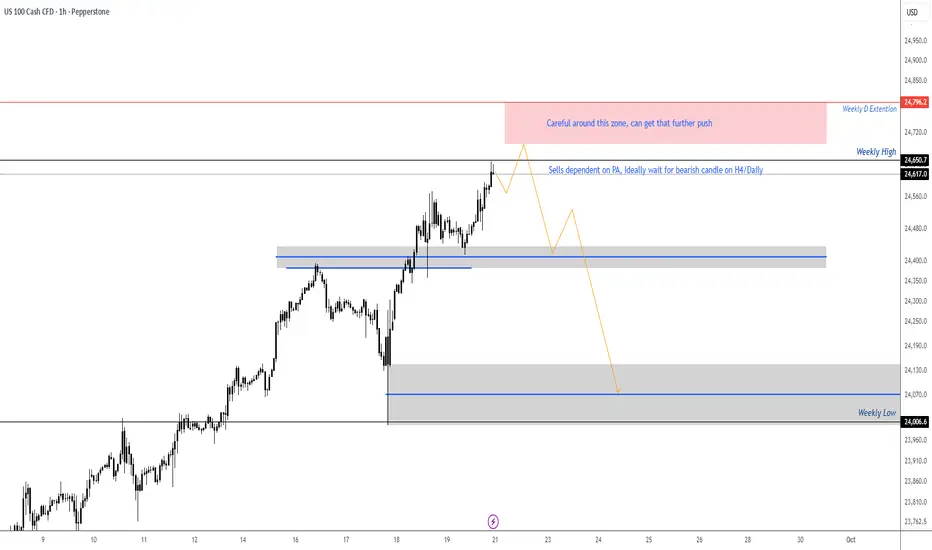
NASDAQ - setting up for Bearish SetupLooking for the bearish signal or the H4/Daily time frame, might get that final push for the D extension on the weekly timeframe, opening of the week might get a small pullback then continuation to the upside. Trade will be validated only if we get bearish PA setup on the H4/Daily. Looking for the setup to create a turn shape then can look for potential entries. If price does not present a bearish setup on the H4/Daily then the plan is no longer valid.