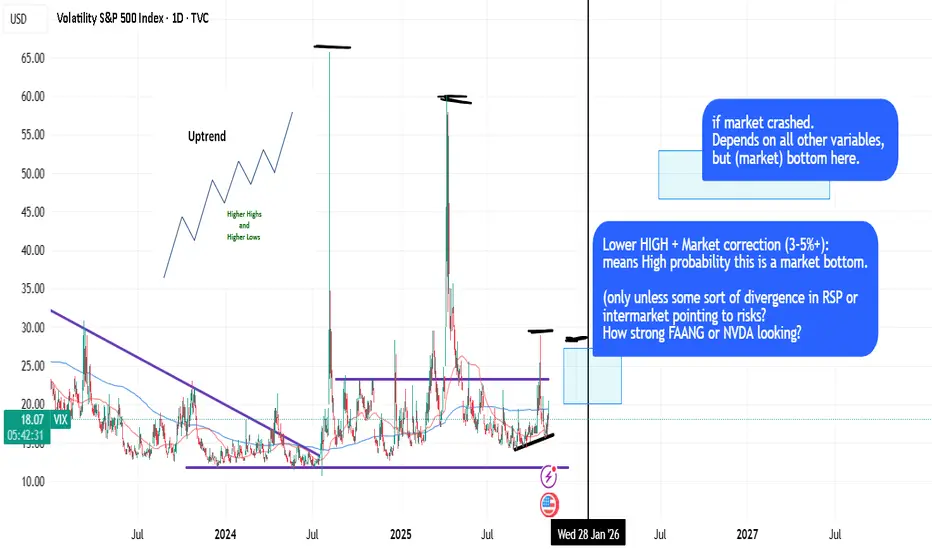
Using HLOW/LHIGH (Dow) + LOGIC to pinpoint probabilities.DOW Theory is the king of the stock market (Higher Lows, Lower Highs, uptrending, etc.) and it's quite basic concept to apply with logic.
Sometimes you can time the market (based on 50dma/200dma crosses, price extensions) and LHIGH dynamics and logic -> to pinpoint probabilities. Like, look at VIX dynamics during 2023/2024.
in short: DOW + LOGIC = PROBABILITY.
Trade ideas
QuantSignals Predicts Volatility CrushTicker: VIX
Current Price: 20.00
Trend: Bearish
Confidence: 75%
Volatility: 167.8%
Katy AI forecasts a significant volatility compression, projecting the VIX to drop toward 15.90, a -20.48% expected move.
📈 AI Price Predictions
30-Min Target: 20.06 (+0.30%)
Final Prediction: 15.90 (-20.48%)
The model shows a short-term stabilization before a sharp decline, consistent with volatility mean-reversion behavior.
🎯 Trade Signal
Direction: PUTS
Entry: 20.00
Target: 16.72
Stop Loss: 20.30
Expected Move: -20.48%
This setup aligns with a high-confidence bearish read, supported by AI trend direction and volatility compression indicators.
🔎 Strategy Notes
Trend consistency points to continued downside in volatility.
Tight stop-loss recommended due to VIX’s fast, nonlinear movements.
Works best for traders playing volatility normalization after elevated readings.
✅ Summary
Katy AI generated 1 high-confidence bearish signal out of 1 VIX analysis.
The setup favors PUTS, targeting a move toward 15.90–16.70 with strong model conviction.
VIX upVolatility is coming back significantly. VIX (Volatility) making higher lows and frequency of spikes upwards increases, something is coming, be warned! A major sell-off in stocks would be healthy and normal after 13 years of bull market. BUY Gold instead now, or UVIX or VXX and thank me later :)

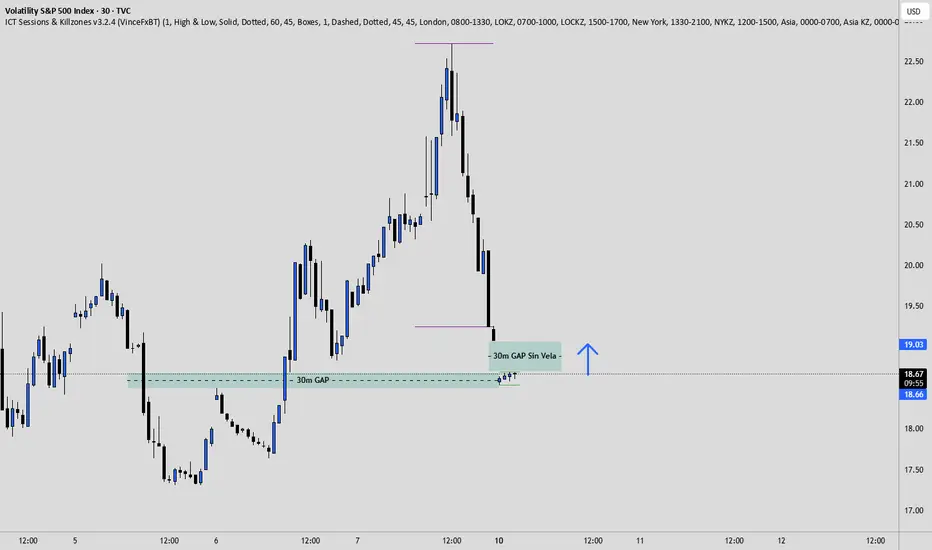
VIX Bullish - What does this mean for our NQ (NAS100) Short?Elite Analysis
Chart Context: VIX 30m
Price just tapped into a 30-minute gap (FVG) and reacted cleanly.
That gap (marked in green) is acting as a demand zone for volatility.
Each time the VIX bounces from a demand/FVG zone like this → volatility increases → equities (SPX, NASDAQ, US30) tend to drop.
----
Interpretation
VIX bouncing = Risk sentiment worsening.
This means fear/volatility is entering the market, often triggering sell-offs in indices.
Your NASDAQ short position aligns perfectly with this — the probability of a continuation down increases as the VIX reverses upward.
So, if VIX holds above 18.60 and expands toward 19.50–20.00, expect NASDAQ and S&P to drop into their next liquidity zones (25,300–25,000 area you mapped earlier).
----
VIX has reached a 30m imbalance and is starting to rebound. Rising volatility usually means selling pressure on NASDAQ and SPX.
If the VIX continues above 18.60, it supports our short bias on NAS100 toward 25,300–25,000.
📊 Educational purpose — not financial advice.
USE THE VIX TO TRADE BETTERSince the market has been a bit crazy lately, it's a good time to teach everyone about the VIX (Fear/Volatility Index) and how to use it to make your trading better.
In this video, I show you how I organize the VIX and use it every day to make my day trading and swing trading more adaptable to an ever-changing market environment.
VIX GUIDE:
Below 15: Low volatility. Calm markets, clean trend. Good for trend traders and swing traders.
15-20: Moderate volatility. This is the average level for the VIX. Market moves noticeably more.
20-25: High volatility. Big moves in the market start to happen at these levels. Great for experienced traders who like volatility. Caution for most other traders.
25-30: Extreme volatility. Tradable for experienced traders, but much greater difficulty level of trading. Most traders are advised to step back in this range.
30+: Chaos. Elite traders may profit, but it is very dangerous for the unprepared trader.

QuantSignals V3 | High-Probability VIX OptionsVIX Weekly Signal | 2025-11-17
Direction: BUY PUTS
Strike: $20.00
Entry: $0.00 (requires live price discovery)
Target 1 / 2: $0.10 / $0.20
Stop Loss: $0.00 / $20.13
Expiry: 2025-11-21
Confidence: 60% | Medium
Weekly Momentum: BEARISH (-4.02%)
Technical Notes: Slight bearish bias; support $18.97, resistance $20.13
Risk: Moderate – VIX is volatile; monitor options data carefully
Alternate VIX CALL Signal:
Strike $22.50, Confidence 70%, weekly bullish momentum +10%, strong trend confirmation, entry $0.00 (verify pricing), Target 1/2: $0.30/$0.50
VIX set to explode again!The last few days of selling in the markets have been intense (especially crypto), but I fear the intensity has only just begun!
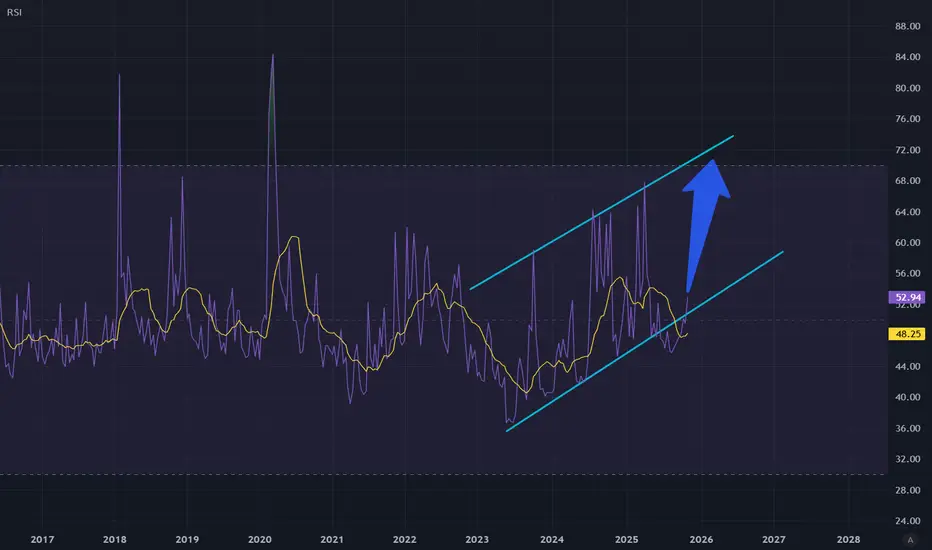
If we look at the structure of VIX over the entire bull run that began in late 2022 with the mass release of generative AI, we see something peculiar with VIX RSI.
It is the only bull market in which the VIX readings kept getting higher and higher. If we look at the 8 day VIX structure, we see over the summer we had broke below channel support. We have recently broken back into it and it is ominous indeed. The only way left to go is much higher.
Even now VIX is at 19 but the stock market itself is barely budging. In the past 19 would have seen the market dropping pretty strongly. I think the market is gearing up for a big push down!
$VIX: IT IS BASING While it's debatable if we can consider an IHS, it certainly appears to be consolidating for an upswing.

VIXSam Altman’s OpenAI strategy feels like “Trust me, bro” economics — promising to invest $1.4 trillion while making only $13 billion in revenue.
That’s not innovation — that’s speculation. When markets chase dreams instead of profits, they inflate bubbles. And every bubble bursts the same way: confidence collapses, liquidity dries up, and investors flee.
AI might be the next dot-com-style crash, where hype outpaces reality — until reality strikes back.
#stocks #ai #openai
Vix to 28Not a big fan of price patterns on vix but this looks like a confirmed cup with handle. Nice bear divergences as RSI passes through the solid red line price should accelerate to the 28.00 target
. Hourly chart

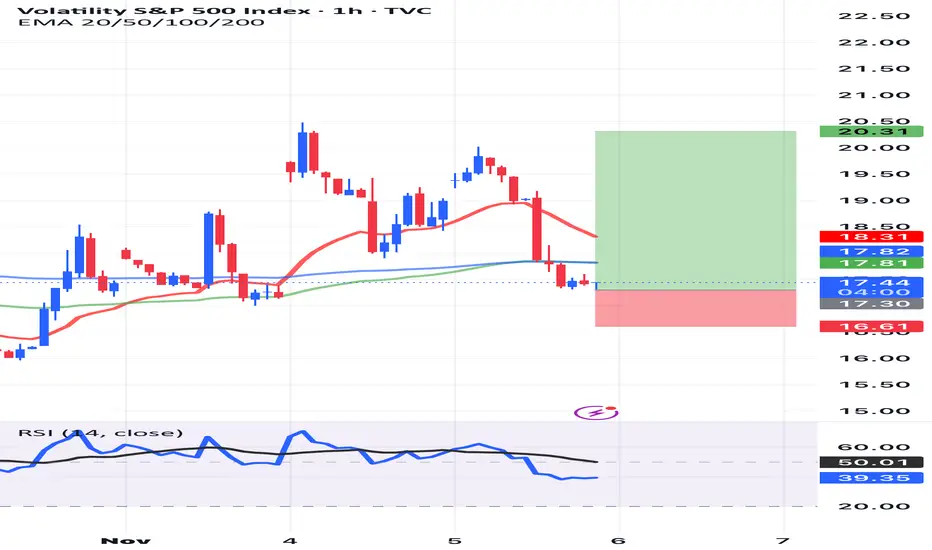
The VIX is Very ExpensiveVolatility has to dampen greatly for the institutional money to feel safe enough to get back into buying mode. Usually, a 50% retracement from recent highs marks a good signal for re-entry into the markets. We are clearly not their yet, but by the end of the week, we could be.
Equity Market Indices (S&P 500, Nasdaq, DAX, Nikkei)1. S&P 500 Index — The Global Benchmark
The Standard & Poor’s 500 Index, commonly known as the S&P 500, is one of the world’s most followed equity indices. It tracks 500 of the largest publicly listed companies in the United States. Unlike the Dow Jones Industrial Average, which uses price weighting, the S&P 500 uses free-float market capitalization weighting, making it a more accurate representation of the U.S. equity market.
Structure and Components
The index spans all major U.S. sectors, including technology, financials, healthcare, consumer discretionary, and energy. Mega-cap companies like Apple, Microsoft, Amazon, and Alphabet often dominate the index due to their large market capitalizations.
Economic Significance
The S&P 500 accounts for over 80% of U.S. total market value, making it a barometer for overall U.S. corporate health. Movements in the index reflect:
Corporate earnings trends
Investor sentiment
Monetary policy expectations
Global macroeconomic factors
Investment and Trading Use
Investors use the S&P 500 for:
Benchmarking fund performance
ETF and index fund investing (e.g., SPY, VOO)
Futures and options trading
Analysts often interpret a rising S&P 500 as a sign of economic expansion, while prolonged declines may indicate recession concerns.
2. Nasdaq Composite & Nasdaq-100 — Tech-Heavy Growth Indicators
The Nasdaq Composite is one of the most technology-heavy indices in the world, tracking over 3,000 stocks listed on the Nasdaq exchange. The more popular trading index, however, is the Nasdaq-100, which includes the top 100 non-financial companies on Nasdaq.
Technology Dominance
The Nasdaq is dominated by:
Technology
Internet services
Biotechnology
Semiconductor companies
Major names include Apple, Microsoft, Nvidia, Meta, and Tesla.
Characteristics and Sensitivity
Because it is tech-heavy, the Nasdaq tends to be:
More volatile than the S&P 500
Highly sensitive to interest rate changes
Influenced strongly by innovation trends, earnings expectations, and regulatory actions
Growth stocks, which dominate the Nasdaq, typically outperform during low-interest-rate environments when borrowing is cheaper and future earnings are more valuable.
Use for Traders
Traders often use the Nasdaq as a sentiment gauge for:
Tech sector strength
Risk appetite in markets
Momentum-driven trading strategies
Nasdaq futures (NQ) and ETFs like QQQ are among the most actively traded instruments globally.
3. DAX (Germany) — Europe’s Industrial Power Index
The DAX (Deutscher Aktienindex) is Germany’s leading stock index, representing 40 blue-chip companies listed on the Frankfurt Stock Exchange. Unlike other indices, the DAX is a performance index, meaning dividends are reinvested, resulting in slightly higher long-term returns.
Composition
The DAX includes major industrial, automotive, chemical, and financial giants such as:
Siemens
Volkswagen
Mercedes-Benz
Bayer
Allianz
SAP
Role in Europe
Germany is Europe’s largest economy, so the DAX essentially acts as a proxy for the health of the Eurozone economy. It reflects:
Manufacturing output
Export competitiveness
Global demand for automobiles and engineering
Euro currency movements
Key Drivers
The DAX is influenced by:
European Central Bank (ECB) policies
Eurozone inflation and GDP
Geopolitical relations with the U.S. & China
Energy prices (Europe is energy-dependent)
During periods of higher global industrial activity, the DAX typically performs strongly due to Germany’s export-led economy.
4. Nikkei 225 — Japan’s Economic Indicator
The Nikkei 225, Japan’s best-known stock index, tracks 225 top companies on the Tokyo Stock Exchange. Unlike most major indices, the Nikkei is price-weighted, similar to the Dow Jones, meaning higher-priced stocks have greater influence regardless of company size.
Sector Mix
Japan’s market includes a mix of:
Automotive companies (Toyota, Honda, Nissan)
Consumer electronics (Sony, Panasonic)
Industrial manufacturers (Fanuc, Hitachi)
Financial institutions
Economic Importance
The Nikkei reflects Japan’s:
Export competitiveness (especially to the U.S. and China)
Yen strength or weakness
Domestic consumption trends
Bank of Japan (BOJ) monetary policy
Japan's prolonged period of low interest rates and deflation has historically shaped the Nikkei’s long-term performance.
Yen Relationship
The Nikkei tends to rise when the Japanese yen weakens, because a weaker yen boosts export revenues. It often behaves inversely to USD/JPY currency movements.
5. How Traders Use These Indices
Market Sentiment Indicators
Each index provides insight into different segments:
S&P 500: overall U.S. economy
Nasdaq: tech and growth sentiment
DAX: European industrial strength
Nikkei: Asian economic trends
Sector Rotation
Investors analyze relative performance to gauge:
Growth vs. value cycles
Domestic vs. international capital flows
Risk-on vs. risk-off behavior
Hedging & Diversification
Indices are widely used for:
Portfolio diversification
Hedging through futures/options
ETF investing across regions
Correlation Behavior
S&P 500 and Nasdaq have high correlation
DAX moves closely with global manufacturing trends
Nikkei correlates strongly with currency markets
Understanding these correlations helps global traders manage risk and time their entries.
6. Global Impact of Index Movements
Because these are major world indices, movements can influence:
Commodity prices (oil, gold)
Currency valuations (USD, EUR, JPY)
Bond markets
Emerging market flows
For example:
A strong S&P 500 often attracts global capital into the U.S.
Weak DAX performance can signal European recession fears
A rising Nikkei can lift Asian equity sentiment
Conclusion
Equity market indices like the S&P 500, Nasdaq, DAX, and Nikkei 225 are more than just collections of stock prices. They are critical indicators of economic health, investor behavior, and global financial stability. Each index reflects the structure of its economy—U.S. technology leadership for Nasdaq, diversified large caps for the S&P 500, industrial might for the DAX, and export-driven growth for the Nikkei. Together, they form the backbone of global equity analysis and remain essential tools for traders, investors, and policymakers worldwide.

$VIX: ALLIGNED FOR FURTHER EQUITY MARKET WEAKNESS We can observe the following on the weekly chart:
1. MACD buy signal since September 29th
2. RSI 14 above the 50 line at 53
3. From October 27th onwards, higher weekly lows and higher weekly closing highs.
4. Despite new all-time highs for benchmark stock indices, there is a divergence with the TVC:VIX (negative divergence for equities)
If this pattern persists, the risk to the stock market remains.

VIX and SPX myths.There's truth about VIX longterm bottoms and SPX tops, but believing that concept can come biting you back.
Stock performance will correlate with SPX in relative terms? ie how much potential and lack of resistance. Stocks go in cycles. So probably this is a important concept to study and master.
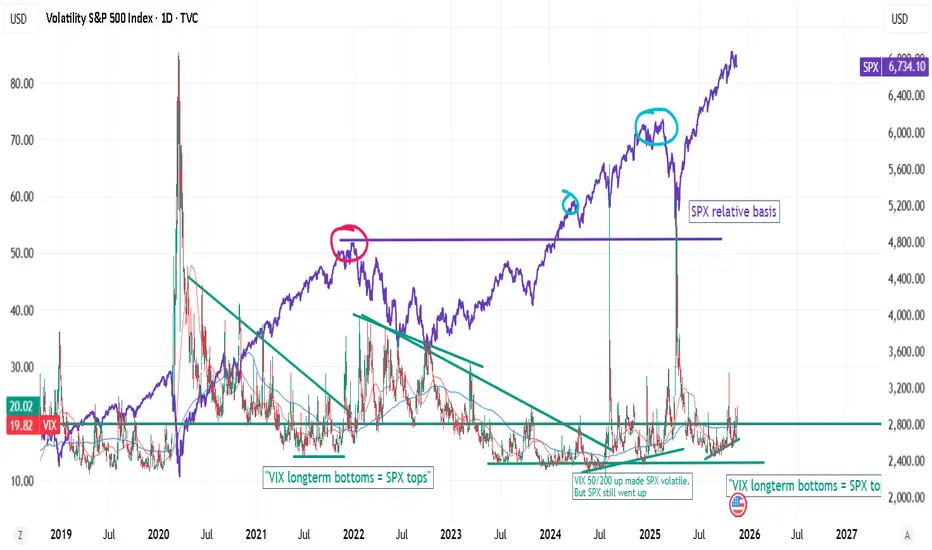
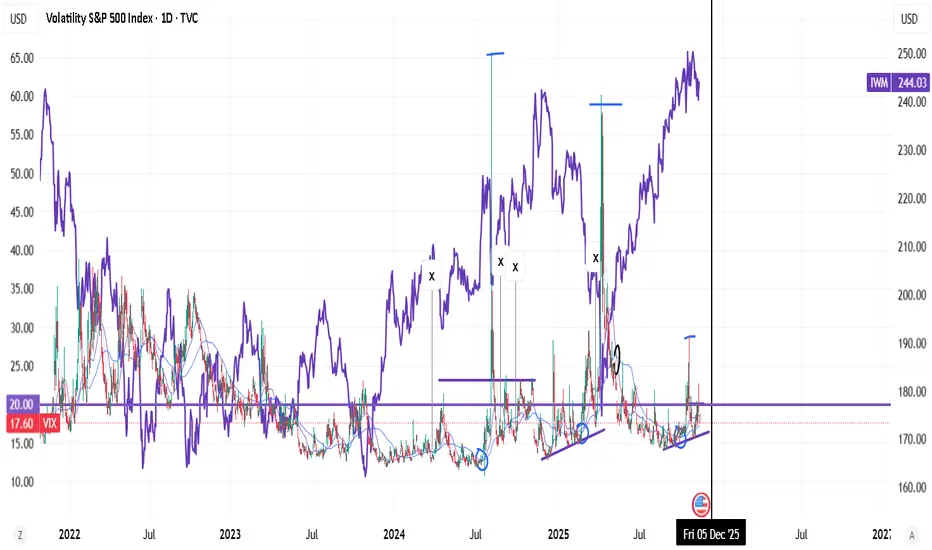
Upswingy VIX in patterns is bad for Small cap returns.Where VIX gets 10/20/50 upswings, goes in patterns (structure). it seems it's a bad period for small caps.
Also, rising $TNX. which is the case now .
x- stands for bullish weekly macds.
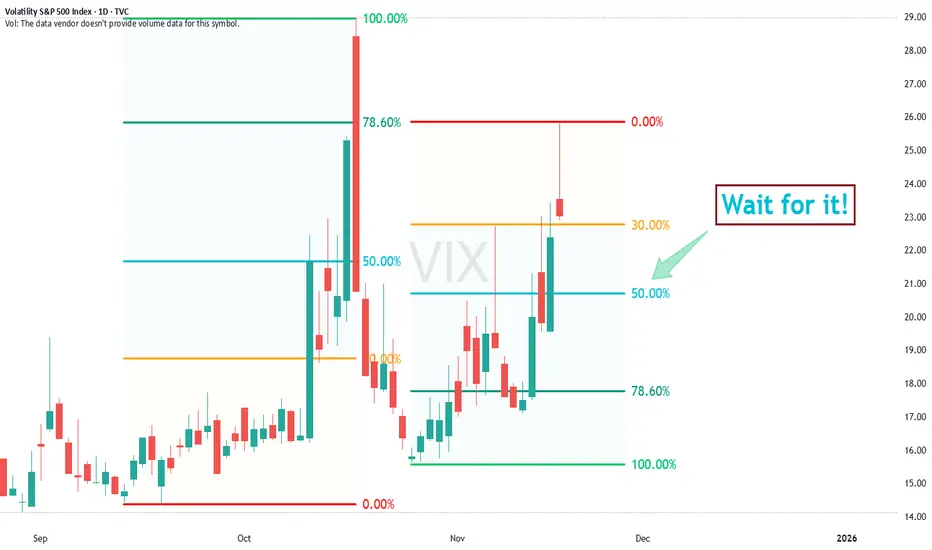
VIX breakout ? (aka SPY breakdown ?)Observations (not recommendations):
- Market looks toppish here
- everyone in "wait and see" mode, but wait what to the upside ?
- flip-side: any negative news could trigger next hiccup.
- VIX just touched support and bounced up.
Actions:
- Bought some VXX and TAIL on short leashes (tight stops). Any tweet or news could derail this!
VIX shortsVix shorts setting SPX and Nas for longs
It needs to close the Gap created
I want to see a correction

VIX is telling you.....It's sometimes really simple.
And simple is powerfull.
When the VIX. just like a stock,
creates higher lows after higher lows
for at certain amount of X time/months,
sooner or later we get the explosion of the VIX.
Looking at a currently very overpriced stockmarket
right now, you don't need to be an expert to see what coming.
I didn't say exactly WHEN, but you KNOW it's coming.
It's only a question of time.
And that some event will become the needle that pricks the bubble.
Don't say you didn't see this coming, after is has happened.
They said the same back in 2009.
#VIX
#bearmarket


Market is awfully bullishThe market in general is very bullish with many indices moving up higher and higher, but the price of gold has also been moving up higher which historically this doesn't end well. This could also mean that many allocation models have funds and liquidity being put into them. The bullish momentum can still continue but this is mainly year end flows following bullish sentiment into record highs along with the recent fed rate cut.

VIXTrading forex based on strong fundamentals is beneficial because it allows investors to make informed decisions grounded in real economic data rather than speculation. By analyzing key indicators like interest rates, inflation, GDP growth, employment, and geopolitical stability, a trader can anticipate currency movements driven by macroeconomic forces. This approach helps identify long-term trends and reduces emotional or impulsive trading, offering more consistent and sustainable profits. In essence, good fundamentals turn forex trading from a gamble into a strategic investment rooted in economic reality.

A scary fractal from 2020 Price is seeming to repeat what it did just before the covid crash. Seems like another massive VIX spike is coming soon.

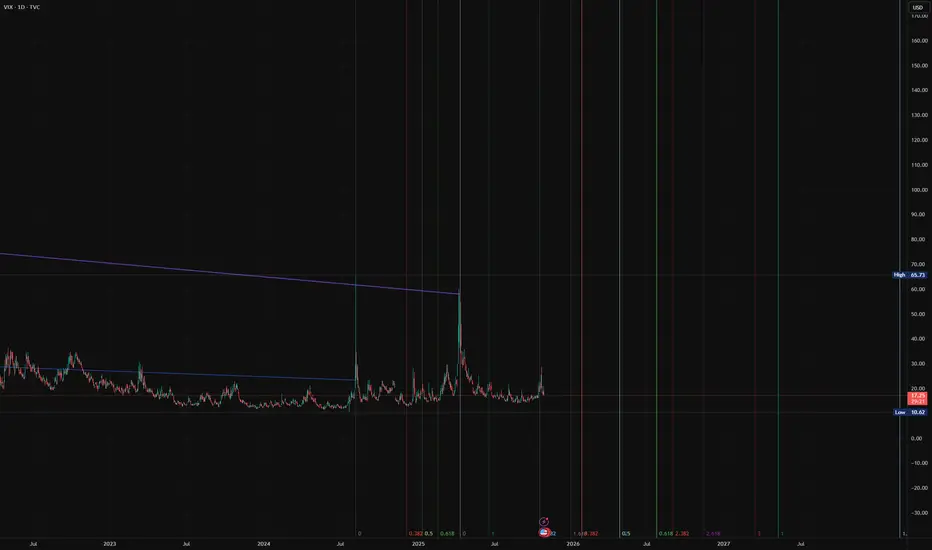
VIX fib based time extension on past high vol patterns.This is a rough estimate, but it looks about the same as all of the previous times. The chart is public so feel free to copy and publish. You have my full permission. Here's a link - sharing is on, and most layers are hidden (and on BTCUSD since that's usually what I trade)