US30 | Range boundUS30 is testing its resistance again and again and is moving between range.It is probably waiting for some strong trigger to carry the upside trend.
WS30M trade ideas
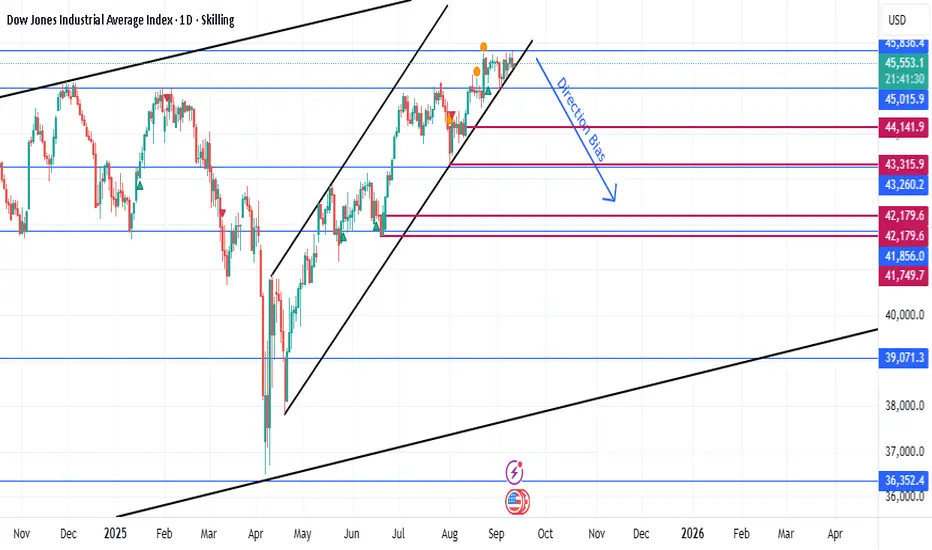
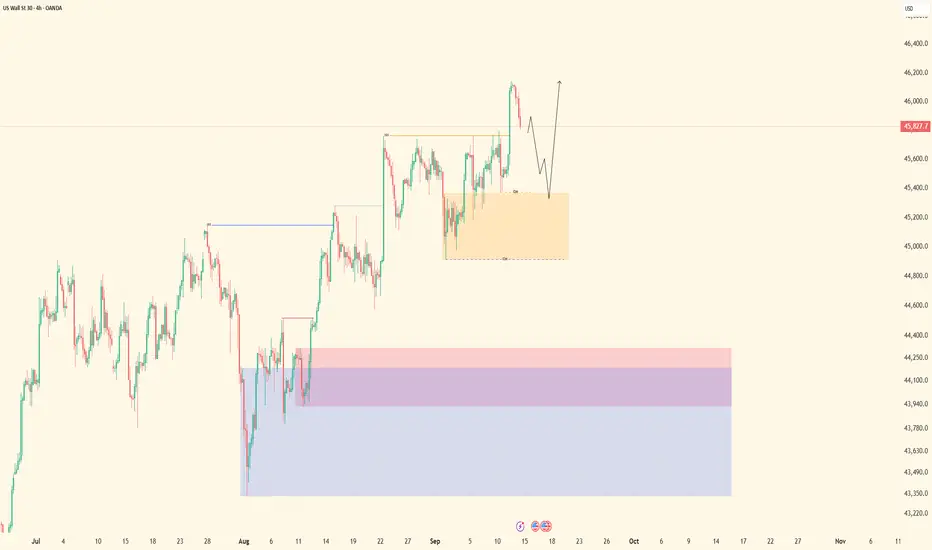
US 30 INDEX 11 SEPTEMBER 2025 TRADE IDEAThe US30 is currently trading near the top of an ascending channel, showing signs of exhaustion after a strong bullish run since April. Price is struggling to hold above the 45,500 area, suggesting the possibility of a pullback as liquidity builds up beneath recent higher lows. From a Smart Money Concepts perspective, the market structure remains bullish on higher timeframes, but with equal lows and inefficiencies below, a corrective move is likely. A clean break of the channel support could trigger a retracement toward key demand zones around 45,015, 44,141, and possibly deeper into 43,315–43,260, where institutional buyers may re-enter for continuation to the upside. Fundamentally, the short-term outlook is cautious, as traders await fresh US inflation and labor market data; softer economic releases would strengthen the case for Fed rate cuts later in 2025, which supports equities, while stronger-than-expected figures could put pressure on risk assets and fuel a temporary correction. Overall, the directional bias for the week is leaning bearish in the short term as price tests the upper channel, with expectations of a corrective dip into demand before resuming the broader bullish trend.
US30US30 needs some correction and then continue the same direction.
Disclosure: We are part of Trade Nation's Influencer program and receive a monthly fee for using their TradingView charts in our analysis.

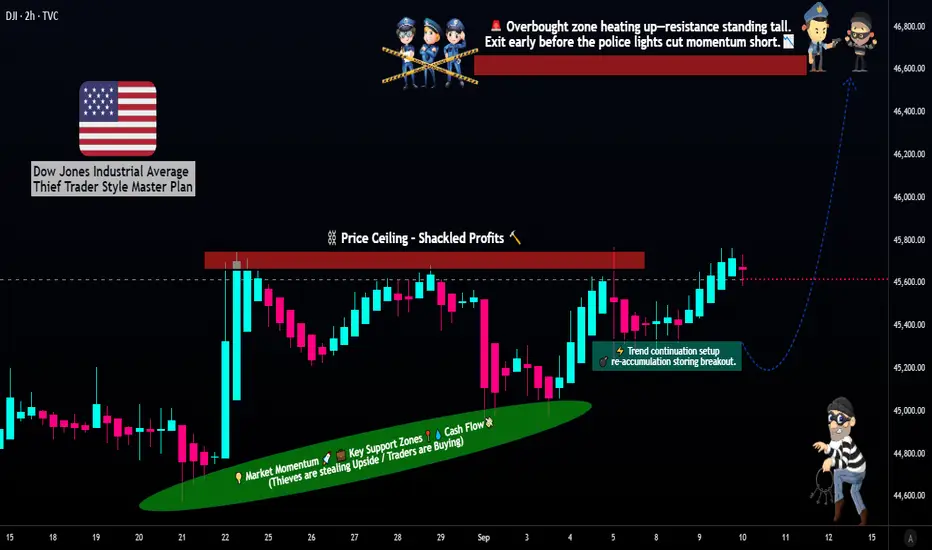
Can the DJIA Maintain Its Momentum? A Strategic Long Setup📈 DJIA Money-Making Plan: Thief Strategy (Swing/Day Trade) 🕵️♂️
🚀 Swing/Day Trade Setup for Dow Jones Industrial Average (DJIA) CFD
Join the "Thief OG" crew with this bullish plan to navigate the market with precision! Using a layered limit order strategy, this setup targets smart entries and calculated exits while keeping risk management first. Let’s dive into the plan! 💥
📊 Trade Plan Overview
Asset: Dow Jones Industrial Average (DJIA) CFD 💰
Direction: Bullish 🐂
Current Price (Sep 10, 2025): 45,711 🟢 (+0.43% from previous close)
Strategy: Thief Layered Limit Order Strategy 🕵️♂️
Place multiple buy limit orders at key levels to "steal" entries during pullbacks.
Suggested Entry Levels: $45,400, $45,500, $45,600, $45,700 (or customize based on your analysis).
Note: You can add more layers or adjust levels to suit your risk appetite. Flexibility is key! 🔧
Stop Loss (SL): $45,100 (Thief OG’s starting point).
Important: Adjust your SL based on your strategy and risk tolerance. This is a suggestion, not a rule! ⚠️
Target Price (TP): $46,600 (Escape before the "police barricade"!).
Note: Set your own TP based on your goals. Take profits at your discretion—don’t follow blindly! 💸
Risk Disclaimer: Dear Traders (Thief OG’s), this plan is a guide, not a guarantee. Always trade at your own risk and adjust SL/TP to your strategy. Protect your capital! 🛡️
🧠 Why This Plan? Thief Strategy + Market Insights
The "Thief" strategy uses layered limit orders to capitalize on pullbacks in a bullish trend, backed by solid market data. Here’s why this setup shines:
Thief Technical Strategy 🕵️♂️:
Layered Entries: Multiple buy limit orders ($45,400–$45,700) allow you to scale into the trade during dips, maximizing entry precision.
Risk Management: Suggested SL at $45,100 protects against unexpected reversals. Customize to your comfort level.
Profit Potential: Target $46,600 aligns with resistance levels and recent momentum. Exit strategically to lock in gains.
Fundamental & Macro Score: 7/10 (Solid Foundation) 🟢
Earnings Growth: Expected 7-10% for 2025, driven by strong corporate balance sheets.
Sector Strength: 10/11 S&P sectors up YTD, with tech and industrials leading.
Macro Environment:
Cooling inflation (CPI ~3.1% YoY).
Fed rate cuts expected, supporting growth.
Mild headwinds from tariffs and global trade risks.
Resilient labor market (unemployment 4.3%) and consumer spending fuel upside.
Trader Sentiment Outlook 😊:
Retail: 51% Bullish 🟢 | 34% Bearish 🔴 | 15% Neutral ⚪
Optimism driven by dip-buying in tech and industrials.
Institutional: 45% Bullish 🟢 | 40% Bearish 🔴 | 15% Neutral ⚪
Cautious positivity, focusing on corporate fundamentals amid policy uncertainties.
Overall Mood: Mildly positive, but stay alert for volatility from trade talks or inflation data.
Fear & Greed Index: 51 (Neutral) ⚖️
Balanced emotions: Not too scared, not too greedy.
Steady momentum, but watch for volatility spikes with upcoming data (e.g., inflation reports).
Market Outlook: Bullish 🚀
Bullish trend intact with no recession signals.
Expect modest single-digit % gains, led by earnings.
Stay cautious of pullbacks from policy news, but avoid shorting for now.
🔗 Related Pairs to Watch (in USD)
S&P 500 CFD ( SP:SPX ): Tracks broader market trends, often moves in tandem with DJIA.
NASDAQ 100 CFD ( NASDAQ:NDX ): Tech-heavy index, great for confirming bullish momentum.
FX:USDJPY : Currency pair sensitive to U.S. economic data and Fed policy.
OANDA:XAUUSD (Gold): Safe-haven asset; monitor for risk-off moves if sentiment shifts.
📝 Final Notes
This DJIA setup combines the tactical "Thief" layered entry strategy with robust market data to guide your trades. Stay disciplined, manage risk, and adapt the plan to your style. Let’s make smart moves together! 💪
✨ “If you find value in my analysis, a 👍 and 🚀 boost is much appreciated — it helps me share more setups with the community!”
#TradingView #DJIA #SwingTrading #DayTrading #ThiefStrategy #Bullish #TechnicalAnalysis #MarketAnalysis
Bye Bye - Dow & IndicesThis is not financial advice but a 100% true method of market structure and what to expect in the future. Watch and see.... Believe it or not!

Dow Jones support levels to watchThe Dow was the star of the show yesterday. After chopping sideways for a few days above the 45,000 mark – a crucial resistance level taken out back in late August – we’ve finally got that breakout everyone was waiting for. Thursday's push through the resistance around 45,760 is a strong signal that the bulls are still in charge. As long as we hold above that level on any retest, the uptrend looks very healthy. If we slip back below, yes, things could get a bit messy, but honestly, the broader structure still screams bullish. The 45,000 level remains the real line in the sand – lose that and the tone changes, but for now, I’d be surprised if we don’t see higher highs from here.
By Fawad Razaqzada, market analyst with FOREX.com

XAUUSD long idea for 4hr playout looking at this setup to playout as we seem to be in CSD range and are coming from the lower bands of the CSD. Next two sessions should play out with something like this.

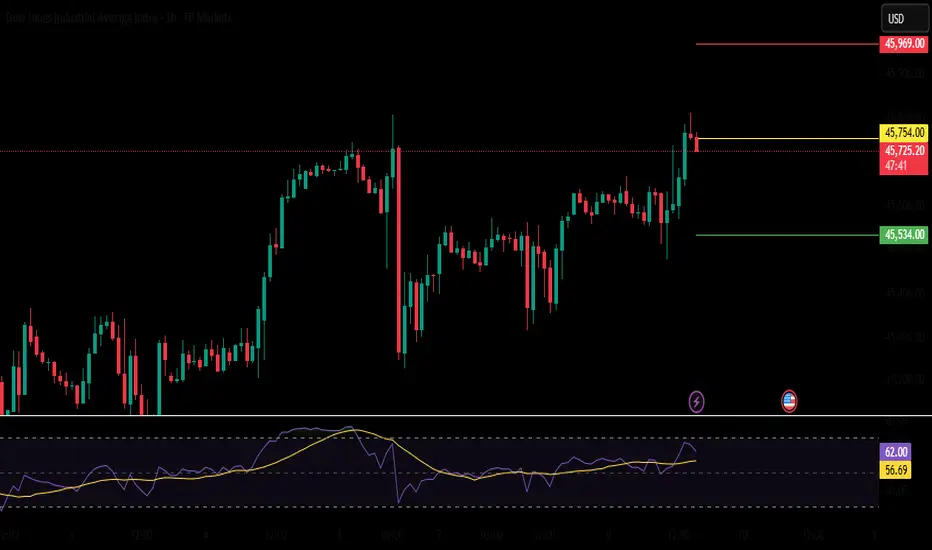
US30 In Support Below!
HI,Traders !
#US30 is trading in an
Uptrend and is
Now making a local bearish
Correction to retest the
Horizontal support below
Around 45730.1 from where
We will be expecting a
Further bullish move up !
Comment and subscribe to help us grow !
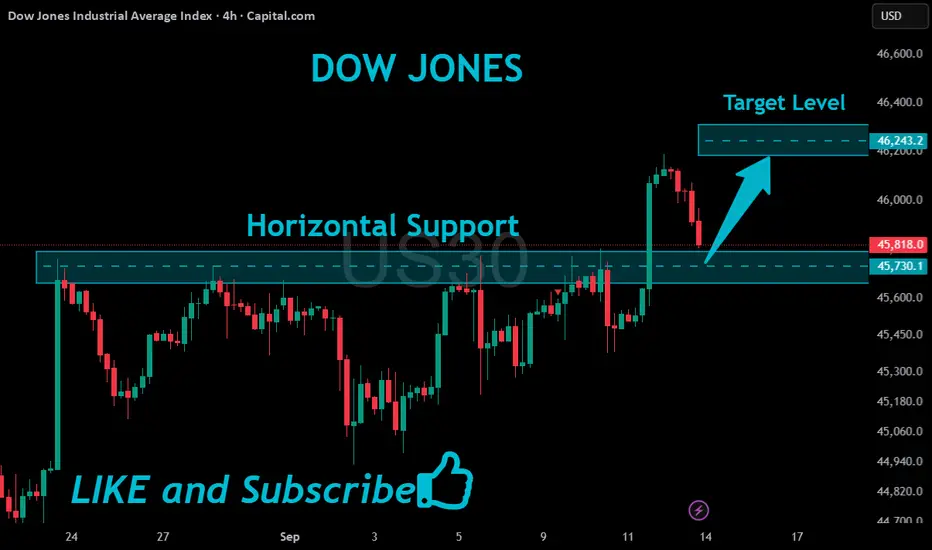
DowJones key support at 45800Key Support and Resistance Levels
Resistance Level 1: 46213
Resistance Level 2: 46415
Resistance Level 3: 46640
Support Level 1: 45800
Support Level 2: 45600
Support Level 3: 45360
This communication is for informational purposes only and should not be viewed as any form of recommendation as to a particular course of action or as investment advice. It is not intended as an offer or solicitation for the purchase or sale of any financial instrument or as an official confirmation of any transaction. Opinions, estimates and assumptions expressed herein are made as of the date of this communication and are subject to change without notice. This communication has been prepared based upon information, including market prices, data and other information, believed to be reliable; however, Trade Nation does not warrant its completeness or accuracy. All market prices and market data contained in or attached to this communication are indicative and subject to change without notice.

Us30 Trade Set Up Sep 11 2025www.tradingview.com
Price has pushed up above a key zone but left a SSL so i will expect price to sweep it before making internal structure on the 1m-2m creating a IFVG before going higher to PDH

US30 Pullback Toward 44,600 Within Ongoing UptrendHey Traders, in today's trading session we are monitoring US30 for a buying opportunity around the 44,600 zone. Dow Jones (US30) is trading in an uptrend, with price currently correcting toward this key support/resistance level.
Structure: The broader bias remains bullish, but price is pulling back after recent highs.
Key level in focus: 44,600 — a significant area where buyers may look to step in and continue the upward trend.
Fundamentals: Market sentiment remains broadly supportive for equities, with risk appetite steady as investors weigh U.S. economic data and central bank policy outlook.
Trade safe,
Joe.

SHORT TERM DOW - REVERSE (H & S ) PATTERN FORMATION🔹 Pattern Observed
The chart shows a reverse Head & Shoulders (H&S) attempt.
Left shoulder, head, and right shoulder are marked clearly.
But note: written that “8 out of 10 times H&S fails”, which is important — H&S is powerful, but also prone to false breakouts. AND FALSE BREAKOUT ITSELF IS VERY STONG SETUP!5
🔹 Short-Term Technical View
Structure:
Price attempted to form an inverse H&S, but neckline is not yet broken decisively.
Instead of breakout, Dow is showing weakness near the right shoulder.
Bearish Bias Active:
Failure of the reversal pattern often triggers sharp declines (trapped longs exit).
Breakdown projection is already plotted on your chart.
Target Zone:
Immediate downside target highlighted = 41,125.
That’s consistent with measuring the depth from head to neckline and projecting downward.
Invalidation:
If price reclaims and sustains above the neckline (~45,000–45,200 zone), the bearish view weakens.
🔹 Short-Term Trading Implication
Bias: Bearish as long as below neckline.
Target: 41,125 (short-term).
Stops: Above neckline (45,000+).
R:R: If entered near 44,600–44,800, reward to risk is favorable (2.5:1+).
✅ Conclusion
The Dow shows a failed inverse H&S, which typically results in downside continuation. Short-term target is 41,125, with risk managed above 45,000.
⚠️ Disclaimer:
This analysis is provided purely for educational and informational purposes only. It is not investment advice or a recommendation to buy, sell, or hold any security, index, or derivative. Trading carries significant risk of loss and may not be suitable for all investors. Please do your own due diligence or consult with a registered financial advisor before making any trading or investment decisions.

US30 SHORT FROM RESISTANCE
US30 SIGNAL
Trade Direction: short
Entry Level: 45,509.9
Target Level: 43,969.8
Stop Loss: 46,527.7
RISK PROFILE
Risk level: medium
Suggested risk: 1%
Timeframe: 1D
Disclosure: I am part of Trade Nation's Influencer program and receive a monthly fee for using their TradingView charts in my analysis.
✅LIKE AND COMMENT MY IDEAS✅

Dow Jones: Market Ready for a New Upward ImpulseMarket Overview:
The Dow Jones Index is holding above the key support zone of 45,100–45,200, forming a bullish structure. After a consolidation phase, the index is showing signs of an upside breakout.
Technical Signals:
Fibonacci levels point to potential growth toward 46,100, 46,350, and 46,700.
EMA 144 supports the bullish scenario, staying below the current price.
AO indicator is turning positive, confirming strengthening bullish momentum.
Key Levels:
Support: 45,100 – 45,200
Resistance: 46,100 – 46,700
Scenario:
The main scenario remains bullish — if the index consolidates above 45,600, we expect growth toward 46,100–46,700. The alternative scenario is a breakdown below 45,100, which could lead to a move toward 44,800.

Us30 Trade Set Up Sep 9 2025FX:US30
www.tradingview.com
Price is playing within a 1h HH/HL range so overall still bullish. We also got a 1h FVG thats holding so if price sweeps SSL and respects the 1h FVG again i will look for a 1m-2m IFVG for buys back up towards BSL, but if price inverts the 1h FVG i will look for sells down to PDL

US30 | BearishUS30 has hit all time high and and formed divergence on RSI after testing its resistance for third time.It has now printed LL and LH which indicates that it is going into bearish trend.

Us30 Trade Set Up Sep 12 2025www.tradingview.com
Price has made a ATH so i will need more context but for now we got a big bullish 4h FVG and a bearish 4h FVG. If price respects and fails to close above the bearish FVG i will look for sells to the 50% of the Bullish FVG but if price continues to make HH/HL and can trade through the 50% of the bearish FVG i will look for buys

SUPPORT and RESISTANCE_RUN ON BUYSIDE LIQUIDITY_SELLThe market has Created a new high at 45,790, the market may start to trade to the sell side during London expecting 45,201 to be taken. There is also news on 9.11 and 9.12 that may take out new high created at 45,790, then trade to the sell side to 45,201 level.

DowJones important support at 45190Key Support and Resistance Levels
Resistance Level 1: 45800
Resistance Level 2: 46000
Resistance Level 3: 46200
Support Level 1: 45190
Support Level 2: 44960
Support Level 3: 44720
This communication is for informational purposes only and should not be viewed as any form of recommendation as to a particular course of action or as investment advice. It is not intended as an offer or solicitation for the purchase or sale of any financial instrument or as an official confirmation of any transaction. Opinions, estimates and assumptions expressed herein are made as of the date of this communication and are subject to change without notice. This communication has been prepared based upon information, including market prices, data and other information, believed to be reliable; however, Trade Nation does not warrant its completeness or accuracy. All market prices and market data contained in or attached to this communication are indicative and subject to change without notice.

US30 - Bullish Continuation SetupBias: Bullish
High-Timeframe (4H/1H):
Price shows a strong bullish board structure with momentum firmly to the upside. Volume candles are clean and imprinted, signaling continuation potential and smart money control.
Mid-Timeframe (30M):
Dropped down to monitor board continuations. Structure has been mapped and refined—everything is aligned with HTF bullish intent. We are now waiting for proper sell-side liquidity to be taken. This is the “courtyard” where stops are absorbed before smart money resumes the upward move.
Lower-Timeframe (5M):
Once mitigation occurs and the order block is properly cleared, we will drop to 5M for precise entry confirmation. Price should hold the mitigated area, confirming smart money support before riding the continuation.
Entry Zone: Pending proper mitigation of the mid-timeframe order block.
Targets:
• Lower timeframe highs (5M)
• Mid-timeframe highs (30M)
Mindset Note:
Let smart money lead direction. No rushing entries—wait for the order block to be mitigated and price to confirm support before engaging. Patience and precision over impulse.

ICT CONCEPTS BLENDED W/SUPPORT AND RESISTANCE_SELLOn the weekly and Daily timeframes the next market move is not clear, following the trend we're bullish, but there is also a higher timeframe resistance has been met creating a higher high around the 45,774.20 level, and a move to the sell side is very possible, along with recent news events.

US30 on bullish Us30 had confirmed high possibility of buy by supporting with a bullish engulfer and a double bottom on rsi with H4 timeframe
