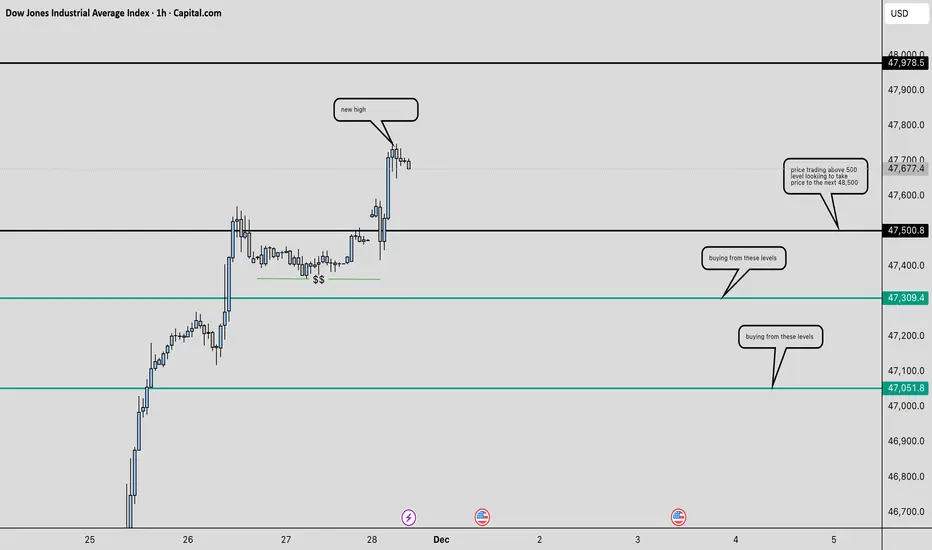
TRADING ODD FLATS ON US30
1} Trading US30 add flat ,i see that price made a over all high on the 4hr Time Frame 48 453
2} Now price is trending up i can trade the trend by buying off the odd flat 47,100,47 300 , 47 500 ect
3} Im trading looking for the market to make a pullback thats if it want to to make a pullback off the odd 57,500 flat
Trade ideas
US30 BUY PAPERSTONE CHART 1 DEC, 2025 TRADE IDEA 4Aftrer cancelling the sell order, i shifted my bias to buys. today i.m getting so many signals damn. but hey it's all time high so what did i expect

SELL ON US30 PAPERSTONE CHART DEC 12, 2025I See a shift in momentum towards the downside and i want to capitalise on this move.
despite being at all time high. i will exit when appropriate
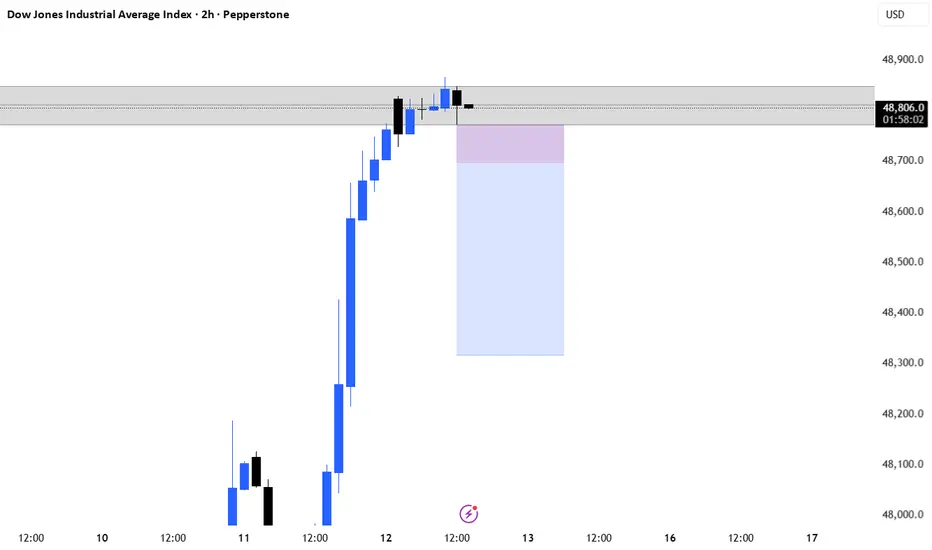
BUYS ON US30. FRI DEC 12, 2025. TRADE IDEA 3 CAPITAL.COM CHARTLooking For LONGS at all Time high if the current BUY Momentum Persists AS seen ON The H2 BULLISH candle. I don't have High expectations though being Friday and the fact that we are at All time High

US30 Trade Set Up Dec 12 2025Price remains bullish making ATH so i will want to see price first sweep internal London lows or lower SSL first before looking for 1m-5m IFVG/CISD to continue higher

DowJones key trading levelsKey Support and Resistance Levels
Resistance Level 1: 49000
Resistance Level 2: 49253
Resistance Level 3: 49600
Support Level 1: 48100
Support Level 2: 47870
Support Level 3: 47520
This communication is for informational purposes only and should not be viewed as any form of recommendation as to a particular course of action or as investment advice. It is not intended as an offer or solicitation for the purchase or sale of any financial instrument or as an official confirmation of any transaction. Opinions, estimates and assumptions expressed herein are made as of the date of this communication and are subject to change without notice. This communication has been prepared based upon information, including market prices, data and other information, believed to be reliable; however, Trade Nation does not warrant its completeness or accuracy. All market prices and market data contained in or attached to this communication are indicative and subject to change without notice.


H1 NEW WAVEUS30 bullish ,NEW HH printed
Pullback on the previous High ,
waiting an M5 shift in structure on the zone
To take a new move

US30: Late-Cycle Pop or Pullback Setup?The 𝐃𝐨𝐰 is pressing fresh highs into a historically soft seasonal window with stretched momentum and limited follow-through. I’m initiating/adding to a daily timeframe short aiming for a retrace back into prior breakout territory. My baseline path is a drift lower toward 44,500–44,000 (T1) and then the broader demand band near 43,000–42,2500 (T2), where I’ll reassess.
This isn’t a “crash” call—just a tactical mean-reversion as macro tailwinds fade, breadth narrows and the first Fed cut shifts the narrative from “rates down” to “why they’re down.”
Technicals:
• Stretched swing: Price has stair-stepped higher with shallow pullbacks; we’re now extended above the 50/100-DMA stack with waning impulse on push days (smaller real bodies, upper wicks).
• Local resistance: Repeated stalls into the same supply shelf. I’m leaning into the most recent failed extension and fading the box.
Structure map:
• Entry: around/into the failed-break zone 46.4k area.
• Invalidation: daily close > recent spike highs around 47.7k-48.0k.
• Targets: T1 45,000–44,500 (prior ATH retest / micro-POC region); T2 44,000–43,000.
• Risk: 0.5–1.0R per add; scale in only on rejection prints or lower-highs.
Fundamentals:
1) The first Fed cut is not automatically bullish.
The Fed delivered a 25 bps cut in September and signaled more easing, which historically can coincide with late-cycle growth scares and choppier equity returns rather than a straight-line melt-up. The cut was framed around cooling activity and inflation progress. 
2) Growth data is mixed—manufacturing still weak.
The ISM Manufacturing PMI remained in contraction in August (48.7)—below the 50 expansion line—signaling ongoing softness in goods demand. That is typically a headwind for the Dow’s cyclical mix. 
3) ES500 (S&P 500) breadth is narrow; concentration risk elevated.
Mega-caps continue to dominate performance and index leadership, while equal-weight underperforms and concentration risk stays high—conditions that historically increase pullback vulnerability. 
4) Valuations are rich versus history.
FactSet’s mid-summer forward 12-month P/E for the S&P 500 hovered well above 5- and 10-year averages (>22x vs. ~19x/17x), leaving less cushion if growth wobbles or margins compress. 
5) Sentiment & seasonality aren’t tailwinds.
September/early Q4 are seasonally tricky—historically the weakest stretch for US equities—just as the market tries to price the path of cuts vs. growth. 
6) Policy & trade headline risk.
Tariff timelines and “reciprocal” duties remain in play (with officials signaling Aug-1 implementation and additional measures possible), a rolling overhang for global cyclicals and exporters tied into the Dow complex. 
Note: Please remember to adjust this trade idea according to your individual trading conditions, including position size, broker-specific price variations, and any relevant external factors. Every trader’s situation is unique, so it’s crucial to tailor your approach to your own risk tolerance and market environment.

This week we leave it hereThe week has been overall bullish, but as we know we incurred a lot of losses, that is what we will be educating ourselves and finding solutions for. Instead of being bitter and sad about it, we try to win once more, but this time different, Happy trading.

Long therm Nixonian Gold TopExpansion and Rotation Top of Gold from 1980 at its peak, aligns with timing pivots and could be a strong possibility. Will be likely updated as it goes along. Real Estate top by 2028-'29 ?

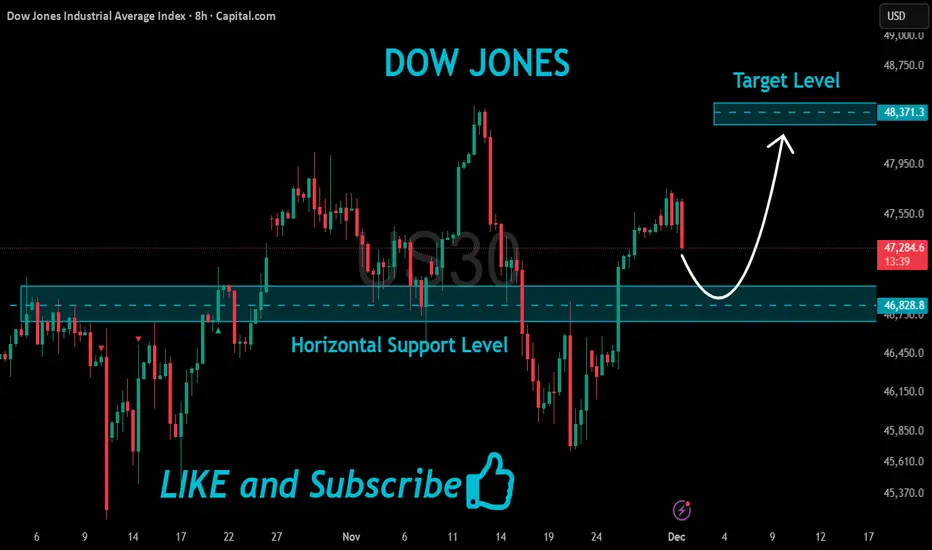
US30 Risky Long!
HI,Traders !
#US30 is about to retest
A horizontal support level
Of 46828.8 while trading
In a local uptrend so
We will be expecting a
Local bullish rebound
And a further move up !
Comment and subscribe to help us grow !
DowJones (DJI) IntraSwing Level for 11th - 12th Dec '25(2:30 amFED Rate Cut impact in Indian Financial Market:
Trading approach in NSE BSE
For an Indian trader, Fed cuts with a dovish or balanced guidance usually support:
Short‑term long bias in Nifty/Sensex and high‑quality large caps as flows and sentiment improve.
Overweight stance on IT, financials, autos, and select cyclicals, while closely tracking FPI flow data, dollar index, and USDINR for confirmation
The US Federal Reserve has just delivered its third consecutive rate cut, taking the federal funds target range down to about 3.5%–3.75%, the lowest since 2022. It is also signaling that the pace of further cuts will likely slow, with only very limited easing projected over the next couple of years.
Latest Fed move
The Fed reduced rates by 25 basis points at its December 2025 meeting, following similar cuts in September and October. This “hawkish cut” pattern reflects concern about a softer labor market while still being cautious because inflation is only gradually moving toward the 2% target.
Future cut expectations
Fed projections currently point to only one additional cut in 2026 and another in 2027, implying a very shallow easing path compared with what markets had been pricing in. Officials have stressed that further moves will depend heavily on incoming data on inflation and employment, so the path is explicitly data‑dependent rather than pre‑committed.
Market and global impact
US equities initially rallied on the latest cut, as investors welcomed lower discount rates and a still‑decent growth outlook for 2026. For emerging markets like India, the lower Fed rate tends to ease pressure on the dollar, supports currencies, and can give local central banks more room to consider their own rate cuts if domestic inflation allows
[ Level Interpretation / description:
L#1: If the candle crossed & stays above the “Buy Gen”, it is treated / considered as Bullish bias.
L#2: Possibility / Probability of REVERSAL near RLB#1 & UBTgt
L#3: If the candle stays above “Sell Gen” but below “Buy Gen”, it is treated / considered as Sidewise. Aggressive Traders can take Long position near “Sell Gen” either retesting or crossed from Below & vice-versa i.e. can take Short position near “Buy Gen” either retesting or crossed downward from Above.
L#4: If the candle crossed & stays below the “Sell Gen”, it is treated / considered a Bearish bias.
L#5: Possibility / Probability of REVERSAL near RLS#1 & USTgt
HZB (Buy side) & HZS (Sell side) => Hurdle Zone,
*** Specialty of “HZB#1, HZB#2 HZS#1 & HZS#2” is Sidewise (behaviour in Nature)
Rest Plotted and Mentioned on Chart
Color code Used:
Green =. Positive bias.
Red =. Negative bias.
RED in Between Green means Trend Finder / Momentum Change
/ CYCLE Change and Vice Versa.
Notice One thing: HOW LEVELS are Working.
Use any Momentum Indicator / Oscillator or as you "USED to" to Take entry.
⚠️ DISCLAIMER:
The information, views, and ideas shared here are purely for educational and informational purposes only. They are not intended as investment advice or a recommendation to buy, sell, or hold any financial instruments. I am not a SEBI-registered financial adviser.
Trading and investing in the stock market involves risk, and you should do your own research and analysis. You are solely responsible for any decisions made based on this research.
"As HARD EARNED MONEY IS YOUR's, So DECISION SHOULD HAVE TO BE YOUR's".
Do comment if Helpful .
Do Comment for In depth Analysis.
Follow notification about periodical View

US30 Trade Secured 1500 Pipsperfect trade, sweeping London lows then IFVG on the 2m to target 1h FVG

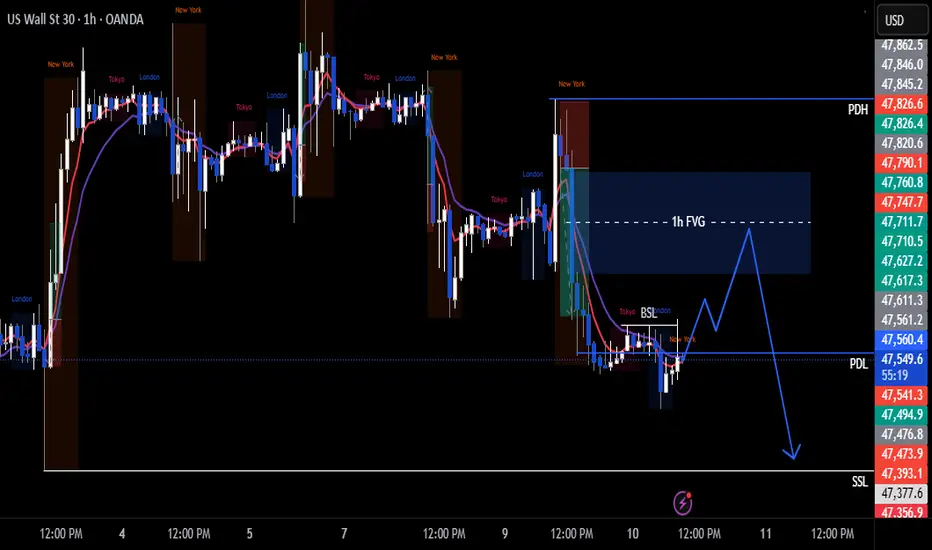
US30 Trade Set Up Dec 20 2025Price is overall bearish making LH/LL but has left a wide 1h FVG i will expect price to fill before continuing its bearish trend to lower SSL
GET READY FOR DOW30 HIGH PROBABILITY BUY SETUP SOON!!!🚨US30 HIGH PROBABILITY BUY SETUP 🚨
* Here We Can See Clearly The Next Potential Moves For DJ30 Coming Hours/Days.
* Keep Your Eyes Close On Your Trading Positions.
* Happy PIP Hunting Traders.
FXKILLA.

Bullish Setup for US30
We have bullish order flow on the 1M and 1W timeframes.
On the daily chart, we have a bullish high-probability leg with a clean FVG.
We took 4H $$ from the range, so we can potentially take sell-side liquidity before moving higher.
Stop: 4H SP(swing point) body
TP: ATH
RR: 1:2

$DJIPrices are elevated, and buyers may not be willing to keep absorbing at these high levels.
To attract fresh liquidity, the market might need to pull back or offer cheaper entry points, otherwise sellers could step in to rebalance the price.
This type of setup usually means volatility is coming as the market searches for fair value.

Going Long on US30I'm waiting for the price to come to my entry, but I will wait for price action for confirmation.

I'm going long on US30I'm waiting for the price to come to my entry, and wait for confirmation. That means price action.

US30 WatchFor those who see this I am a London/NY session intraday trader. So currently I'm watching Us30 I like to wait for a move and a obvious pull back and then continuation. I try not to have a predetermined bias because US30 tends go anywhere at anytime more times than it's not, it's more in my favor to react than to predict. Since 5AM its touched one of my quarter levels. I'm looking for some sort of higher time frame retracement and then looking for entries.
I try to keep my strategy simple. My charts are simple. I follow my own version of price action, which I'll look to explain as I continue to post my charts throughout the week. As of right now this is what I see and I'm still waiting.

US30 Trade Set Up Dec 9 2025Price remains bearish making LH/LL on the 1h so i will wait for a reaction from London lows being swept before looking for internal 1m-5m internal bearish structure to continue lower to demand and SSL

DJ30_Sell Analyses4h swing is Bearish and Price is in Premium gives Bearish Choch
15m swing is Bullish but
15m internal POI is align with 4h
may get some shorts opportunity a after 15m fractal Choch
