The Anatomy of a TSLA Retracement TradeBased on a detailed analysis of Tesla's recent price action, a compelling bearish thesis suggests that the stock is poised for a significant retracement. The current market structure indicates that the recent rally may be unsustainable, necessitating a retest of a critical support level to re-establish a more stable foundation.
The Bearish Hypothesis: Retracement to Trendline Support
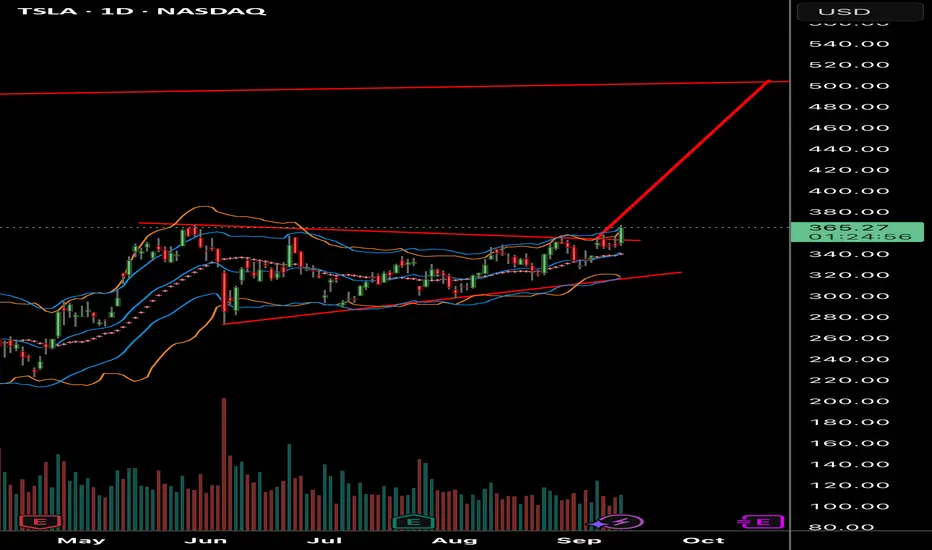
The core thesis is that the price is set to retrace and test the integrity of the ascending diagonal support trendline. This is not an indication of a full trend reversal, but rather a high-probability correction. T
This corrective phase will likely see the price descend to the lower boundary of the channel. A retest of this key support trendline is a common and healthy technical pattern.
Trade: A short position could be considered upon a clear rejection at the recent highs or upon a decisive breakdown of a minor support level, with the primary profit target being the ascending diagonal support trendline.
TL0 trade ideas

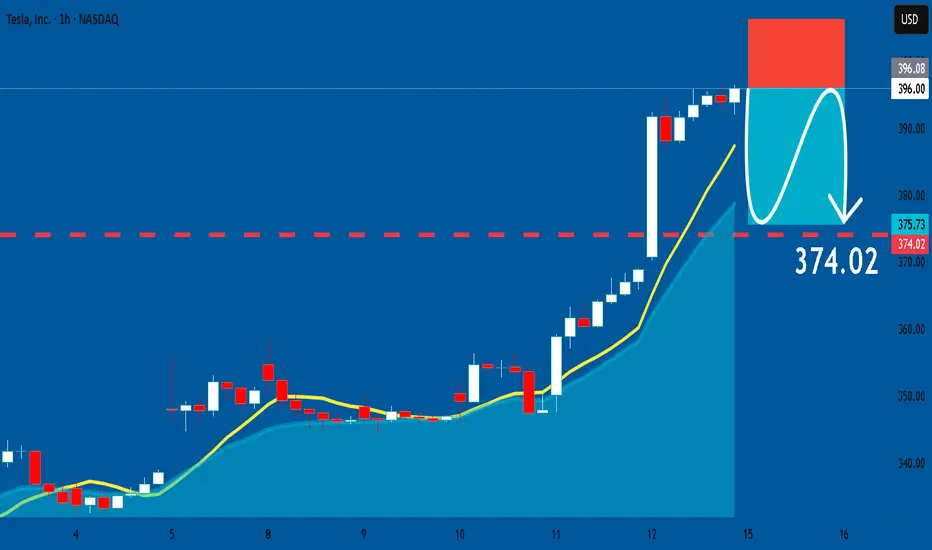
TESLA : Short Signal Explained
TESLA
- Classic bearish setup
- Our team expects bearish continuation
SUGGESTED TRADE:
Swing Trade
Short TESLA
Entry Point - 396.08
Stop Loss - 406.37
Take Profit - 374.02
Our Risk - 1%
Start protection of your profits from lower levels
Disclosure: I am part of Trade Nation's Influencer program and receive a monthly fee for using their TradingView charts in my analysis.
❤️ Please, support our work with like & comment! ❤️
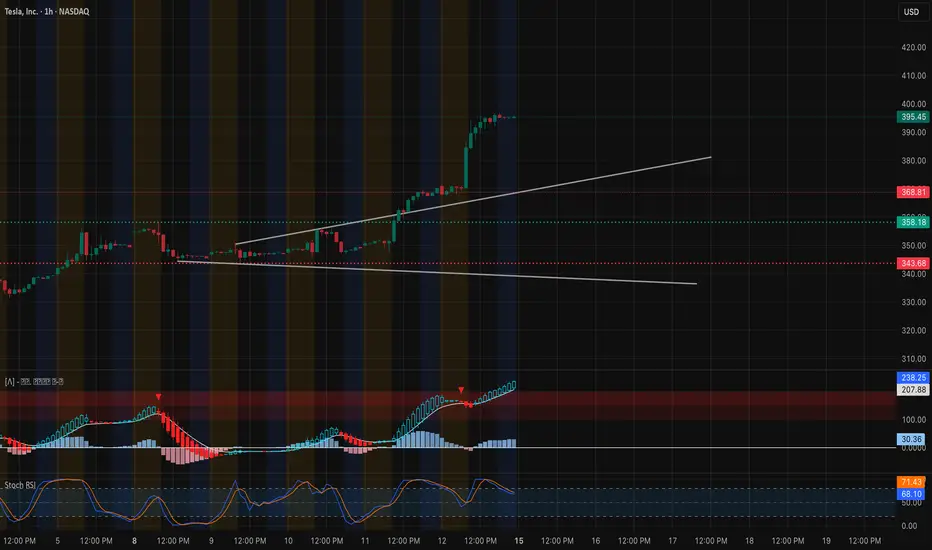
Follow-through buying on TSLA?Following a one-sided 6.0% gain in Tesla’s share price on Thursday, this helped lift the S&P 500 and Nasdaq to fresh records. As shown in the chart below, the TSLA Stock rallied through a 6M resistance level of US$360.03 to a high of US$368.99, levels which have not been seen since earlier this year.
Further buying could now be seen for the Stock towards the resistance between US$389.72 and US$383.09. However, before reaching said area, a pullback may occur, retesting US$360.03 as support, with a dip into 1M support from US$343.88 possible.
Written by the FP Markets Research Team

TSLA Eyes $400 Breakout — Key Levels & Trade Plans for Sep.15Market Preview
* Macro backdrop: U.S. index futures are steady after a strong tech rally last week. Rates and the dollar remain stable, leaving room for growth stocks to extend gains.
* Sector tone: EV and AI-related momentum is strong, with Tesla leading on heavy volume and institutional call buying.
Technical Analysis – TSLA
Trend & Structure (1-Hour Chart)
* Price surged to $395–396 and is consolidating near the highs.
* Structure remains firmly bullish with higher highs/lows and a well-defined rising channel.
Key Levels
* Resistance: $396.6 (highest positive NETGEX / CALL Resistance), $405, and $420 as next upside targets.
* Support: $389.9 (near-term pivot), $368.8 (major breakout base), $347.5 (HVL zone).
Momentum & Indicators
* MACD on 1H is bullish and expanding, supporting continuation.
* Stoch RSI is near overbought, signaling possible brief consolidation or a minor pullback before another leg higher.
* Volume remains strong, showing solid institutional demand.
Options/GEX Insight
* Massive call positioning (≈98% call bias) with positive GEX layers up to $420 suggests market makers may support higher prices.
* IVR 17.4 and IVx avg 61.5 indicate elevated but manageable volatility.
Trade Scenarios for Sept 15
* Bullish Plan:
* Entry: Break/hold above $396.6 with volume.
* Targets: $405 → $420.
* Stop: Below $389.9.
* Defensive Plan (if rejection occurs):
* Entry: Loss of $389.9 with momentum shift.
* Targets: $368.8 → $347.5.
* Stop: Above $396.6.
Summary
Tesla heads into Monday with a strong bullish setup. Holding above $389.9 keeps momentum intact, while a breakout over $396.6 could trigger a run toward $405–420.
Disclaimer: This analysis is for educational purposes only and does not constitute financial advice. Always do your own research and manage risk before trading.
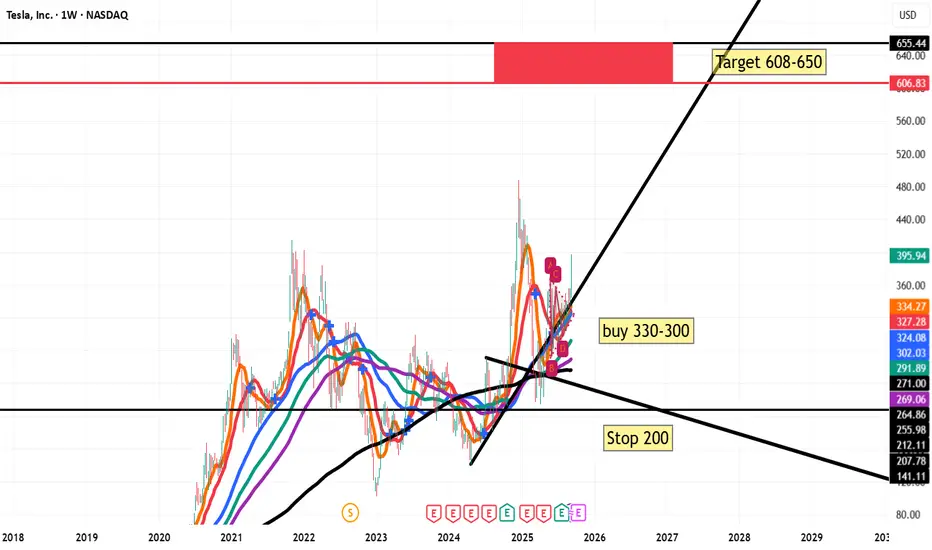
TSLATechnical Analysis (Weekly Chart – TSLA, NASDAQ):
Current Price: $395.94 (+12.85% in the latest session), showing strong bullish momentum.
Support Zone (Buy Area): The chart highlights an attractive buying range between $300–330, where multiple moving averages converge, acting as dynamic support.
Stop-Loss: Placed at $200, which sits well below the long-term trendline and previous key support. This ensures risk control in case of a major reversal.
Target Zone: The bullish projection is toward the $608–650 area, aligning with previous resistance levels and a strong supply zone from 2021–2022.
Trend & Structure:
The stock recently broke out of a consolidation pattern (A–B–C–D) with strength, supported by high volume and upward momentum.
Long-term moving averages (200-week shown in black) are flattening and turning up, signaling a potential multi-year bullish reversal.
If price sustains above $330, the bullish scenario remains valid with the probability of continuation toward $600+.
Outlook:
Short-term: Possible minor retracement to $330–350 before resuming the uptrend.
Medium- to Long-term: Bullish trend continuation toward $608–650.
Risk: A breakdown below $300 would weaken the bullish case, and a fall under $200 would invalidate it completely.
📌 Summary:
Tesla shows a strong bullish setup on the weekly chart. Entry zone is $300–330 with stop-loss at $200. The first major target is $608–650, offering an excellent risk–reward ratio for long-term investors.
Tesla Short: Stop above $368, TP at $298In this video, I re-initiated the short idea for Tesla. Reason being that I observed that around $367-ish is an important price point (although I have no idea why). Also, the move up has been more corrective in nature (since I drew ABCDE). The move also resembles a rising wedge.
In any case, the most important point in this idea is the stop loss which should be set above $368. The ultimate Take Profit Target for me is $298 with a short-term target of $344.
Good Luck!

TSLA Support & Resistance Lines for September Month 2025TSLA’s September map uses the same monthly bands. Expect faster moves and occasional overshoots; size accordingly.
30-minute for 2–3-day swings
Longs
Rejection at lower band: Buy back toward half-step; add on clean midline reclaim.
Acceptance + retest: Hold above a line and retest from the top → ride to next line.
Shorts (when price trades above lines)
Volatility fade: TSLA often overshoots the upper band. If a 30-min prints a wicky close back inside, short the fade.
- Targets: Nearest half-step, then midline.
- Stop: Above the overshoot high (give TSLA a bit of air).
UTAD-style failure: If TSLA holds above a band briefly but fails the retest (can’t sustain closes above, sellers reclaim), short on the first failed retest.
- Targets: Half-step → next line down.
- Invalidation: Clean 30-min close back above the failed line.
Management
Scale at each line; go flat if a 30-min close invalidates your level. Trail quickly after TP1—TSLA snaps.
1–3 hour for weekly swings
Bias
Acceptance above midline → continuation to the next band.
Rejection at upper band → path back to midline more likely.
Shorts
1–3h exhaustion above band: Bodies compress, momentum fades, then a close back inside → short toward the half-step/midline.
Break-and-fail sequence: Close above a band → lose it → retest from below fails → short continuation lower.
Risk: Stop just above the lost line; tighten on first target tag.

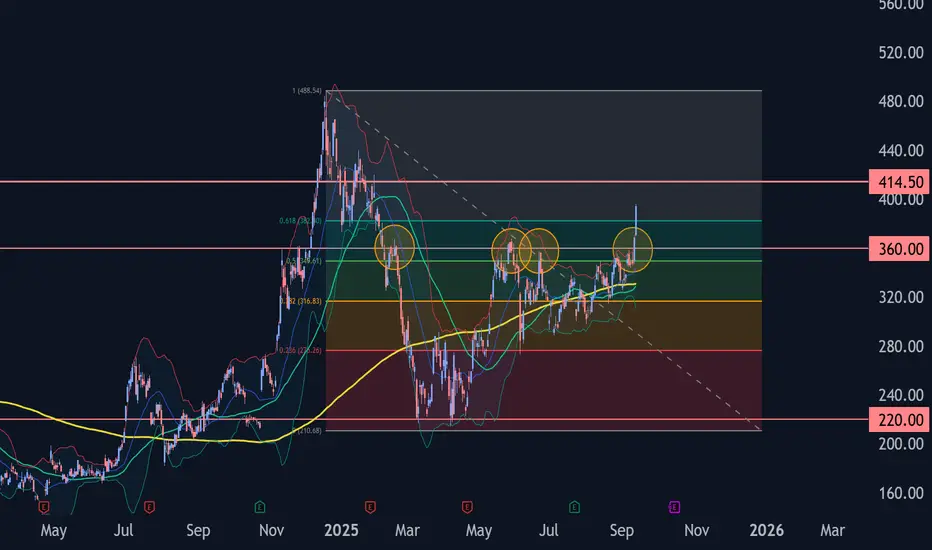
Tesla Wave Analysis – 12 September 2025- Tesla broke resistance area
- Likely to rise to resistance level 414.50
Tesla recently broke the resistance area located at the intersection of the resistance level 360.00 (which has been reversing the price from February), resistance trendline of the daily up channel from July and the 50% Fibonacci correction of the downward impulse from December.
The breakout of this resistance area accelerated the active impulse wave 3 of the intermediate impulse wave (3) from June.
Tesla can be expected to rise to the next resistance level 414.50 (target price for the completion of the active impulse wave 3).
TSLA about to POPClear play that I’ve been sharing with friends and it’s playing out perfectly so far
TESLA BULLISH BREAKOUT|LONG|
✅TESLA is going up
Now and the stocks is trying to
Made a bullish breakout
Of the key horizontal
Level of 367.50$ and IF breakout
Is confirmed we will be expecting
A further bullish move up
LONG🚀
✅Like and subscribe to never miss a new idea!✅

Could we see another Bullish leg on #TSLAmore consolidation here will confirm this wave scenario with targets of
324
384
The invalidation of this scenario is the break of 240.7 (-5%)
Trade safe

WXY structure with a double topTesla has been in a uptrend with a corrective structure WXY. I am not sure if the WXY is a part of wave 5 terminal structure or a B wave. However expecting a double top or 78.6 retrace to 425-430 range as a minimum. For this scenario, an impulsive upside move is expected within the next few weeks. However the price needs to move back into the channel next week as a first step.

$TSLA - channel breakout on the daily. possible $400 soonTSLA - Stock finally seeing channel breakout after long consolidation. calls above $370 looking good for a move towards $378 and $400. Stock is decent at indicator. needs to hold $365 to hold the breakout move.

TSLA $375 Call –Momentum + Options Flow Edge!
⚡ **TSLA 1‑Day Earnings/Weekly Scalp!**
📅 **Expiry:** 2025-09-12
🎯 **Strike:** \$375 CALL
💵 **Entry:** \$1.38 (Ask)
🛑 **Stop Loss:** \$0.69 → strict 50%
📈 **Profit Target:** \$2.07 (\~+50%)
📊 **Confidence:** 70% (Moderate Bullish)
⏰ **Entry Timing:** Market Open
💎 **Why This Trade:**
* Multi-timeframe momentum bullish (daily RSI 70.4, weekly RSI 67.8)
* Institutional call flow C/P = 1.57 → strong directional skew
* Low VIX (14.9) supports call buying
* Balanced strike with high liquidity (OI 16,237)
* Quick scalp: exit by Thursday close — avoid Friday gamma crush
⚠️ **Key Risks:**
* 1 DTE → extreme gamma & theta decay
* Underlying volume moderate → pullbacks possible
* News can reverse the move rapidly
* Use **small position sizing** (1–3% max risk)
💡 **Execution Tips:**
* Use limit at ask (\$1.38) or slightly better for control
* Hard stop at \$0.69
* Scale out at \$2.07 or partial at \$1.80
* Monitor intraday VWAP & price action; abort if momentum stalls
🎯 **Quick Take:** Cheap, high-conviction 1-day scalp with defined risk & asymmetric upside. Fast in, fast out, gamma-aware trade.

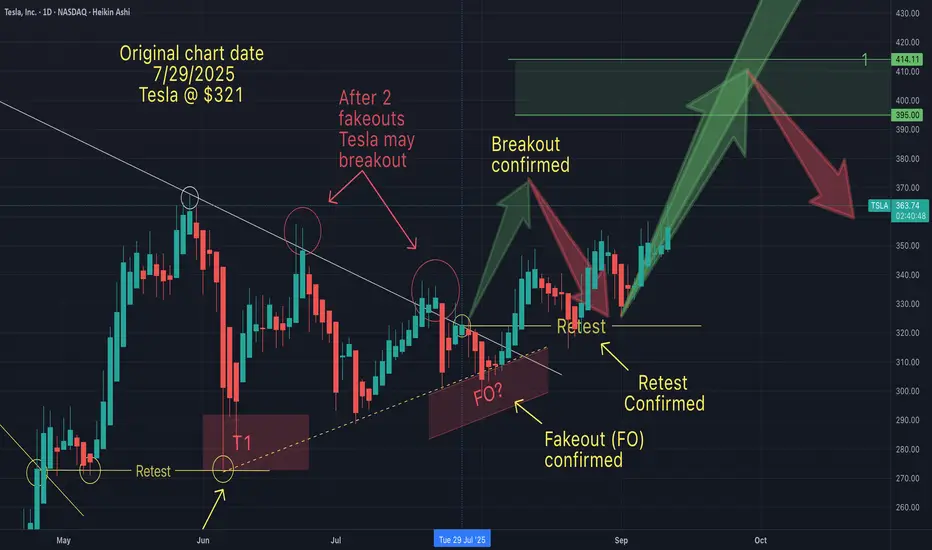
Is Tesla on it's way to $400+On July 29th I suggested that Tesla was about to break out to the upside (after fakeouts).
Then on Sep 4th I suggested that after a restest (of the breakout line), Tesla would begin its climb. This portion of the anticipated pattern now been confirmed.
One question now remains...will Tesla hit my T1 ($395 - $414).
What do you think? I'd like to know what the sentiment is out there. I'd like to hear your thoughts.
Geopolitical Tensions & Trade Wars1. Understanding Geopolitical Tensions
Definition
Geopolitical tensions refer to conflicts or rivalries between nations that arise from differences in political systems, territorial claims, military strategies, or economic interests. These tensions often extend beyond diplomacy into military confrontations, sanctions, cyber warfare, and trade restrictions.
Key Drivers of Geopolitical Tensions
Territorial disputes – e.g., South China Sea, India-China border, Israel-Palestine conflict.
Resource competition – oil, natural gas, rare earth minerals, and even water supplies.
Ideological differences – democracy vs. authoritarianism, capitalism vs. socialism.
Technological dominance – battles over 5G, semiconductors, and artificial intelligence.
Strategic influence – the U.S. vs. China in Asia-Pacific, Russia vs. NATO in Eastern Europe.
Geopolitical tensions may not always escalate into war, but they often manifest as economic weapons, including tariffs, sanctions, and restrictions on trade.
2. What Are Trade Wars?
Definition
A trade war is an economic conflict between nations where countries impose tariffs, quotas, or other trade barriers against each other, often in retaliation. Instead of cooperating in the free exchange of goods and services, they use trade as a weapon to gain leverage.
Mechanisms of Trade Wars
Tariffs – taxes on imported goods (e.g., U.S. tariffs on Chinese steel).
Quotas – limits on the number of goods imported (e.g., Japan’s rice import restrictions).
Subsidies – financial aid to domestic industries, making exports cheaper.
Export controls – restricting key goods, like semiconductors or defense equipment.
Sanctions – blocking trade altogether with specific countries or entities.
Difference Between Trade Dispute and Trade War
A trade dispute is usually limited and negotiable (resolved via WTO).
A trade war escalates into repeated rounds of retaliatory measures, often causing collateral damage to global supply chains.
3. Historical Background of Trade Wars
Mercantilism in the 16th–18th centuries – European powers imposed heavy tariffs and colonized territories to control resources.
Smoot-Hawley Tariff Act (1930, USA) – raised tariffs on over 20,000 goods, worsening the Great Depression.
Cold War Trade Restrictions (1947–1991) – U.S. and Soviet blocs limited economic interaction, fueling technological and arms races.
Japan-U.S. Trade Tensions (1980s) – disputes over Japanese car and electronics exports to the U.S. led to tariffs and voluntary export restraints.
U.S.-China Trade War (2018–present) – the most significant modern trade war, involving hundreds of billions in tariffs, sanctions, and tech restrictions.
4. Causes of Trade Wars in the Modern Era
Economic Protectionism – shielding domestic industries from foreign competition.
National Security Concerns – restricting sensitive technologies like 5G, AI, and semiconductors.
Geopolitical Rivalry – economic weapons as part of larger power struggles (e.g., U.S. vs. China, Russia vs. NATO).
Unfair Trade Practices Allegations – accusations of currency manipulation, IP theft, or dumping.
Populism & Domestic Politics – leaders use trade wars to appeal to local voters by promising to "bring jobs back home."
5. Case Study: The U.S.-China Trade War
The U.S.-China trade war (2018–present) is the most important example of how geopolitical rivalry shapes global trade.
Phase 1 (2018): U.S. imposed tariffs on $50 billion worth of Chinese goods, citing unfair trade practices and intellectual property theft.
Retaliation: China imposed tariffs on U.S. agricultural products, especially soybeans, targeting American farmers.
Escalation: Tariffs expanded to cover $360+ billion worth of goods.
Technology Restrictions: U.S. banned Huawei and restricted semiconductor exports.
Phase 1 Agreement (2020): China promised to increase U.S. imports, but tensions remain unresolved.
Impact:
Global supply chains disrupted.
Rising inflation due to higher import costs.
Shift of manufacturing from China to Vietnam, India, and Mexico.
U.S. farmers and Chinese exporters both suffered losses.
6. Geopolitical Hotspots Affecting Trade
1. Russia-Ukraine War
Western sanctions cut Russia off from global finance (SWIFT ban, oil & gas restrictions).
Europe shifted away from Russian energy, sparking energy crises.
Global wheat and fertilizer exports disrupted, raising food inflation worldwide.
2. Middle East Conflicts
Oil is a geopolitical weapon—any conflict in the Persian Gulf impacts global crude prices.
OPEC+ decisions are often politically influenced, affecting both producers and consumers.
3. South China Sea
A vital shipping lane ($3.5 trillion in trade passes annually).
Territorial disputes between China and Southeast Asian nations raise risks of blockades.
4. Taiwan & Semiconductors
Taiwan produces over 60% of global semiconductors (TSMC).
Any conflict over Taiwan could paralyze global tech supply chains.
5. India-China Border & Indo-Pacific Rivalries
India bans Chinese apps and tightens investment rules.
Strengthening of Quad alliance (US, India, Japan, Australia) reshapes Asian trade.
7. Impact of Geopolitical Tensions & Trade Wars
1. On Global Economy
Slower global growth due to reduced trade flows.
Inflationary pressures from higher tariffs and supply disruptions.
Increased uncertainty reduces foreign direct investment (FDI).
2. On Businesses
Supply chain realignments (China+1 strategy).
Rising costs of raw materials and logistics.
Technology companies face export bans and restrictions.
3. On Consumers
Higher prices for imported goods (electronics, fuel, food).
Limited choices in the market.
4. On Financial Markets
Stock market volatility increases.
Commodity prices (oil, gold, wheat) spike during conflicts.
Currency fluctuations as investors seek safe havens (USD, gold, yen).
5. On Developing Nations
Export-dependent economies suffer as global demand falls.
Some benefit by replacing disrupted supply chains (e.g., Vietnam, India, Mexico).
8. The Role of International Institutions
World Trade Organization (WTO)
Provides a platform to resolve disputes.
However, its influence has declined due to U.S.-China disputes and non-compliance.
International Monetary Fund (IMF) & World Bank
Provide financial stability during crises.
Encourage open trade but have limited enforcement power.
Regional Trade Agreements
CPTPP, RCEP, EU, USMCA act as counterbalances to global tensions.
Countries diversify trade partnerships to reduce dependence on rivals.
9. Strategies to Manage Geopolitical Risks
Diversification of Supply Chains – "China+1" strategy by multinationals.
Hedging Against Commodity Risks – futures contracts for oil, wheat, etc.
Regionalization of Trade – building self-sufficient trade blocs.
Technology Independence – countries investing in local semiconductor and AI industries.
Diplomacy & Dialogue – ongoing talks via G20, BRICS, ASEAN, and other forums.
10. The Future of Geopolitical Tensions & Trade Wars
Rise of Economic Nationalism: Countries prioritizing local industries over globalization.
Technology Wars Intensify: AI, semiconductors, and green energy will be new battlegrounds.
Fragmentation of Global Trade: Shift from globalization to "regionalization" or "friend-shoring."
Energy Transition Risks: Conflicts over rare earth metals, lithium, and cobalt needed for batteries.
New Alliances: BRICS expansion, Belt & Road Initiative, and Indo-Pacific strategies will reshape global economic influence.
Conclusion
Geopolitical tensions and trade wars are not temporary disruptions but structural features of the modern global economy. While globalization created interdependence, it also exposed vulnerabilities. Trade wars, sanctions, and economic blockades have become powerful tools of foreign policy, often with far-reaching economic consequences.
For businesses and investors, the challenge lies in navigating uncertainty through diversification, resilience, and adaptation. For policymakers, the task is to strike a balance between protecting national interests and sustaining global cooperation.
Ultimately, the world may not return to the hyper-globalization era of the early 2000s. Instead, we are moving toward a multipolar trade system shaped by regional blocs, strategic rivalries, and technological competition. How nations manage these tensions will determine the stability and prosperity of the 21st-century global economy.
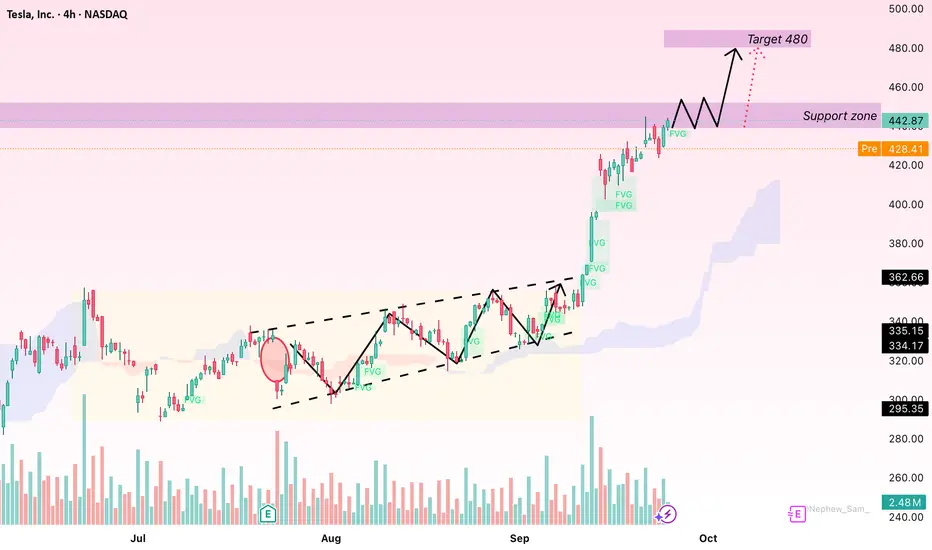
TSLA: Likely to Continue Rising if Holding Above $440Hello everyone,
Today, Tesla (TSLA) shares are trading at $442.87, up 0.77% from the previous close. After a strong rally recently, the market is closely watching whether TSLA can sustain its upward momentum or if a short-term pullback may occur.
The slight retreat in recent sessions mainly stems from profit-taking as the stock approached the $450 mark, creating temporary selling pressure. However, Fair Value Gaps (FVGs) formed during prior rallies are providing important support zones. These levels could serve as potential entry points if the price tests them again.
Trading volume has increased significantly in recent sessions, indicating strong participation from large investors and reflecting long-term confidence in Tesla. As long as the stock holds above the $440 support level, there is a good chance it could rebound to $450 and potentially reach $460 in the coming sessions.
Technical factors such as the Ichimoku cloud structure, combined with support from FVG zones, reinforce the bullish trend. On the macro side, although the Fed maintains a tight monetary policy, current interest rates still provide a favorable environment for tech stocks. Expectations of possible rate cuts in the future are adding further support for TSLA.
In the electric vehicle sector, Tesla continues to lead with production expansion, technology upgrades, and new product launches. News related to these developments often directly impacts the stock price, driving further gains.
Strong inflows from major investors, along with market attention on sales reports and technological progress, continue to support a positive short-term outlook for TSLA.
What’s your view on Tesla’s stock in the coming days? Share your thoughts below!
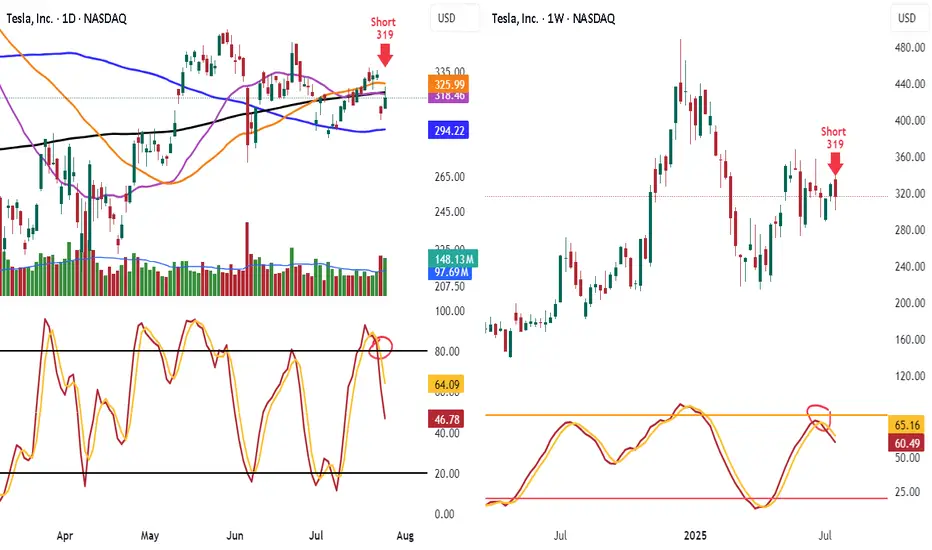
Shorted TSLA 319 Look at TSLA hit 50 day and 200 day MA and failed and know under them
Look at the lower highs and see the stoch heading down
Know lets look weekly stoch heading down and lower highs
Target is 100 day ma 294.22 take some off. When it breaks will add back on
Have trailing stop in place
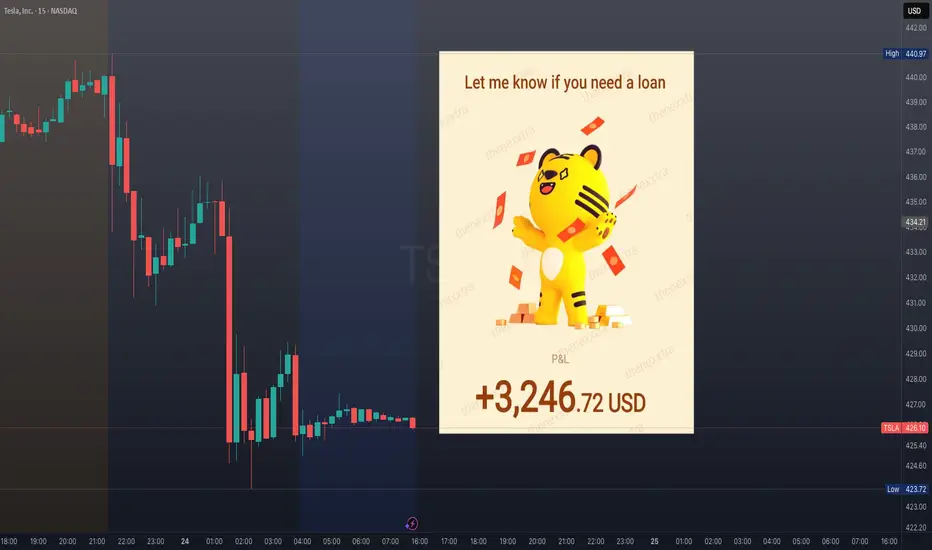
$TSLA broke down today on the 15-minute chart.NASDAQ:TSLA broke down today on the 15-minute chart.
Not with fireworks, but with precision — the type of move that punishes late longs and rewards those who prepared.
The truth? It’s never about guessing the direction.
It’s about setting the framework before the bell: pre-market levels mapped, risk defined, noise filtered.
When the signal confirms, you don’t hesitate. You execute.
Most of the time, the market whispers.
Sometimes, it shouts.
Your edge is built in the quiet hours, so when the move comes, you’re already positioned.
Cut losers fast.
Let winners breathe.
Keep showing up until probability pays you.
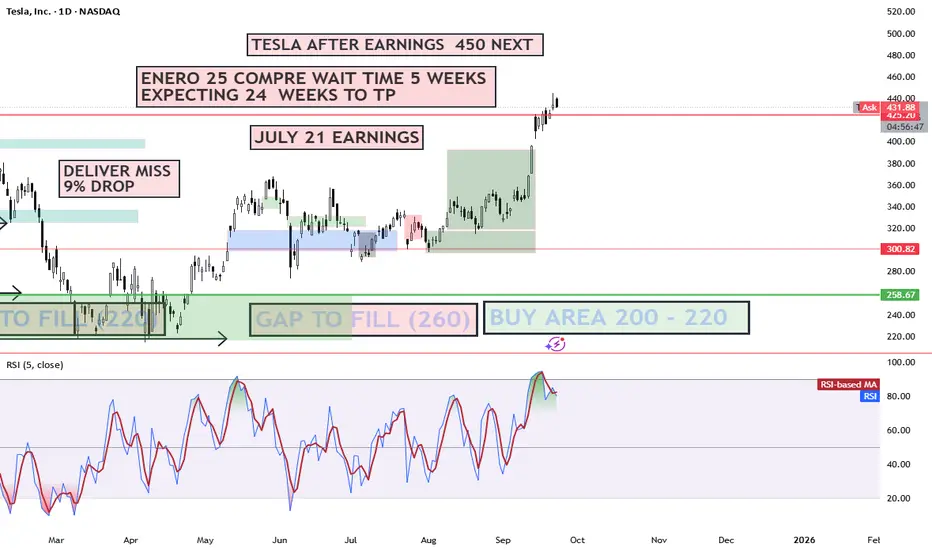
TESLA 500 BY EOY OR 2026 Why Tesla (TSLA) Could Hit $450 Then $500 by EOY 2025 or 2026: Key Catalysts Tesla's hovering around $315 today (as of Sept 23, 2025), down ~20% YTD amid sales dips, but the setup for a rebound to $450 (43% upside) and $500 (59% upside) is primed by execution on autonomy, EVs, and energy. Here's the bull case, blending fundamentals and forecasts:Robotaxi & FSD Rollout Momentum: Tesla's Cybercab unveil in Oct 2025 could catalyze a surge, with unsupervised Full Self-Driving (FSD) v13 hitting highways by year-end. ARK Invest's base case eyes $4,600 by 2026 (driven 60%+ by autonomy), but even conservative models like CoinCodex forecast $453 avg in 2026, with highs to $664 on ride-hailing revenue potentially adding $10T market value.
2 sources
Piper Sandler just hiked their PT, calling TSLA the "top idea" for AV investing.
EV Delivery Rebound & Affordable Models: Post-2025 sales weakness (1.8M deliveries est.), expect 2.3M+ in 2026 with Model 2 launch (~$25K EV) ramping production to 3M+ annually. This counters China/EU headwinds, recaptures 20%+ US market share, and boosts EPS to $0.49 next quarter—fueling a $450 breakout per LongForecast's Q3 2026 path.
2 sources
Morningstar sees a 2026 revival echoing 2016's Model 3 surge.
Energy Storage Boom: Megapack deployments exploding (Q2 2025: 9.4 GWh), with 50%+ YoY growth projected through 2026, diversifying revenue to 15%+ of total. This hedges EV volatility, pushing margins to 20%+ and supporting $500 on 11% revenue growth to $130B.
Optimus Humanoid Robot Sales: External sales kick off late 2025/early 2026, targeting $20K/unit with factory pilots scaling to millions. This could add $1T+ valuation long-term, per ARK, but even modest adoption lifts sentiment to $500 by EOY 2026.
2 sources
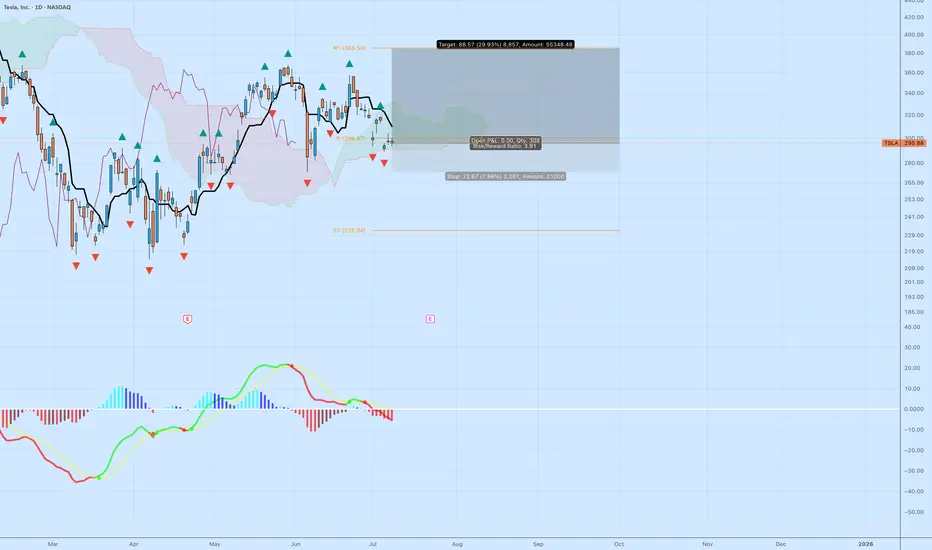
TSLA: High R/R Bounce Play Off the Cloud EdgeTesla NASDAQ:TSLA is sitting at a decision point — testing the edge of the Ichimoku cloud while momentum resets. The setup isn’t confirmed, but the risk/reward is compelling for those watching structure.
🔍 Technical Breakdown
Cloud Support: Price is holding right at the top of the cloud. A breakdown would signal trend weakness, but for now, it's a potential bounce zone.
MACD: Momentum has cooled off, but no bullish crossover yet. Early signs of a flattening histogram could suggest a pivot.
Structure: Horizontal support near $292–295 has held multiple times. If this zone holds again, the upside target opens up quickly.
🎯 Trade Specs
Entry: $296.88
Target: $385.50 (+29.93%)
Stop: $274.21 (–7.66%)
Risk/Reward: 3.91 — solid asymmetry
💡 Trading Insight:
This isn’t about calling bottoms — it’s about defining risk. When price compresses at known support, and you’ve got a 3.9 R/R profile, you don’t need to be right often to be profitable.
Bullish and Bearish Macro wave patternsThis chart provides a bullish and bearish wave pattern for Tesla. Even though the recent move was very impulsive, both bullish and bearish scenarios are equally possible. This is because the impulsive move seems to be wave C of either X wave or ending diagonal (E of ABCDE).
White represents Bullish scenario and Yellow represents bearish scenario.
Minimum Target reached for the C wave.
Note
**Disclaimer** : All details shared here is for educational purpose only. Please do your own research and consider appropriate risk management before making short term or long-term investment decisions.
Approach Market always with probabilities and make sure risk management in place.
Request your support by like, comment and follow
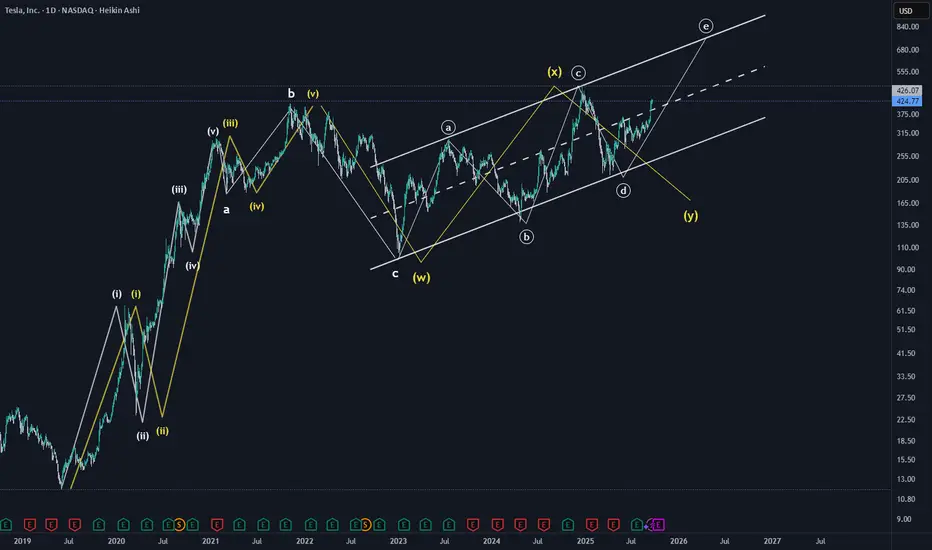
Ok TSLA.... holding or pullback?TSLA rocked & today it printed a dark cloud candle. Pullback perhaps?
Tesla typically can rally when things look bleak for the rest of the market. However, after that billion dollar move up, maybe we have a pull back before earnings. Or will we range?
<420/420 maybe retest the gap?
That's what I'm looking for.
