How To Trade NEW ALTS - SECRET PATTERN !!New Alts - a Pattern
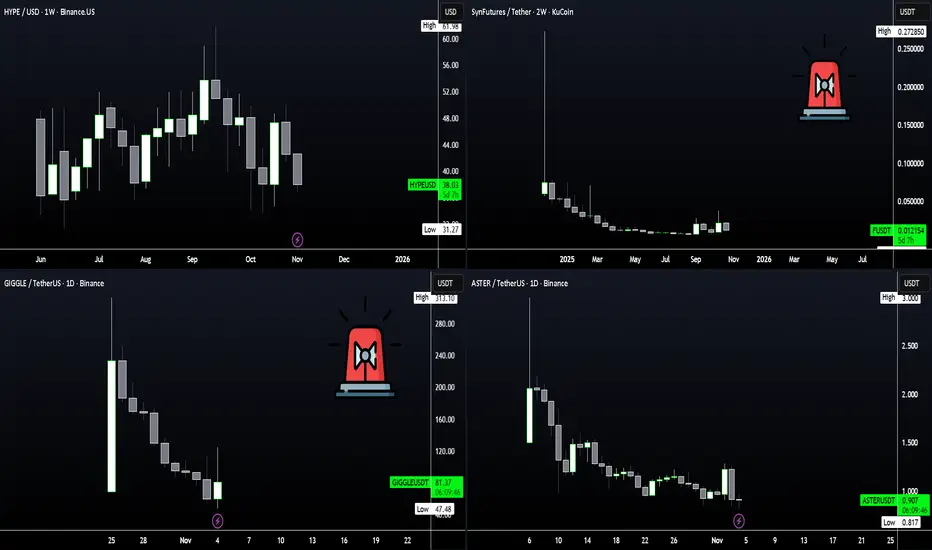
Newly released alts all seem to follow the same pattern, at least for the first few weeks. From the frontpage chart, you'll notice a very interesting "fractal" if we can call it that.
It goes something like this:
🚀 Opening Candle 💥 Top Out 👇 Hard Drop ❕ Re-enters opening pric
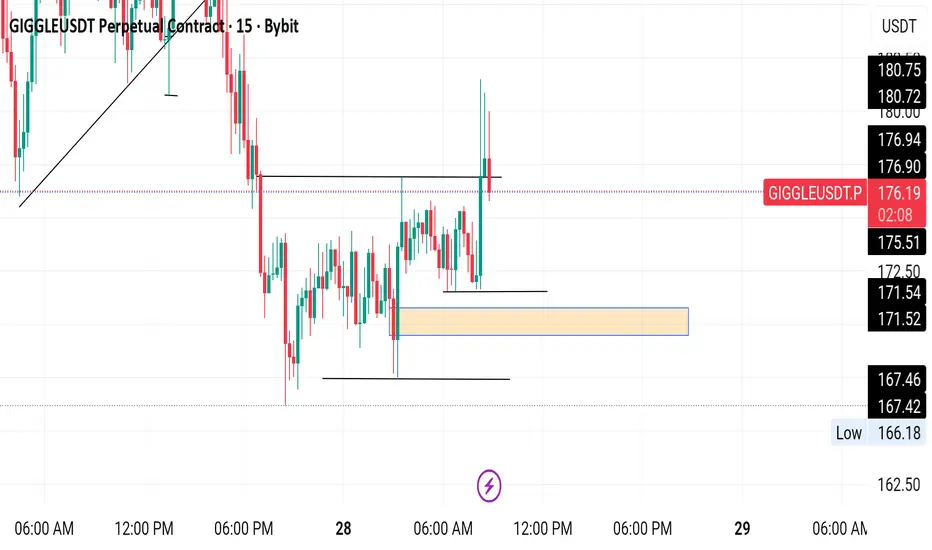
GIGGLE Detail Shorts UPDATE ,Anything above $170 is good shortGIGGLE Detail Shorts UPDATE ,
Anything above $170 is good short
Targeting $130 or Below
Resistance Ahead
Support level $125-130
Not a Financial advice

GIGGLEUSDT UPDATE#GIGGLE
UPDATE
GIGGLE Technical Setup
Pattern: Falling Wedge Pattern
Current Price: $0.000000369
Target Price: $0.000000603, $0.000000797
Target % Gain: 70.20%
Technical Analysis: GIGGLE is breaking out of a falling wedge pattern on the 1D chart, indicating bullish potential. The price has rece

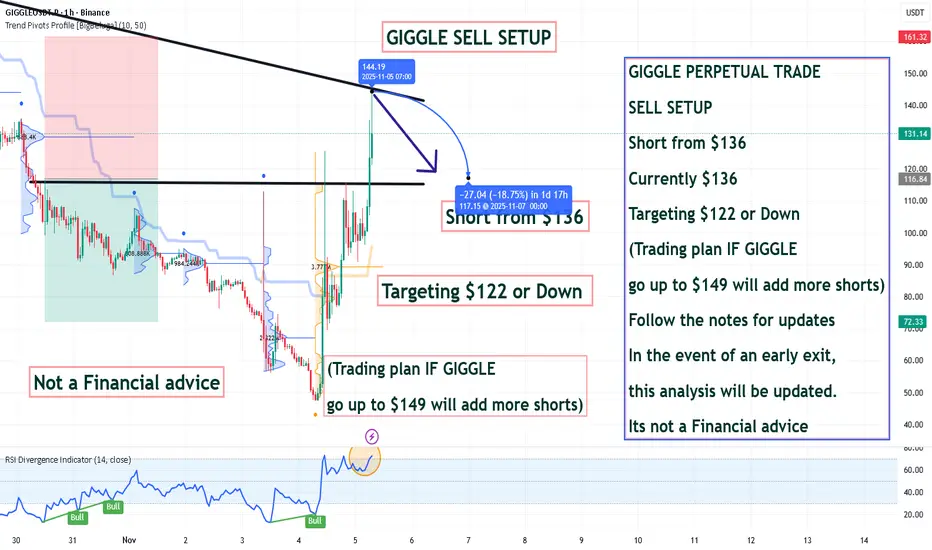
GIGGLE PERPETUAL TRADE SELL SETUP Short from $136GIGGLE PERPETUAL TRADE
SELL SETUP
Short from $136
Currently $136
Targeting $122 or Down
(Trading plan IF GIGGLE
go up to $149 will add more shorts)
Follow the notes for updates
In the event of an early exit,
this analysis will be updated.
Its not a Financial advice
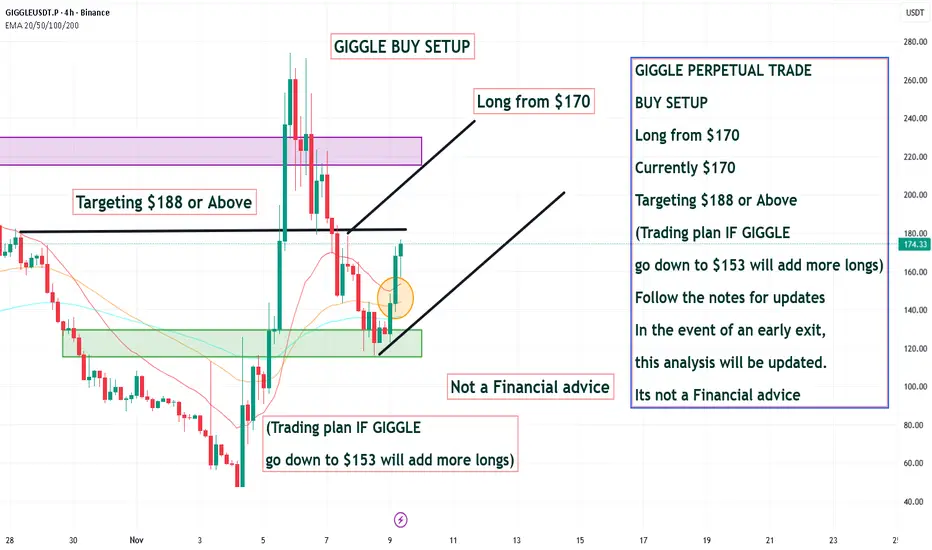
GIGGLE PERPETUAL TRADE BUY SETUP Long from $170GIGGLE PERPETUAL TRADE
BUY SETUP
Long from $170
Currently $170
Targeting $188 or Above
(Trading plan IF GIGGLE
go down to $153 will add more longs)
Follow the notes for updates
In the event of an early exit,
this analysis will be updated.
Its not a Financial advice
Giggle bullish idea - followupFollowing up on my previous giggle chart, this is a bullish scenario for Giggle provided BTC finds a base somewhere soonish, and giggle price does not fall through this support.
Maybe some sideways consolidation first, with a final test on Friday.
Invalidation is price falling through support.
Pr

GIGGLEUSDT UPDATE#GIGGLE
UPDATE
GIGGLE Technical Setup
Pattern: Falling Wedge Pattern
Current Price: $0.000000369
Target Price: $0.000000603, $0.000000797
Target % Gain: 70.20%
Technical Analysis: GIGGLE is breaking out of a falling wedge pattern on the 1D chart, indicating bullish potential. The price has rece

Triple divergence (classic, hidden bullish and time) | Fractal📈 Triple Divergence | Bullish Setup
There is an order hidden within every chaos.
Here, a triple divergence — classic, hidden bullish, and time-based — has formed.
When the fractal structures confirm the setup, the probability of a strong reversal rises above 98%.
⚙️ Analysis based on Price Action

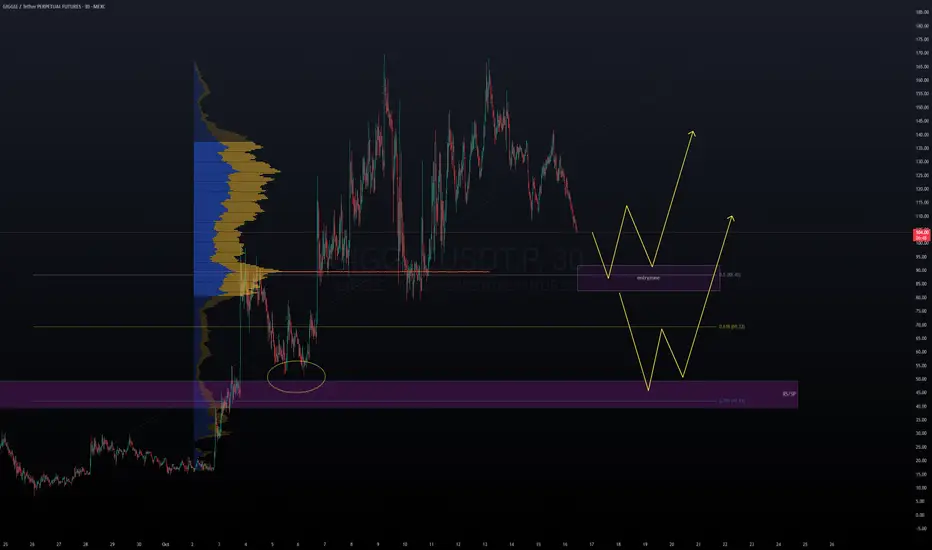
Giggle chart pattern and potential bounceLooking at the Giggle chart, expecting retrace at least to the 0.5 level. Note, could wick down to take liquidity just under the 0.5.
2nd scenario, is price has a bit of a pause at 0.5 but continues down to the FVP below which was previously filled around 53 (circled).
Watching for appropriate r
POTENTIAL BULLISH On the 5min tf Fvg left after price moved up during Asia session,London session broke Asia high to Induce buyers I want to see Asia's internal low swept and a reaction at the 5min fvg before taking longs to yesterday's new York high ,risky trade due to gap below NFA
See all ideas
Summarizing what the indicators are suggesting.
Oscillators
Neutral
SellBuy
Strong sellStrong buy
Strong sellSellNeutralBuyStrong buy
Oscillators
Neutral
SellBuy
Strong sellStrong buy
Strong sellSellNeutralBuyStrong buy
Summary
Neutral
SellBuy
Strong sellStrong buy
Strong sellSellNeutralBuyStrong buy
Summary
Neutral
SellBuy
Strong sellStrong buy
Strong sellSellNeutralBuyStrong buy
Summary
Neutral
SellBuy
Strong sellStrong buy
Strong sellSellNeutralBuyStrong buy
Moving Averages
Neutral
SellBuy
Strong sellStrong buy
Strong sellSellNeutralBuyStrong buy
Moving Averages
Neutral
SellBuy
Strong sellStrong buy
Strong sellSellNeutralBuyStrong buy