GMT/USDT — Descending Triangle: Breakout or Breakdown?📝 Market Overview:
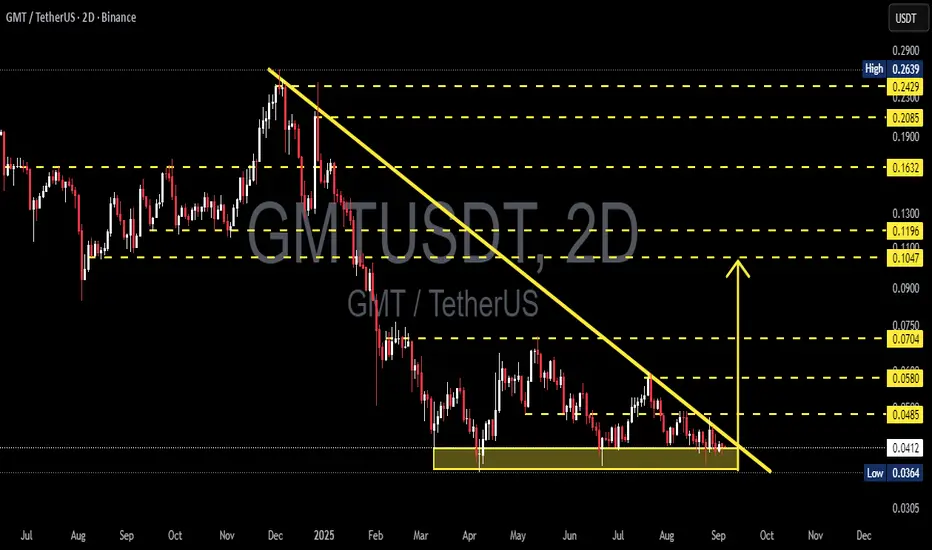
Since the early 2025 peak, GMT has been in a clear downtrend, consistently forming lower highs along the descending trendline (yellow).
Price is now consolidating within a major support zone at 0.0364 – 0.0413, which has been tested multiple times.
The structure forms a Descend
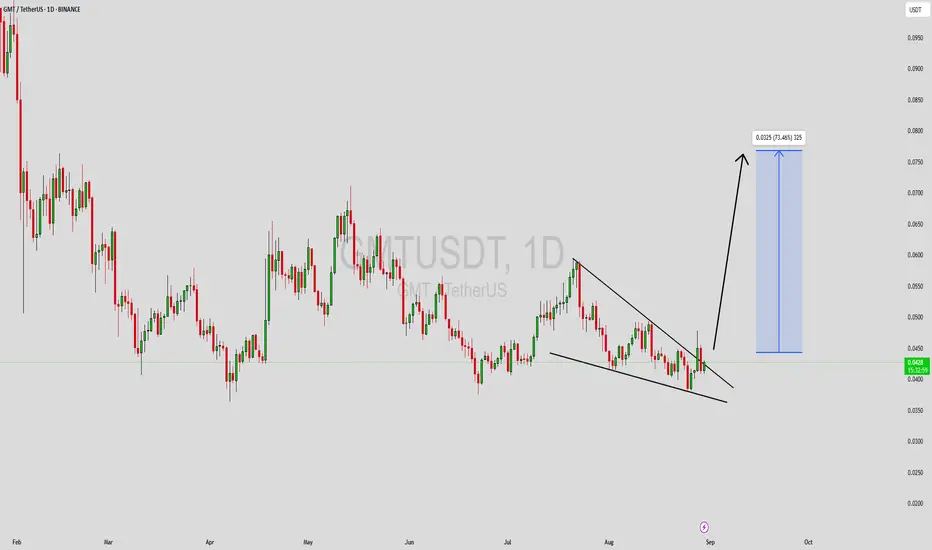
GMTUSDT Forming Bullish WaveGMTUSDT is showing signs of strength as the price structure forms a bullish breakout setup. The chart indicates that after a prolonged period of consolidation, the pair is attempting to push higher, supported by good trading volume. This increase in buying activity highlights that market participant
GMT/USDT Breakout Alert! Major Downtrend Broken🔻 End of a Long-Term Downtrend?
GMT has been in a strong downtrend since late 2024. A clearly defined descending trendline has acted as strong resistance—until now. The price has bounced from the major support zone between $0.0364 and $0.0425, which has held multiple times since March 2025.
🚀 Break

GMTUSDT 1D AnalysisGMT ~ 1D Analysis
#GMT Buy back gradually from here if you still have confidence in this coin with a short term target of at least 15%+ from here.

forsah GMTFirst-class forsah based on the conditions of the forsah Indicator by Technical Analyst Abu Hammam 🚀📈🔥
GMTUSDT 1D AnalysisGMT ~ 1D Analysis
#GMT Buy gradually from here if you still have confidence in this coin with a short term target of at least 10%++ from here.

GMT New Update (The bullish wave is continuing) 12HThis analysis is an update of the analysis you see in the "Related publications" section
The previous setup is canceled due to the risk of being left behind.
The wave structure has been reanalyzed. It appears that GMT is in a large corrective pattern, likely a diametric, and wave F has completed.

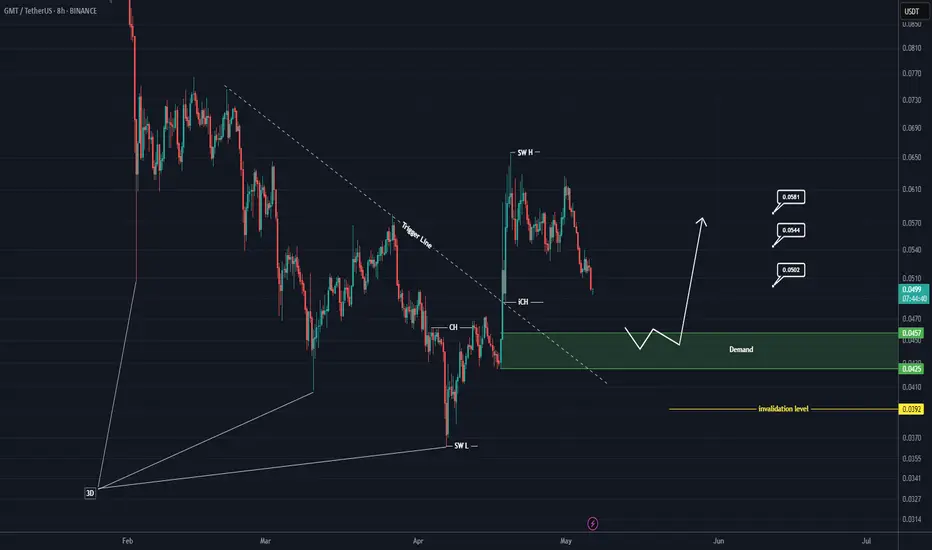
GMT Rebuy Setup (8H)Given the broken 3D pattern at the bottom and the trendline break, our demand zone is considered highly valuable. Therefore, we will look to enter a buy position within the green zone, which has been the origin of a strong move.
The price is currently in a support zone, but we will only enter a pos
GMT Daily Analysis | Bearish Continuation Toward Key Support👀 Welcome to my Trading View Analysis and Trading Channel Here , we share the latest market analysis, trading signals, and key insights together .
Ready for smarter trades ? ⭐️
🧠 Technical Analysis of GMT Coin – Daily Timeframe
This analysis reviews the recent price behavior of GMT coin on the d

GMT Buy breakoutSuccessfully penetrating this resistant line with a short -term target of at least 10%+ from here.

See all ideas
Summarizing what the indicators are suggesting.
Oscillators
Neutral
SellBuy
Strong sellStrong buy
Strong sellSellNeutralBuyStrong buy
Oscillators
Neutral
SellBuy
Strong sellStrong buy
Strong sellSellNeutralBuyStrong buy
Summary
Neutral
SellBuy
Strong sellStrong buy
Strong sellSellNeutralBuyStrong buy
Summary
Neutral
SellBuy
Strong sellStrong buy
Strong sellSellNeutralBuyStrong buy
Summary
Neutral
SellBuy
Strong sellStrong buy
Strong sellSellNeutralBuyStrong buy
Moving Averages
Neutral
SellBuy
Strong sellStrong buy
Strong sellSellNeutralBuyStrong buy
Moving Averages
Neutral
SellBuy
Strong sellStrong buy
Strong sellSellNeutralBuyStrong buy
Displays a symbol's price movements over previous years to identify recurring trends.
Curated watchlists where GMTUSDT.P is featured.

Metaverse tokens: VR crypto for a VR world
21 No. of Symbols
See all sparks