first 2x swing trade on Godfrey Phillipsbeen 6 months + counting . I had been holding this trade from 4460 until 10215.
Next report date
—
Report period
—
EPS estimate
—
Revenue estimate
—
76.90 INR
10.72 B INR
55.99 B INR
41.29 M
About Godfrey Phillips India Ltd.
Sector
Industry
Website
Headquarters
New Delhi
Founded
1936
ISIN
INE260B01028
FIGI
BBG000CRPMG3
Godfrey Phillips India Ltd. operates as a holding company. It engages in the manufacture and marketing of tobacco related products. The firm operates through the following segments: Cigarette, Tobacco and Related Products, and Retail and Related Products. Its cigarette brands include Marlboro, Red & White, Cavanders, Four Square, Stellar, and North Pole and Tipper. The company was founded on December 3, 1936 and is headquartered in New Delhi, India.
Related stocks

Review and Intraday set up for 5th August 2025Nifty future and banknifty future analysis and intraday plan.
Quarterly results.
This video is for information/education purpose only. you are 100% responsible for any actions you take by reading/viewing this post.
please consult your financial advisor before taking any action.
----Vinaykumar

Godfrey philipsGodfrey making a good structure, potentially cn mk a new high. Good positional set up.

GODFRY PHILLIPS (GODFRYPHLP) BREAKOUT:Pattern Formation: Clear W-shaped double-bottom structure indicating a bullish reversal.
Breakout Confirmation: Price breaks above the neckline resistance with strong volume.
Retest Zone: Possible retest of breakout level before further upside.
Target Levels: Measure the height of the W and project

GODFRYPHLPwent up in good speed, might be retracing , any bullish sign on daily tf near trendline is good place to take it again

Godfrey Phillips India – Major Breakout in Progress! 📌 Technical Breakdown & Swing/Positional Trade Idea
Godfrey Phillips India is currently breaking out of a 150-day broadening pattern, signalling strong bullish intent with increasing volume participation. Let’s break it down:
Key Levels & Market Structure:
Monthly Resistance Breakout (Yellow

Breakout Alert: GODFRY PHILLIPS🚀 Breakout Alert: GODFRY PHILLIPS 🚀
GODFRYPHLP has given a strong breakout, indicating bullish momentum. Keep this stock on your watchlist for potential upside movement.
🔹 Key Levels to Watch:
✅ Breakout Confirmation with strong volume
✅ Technical Strength supporting further upside
Stay tuned for

#GODFRYPHLP Price Action Update ---TheBarBellTrader📊 Price Action Update: GODFRYPHLP
TheBarBellTrader
🔍 Stock Analysis
Price from ATH: The stock is trending down from its All-Time High (ATH).
Key Observations:
Oct 22 & 23, 2024: Second Demand Zone (DZ) was broken, confirming a daily downtrend.
Post-October: WSZ action at the 125-minute time fr

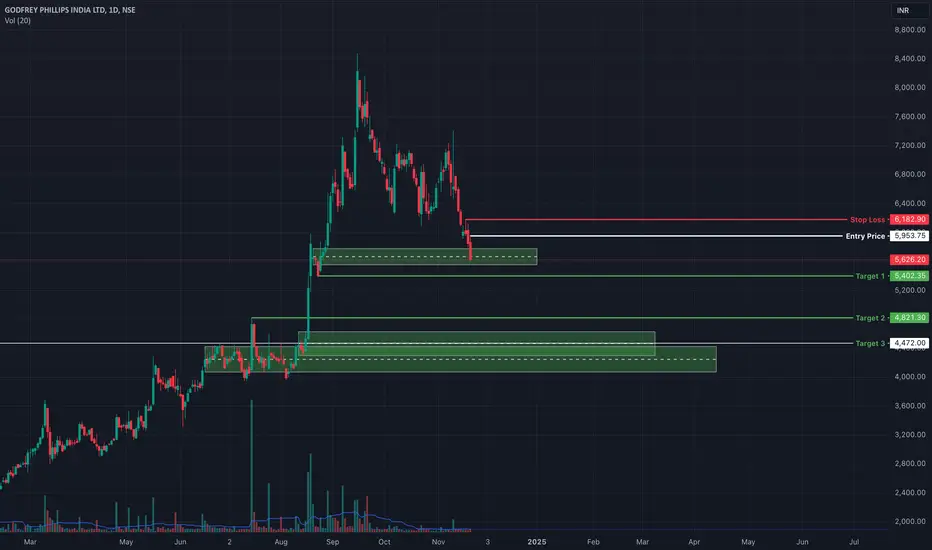
Godrey Philips : ShortVery good setup here. It has made kind of double top in weekly time frame.
You can even short at current levels if you could optimize SL using swing high in hourly time frame. Even if it is not FnO it is good excercise to observe price with paper trade.
Godfry Very good breakout of the falling pattern and with that can take a trade and make a target of ath and keeping below support level as a SL as earning are on head

See all ideas
Summarizing what the indicators are suggesting.
Oscillators
Neutral
SellBuy
Strong sellStrong buy
Strong sellSellNeutralBuyStrong buy
Oscillators
Neutral
SellBuy
Strong sellStrong buy
Strong sellSellNeutralBuyStrong buy
Summary
Neutral
SellBuy
Strong sellStrong buy
Strong sellSellNeutralBuyStrong buy
Summary
Neutral
SellBuy
Strong sellStrong buy
Strong sellSellNeutralBuyStrong buy
Summary
Neutral
SellBuy
Strong sellStrong buy
Strong sellSellNeutralBuyStrong buy
Moving Averages
Neutral
SellBuy
Strong sellStrong buy
Strong sellSellNeutralBuyStrong buy
Moving Averages
Neutral
SellBuy
Strong sellStrong buy
Strong sellSellNeutralBuyStrong buy
Displays a symbol's price movements over previous years to identify recurring trends.
SMALLCAP
Mirae Asset Nifty Smallcap 250 Momentum Quality 100 ETF Units Exchange Traded FundWeight
2.75%
Market value
2.13 M
USD
Explore more ETFs
Frequently Asked Questions
The current price of GODFRYPHLP is 3,411.70 INR — it has increased by 2.90% in the past 24 hours. Watch Godfrey Phillips India Ltd. stock price performance more closely on the chart.
Depending on the exchange, the stock ticker may vary. For instance, on NSE exchange Godfrey Phillips India Ltd. stocks are traded under the ticker GODFRYPHLP.
GODFRYPHLP stock has risen by 2.81% compared to the previous week, the month change is a −7.12% fall, over the last year Godfrey Phillips India Ltd. has showed a 44.14% increase.
GODFRYPHLP reached its all-time high on Sep 16, 2025 with the price of 3,947.00 INR, and its all-time low was 15.60 INR and was reached on Sep 17, 2001. View more price dynamics on GODFRYPHLP chart.
See other stocks reaching their highest and lowest prices.
See other stocks reaching their highest and lowest prices.
GODFRYPHLP stock is 4.28% volatile and has beta coefficient of 1.49. Track Godfrey Phillips India Ltd. stock price on the chart and check out the list of the most volatile stocks — is Godfrey Phillips India Ltd. there?
Today Godfrey Phillips India Ltd. has the market capitalization of 517.86 B, it has increased by 2.13% over the last week.
Yes, you can track Godfrey Phillips India Ltd. financials in yearly and quarterly reports right on TradingView.
Godfrey Phillips India Ltd. is going to release the next earnings report on Nov 12, 2025. Keep track of upcoming events with our Earnings Calendar.
GODFRYPHLP net income for the last quarter is 3.56 B INR, while the quarter before that showed 2.79 B INR of net income which accounts for 27.58% change. Track more Godfrey Phillips India Ltd. financial stats to get the full picture.
Godfrey Phillips India Ltd. dividend yield was 1.40% in 2024, and payout ratio reached 45.94%. The year before the numbers were 1.81% and 32.97% correspondingly. See high-dividend stocks and find more opportunities for your portfolio.
As of Oct 17, 2025, the company has 1.08 K employees. See our rating of the largest employees — is Godfrey Phillips India Ltd. on this list?
EBITDA measures a company's operating performance, its growth signifies an improvement in the efficiency of a company. Godfrey Phillips India Ltd. EBITDA is 12.37 B INR, and current EBITDA margin is 21.31%. See more stats in Godfrey Phillips India Ltd. financial statements.
Like other stocks, GODFRYPHLP shares are traded on stock exchanges, e.g. Nasdaq, Nyse, Euronext, and the easiest way to buy them is through an online stock broker. To do this, you need to open an account and follow a broker's procedures, then start trading. You can trade Godfrey Phillips India Ltd. stock right from TradingView charts — choose your broker and connect to your account.
Investing in stocks requires a comprehensive research: you should carefully study all the available data, e.g. company's financials, related news, and its technical analysis. So Godfrey Phillips India Ltd. technincal analysis shows the buy rating today, and its 1 week rating is buy. Since market conditions are prone to changes, it's worth looking a bit further into the future — according to the 1 month rating Godfrey Phillips India Ltd. stock shows the buy signal. See more of Godfrey Phillips India Ltd. technicals for a more comprehensive analysis.
If you're still not sure, try looking for inspiration in our curated watchlists.
If you're still not sure, try looking for inspiration in our curated watchlists.