XAUUSD – Gold Eyes a Breakout Above $4,030: Momentum Still Build🟢 XAUUSD | Gold Breakout Setup – Educational Analysis
Gold continues to show constructive price action following sustained bullish momentum across intraday timeframes. After a healthy consolidation phase, the market is now testing a critical resistance zone around $4,030.
A clean breakout and confirmed 1H close above $4,030 would signal renewed strength, aligning with the broader bullish structure observed on higher timeframes (4H & Daily).
🔹 Technical Outlook
The current structure suggests the potential for continuation toward higher liquidity zones if the breakout holds.
Sustained trading above $4,030 would confirm buyer control, invalidating the short-term correction phase.
📈 Trade Plan (Educational Setup)
Entry (Buy Stop): $4,030
Stop Loss (SL): $4,000
Take Profit Targets (TP):
TP1 → $4,060
TP2 → $4,090
TP3 → $4,120
TP4 → $4,150
TP5 → $4,180
TP6 → $4,210
💡 Analyst’s Commentary
This setup aims to capture the potential breakout continuation, with risk contained below the $4,000 psychological support.
Momentum confirmation on H1 and H4 closes will be key for trade validation.
Traders may consider partial profit-taking along the way and trailing stops to secure gains.
⚖️ Risk/Reward: ≈ 1 : 3.5
🕓 Timeframe: H1 – Short-Term Swing
⚠️ Disclaimer:
This analysis is shared for educational and research purposes only as part of Middle East Trading Academy’s ongoing market study.
It does not constitute financial advice or an investment recommendation.
Trade ideas

$GOLD is COOKED! Rotation into $BTC Soon!!MARKETS ARE SIGNALING RISK-ON 🔥
TVC:GOLD is so unbelievably COOKED 👨🍳
3 Black Crowes printed on the Daily, with a decisive close below the 20MA 🗡️
Waiting on the final nail in the coffin to close below the DANGER ZONE ~$3,900 where we will then see GOLD retest the 50MA along with the 50% Gann retrace $~3,750 ⚠️
I very much expect the rotation into CRYPTOCAP:BTC soon 👑

Gold Intraday Trading Plan 10/28/2025Gold being very naughty yesterday has just broken 4000, which is a very strong support. I am expecting it continue to drop today. I will look to sell from 4000. My first target is 3950 and ultimate target for today is 3850.

LiamTrading - XAUUSD: SCENARIO BEFORE FOMC LiamTrading - XAUUSD: SCENARIO BEFORE FOMC - $3840 Level Awaits Bottom Fishing Reaction Wave
Hello traders community,
The Gold market is showing a strong and sustainable downtrend. We are witnessing a crash after prices broke through key support zones. With the upcoming FOMC event, our strategy is to seek Buy opportunities at deep liquidity zones and continue Selling when prices recover to retest the broken trend.
📰 MACRO ANALYSIS & CASH FLOW CONTEXT
Gold is currently under dual pressure:
Downward Pressure 🔴: Optimism about the US-China trade progress has significantly weakened the demand for Gold, a safe-haven commodity. Spot Gold prices have fallen below $3950, hitting a three-week low, down about 0.78% on the day (28/10).
Short-term Support 🟢: Bets on the possibility of a Fed rate cut continue to weaken the US Dollar (USD), which is the only factor that could potentially support this precious metal.
Conclusion: This tug-of-war makes it difficult to determine the bottom. The bearish scenario remains the top priority.
📊 TECHNICAL ANALYSIS: THE DOWNWAVE CONTINUES
Based on the H4 chart (image_5fa7fa.png):
Current Trend: The price has successfully broken through the key liquidity support zone near $3950 and is continuing its downtrend.
Current Fibonacci Level: The price is touching and reacting at the 1.618 Fibonacci zone (around $3950).
Next Level: The next level Gold is targeting will be the 2.618 Fibonacci zone (around $3840), which is a large liquidity area expected to see a strong reaction.
Main Strategy: We focus on two scenarios: Bottom fishing reaction at 3840 and continuing to Sell when the price recovers.
🎯 DETAILED TRADING PLAN (ACTION PLAN)
We have two detailed scenarios based on the current price level:
🟢 BUY Reversal Scenario
We wait for the price to hit the deep liquidity bottom zone of 3840 to execute a buy order with the expectation of a technical recovery.
Entry Zone: 3840
Stop Loss (SL): 3832 (tight SL)
Take Profit Targets (TP): TP1: $3872 | TP2: $3898 | TP3: $3925 | TP4: $3950
🔴 SELL Retest Scenario
If Gold recovers without breaking the downtrend structure:
Entry Zone: Watch for a Sell retest at $4091
Stop Loss (SL): $4099
Take Profit Targets (TP): TP1: $4065 | TP2: $4033 | TP3: $4004 | TP4: $3965
SUMMARY & DISCIPLINE (Steven's Note)
Gold is in a strong fall ahead of the FOMC, with significant volatility expected. Capturing deep Fibonacci and Liquidity zones is key.
Note: Always adhere to the set Stop Loss. Capital management is the number one priority, risking only 1-2% of the account per trade.
Wishing traders a successful and disciplined new trading week!

n' Nothin but airas you all know gold has just started a long term bullish movement and i believe the main target is 2500 $
soon will touch this area
regards

Update before New York sessLet's see how it goes.
Price break the support zone, turning it into a resistance zone.
Expecting a retracement before potential drop during the New York session.
Or eventually breaking resistance and pushing further up.
Stay tuned for next update.
@TeamWeprint

Gold/Copper Signaling Recession & Market Super bubble!We're continuing to see extreme signals from Gold, and that should raise concerns.
Earlier, I highlighted the Gold/Oil ratio — now, I want to draw your attention to the Gold/Copper ratio:
🔗
Historically, such extreme readings in the Gold/Copper ratio have consistently preceded recessions. The only exception? A period of economic stagnation and sideways markets — not exactly a bullish outcome. See the chart from 2014 to 2016
🔗 www.tradingview.com
Quick recap:
Gold = Fear + Inflation hedge
Copper = Economic strength + Inflation signal
Oil = Similar to Copper; reflects growth and inflation expectations
These divergences aren't random — they’re warning signs of a recession & market Super Bubble that's about to POP!
These are not random fluctuations of prices. You can choose to view them as such. I get it. But from a macroeconomic perspective, this is bad JUJU!
Capitalism without failure is like religion without hell! Remember that!
Click boost, like, and subscribe! Let's get to 5,000 followers! ))

GOLDThe era of cheap gold ends
From 1919 to 2015, the price of gold due to Gold Fixing. The price was set by London Gold Market Fixing Limited. On March 20, 2015 fixing ceased to be installed according to the old methodology and was replaced by electronic auctions LBMA Gold Price.
Initially, the "golden five" consisted of the following companies
1.N M Rothschild & Sons
2.Mocatta & Goldsmid
3.Pixley & Abell
4.Samuel Montagu & Co
5.Sharps Wilkins
What now?
Thirteen market participants are accredited to participate in LBMA Gold Price trading:
Bank of China
Bank of Communications
China Construction Bank
Goldman Sachs International
HSBC Bank USA NA
ICBC Standard Bank
JPMorgan Chase
Morgan Stanley
Société Générale
Standard Chartered
The Bank of Nova Scotia - ScotiaMocatta
The Toronto Dominion Bank
UBS
These banks all belong to the same families.
Most of the gold has already been bought and there is no point in keeping it at this level.
In a period of instability, investors will seek refuge for their assets. And gold will not be a bad refuge for long term.
WE WILL BE GOLD BEFORE THE PORN, WHILE GOLDEN IDEOLOGISTS WILL EXIST . Rothschild's

Xauusd Bullish SetupThis Gold (XAU/USD) analysis presents a bullish setup on the 30-minute chart. The price is expected to rebound from the support zone around 4097, where a buy limit trade is placed. The stop loss is positioned at 4046 to manage downside risk. The analysis targets an upward move towards 4165 (first take profit), 4227 (second take profit), and a final target at 4318, indicating strong potential for a recovery and continuation of the uptrend.

GOLD HIGH PROBABILITY SETUP SOON!!! 🚨 XAUUSD HIGH PROBABILITY BUY SETUP 🚨
* Here We Can See Clearly The Next Potential Moves For GOLD Coming Hours/Days.
* Keep Your Eyes Close On Your Trading Positions.
* Happy PIP Hunting Traders.
FXKILLA.

#XAUUSD: Two Entries, Three Targets, Swing Sell! Gold dropped to 3883 region, the lowest point in the last two months. Since then, it has started rebounding. Currently, the price is approaching a very important key level, which could lead to a smooth reversal. However, market conditions will be extremely volatile, making it difficult to predict any move. This is because we have the NFP coming up. Due to this volatility, both of these entry points are equally possible.
Once either entry is confirmed, you should place a target based on your risk management and trade planning. Remember, this is not a confirmation, and the price could go in the opposite direction. Please do your own analysis before making any financial decisions.
We are here to help. If you have any questions related to this analysis or any trading matter, please drop a comment. We will do our best to help you out. If you want to support us, please like and comment on the idea.
Team Setupsfx_

Gold ready for another spike 4380Gold (XAU/USD) is holding above the support trend line, showing potential for a bullish rebound. As long as price stays above the 4,220 support area, it may target the next resistance near 4,380.

Gold ready for retest ath 4380Gold (XAU/USD) showing bullish reaction from the support trendline. The circled candle indicates buyer strength, suggesting a possible recovery toward 4279–4380 resistance levels.
Support Trend Line:
Shows long-term bullish structure — price respecting the ascending trendline.
Support Zone (4181 – 4253):
Key demand area where buyers are stepping in to defend the trend.
4279 Level:
Immediate resistance; a breakout above could confirm short-term bullish momentum.
4313 Level:
Next resistance target after 4279; possible area for partial profit-taking.
4380 Level (ATH Retest):
Major resistance zone — potential final target if bullish move continues.
Indicates buyer reaction at the trendline, signaling possible reversal toward 4279.

Gold 1H – Bullish Rebound After Strong Correction🟡 XAUUSD – Intraday Trading Plan | by Ryan_TitanTrader
📈 Market Context
Gold is attempting to rebound near $4,320 after a sharp correction earlier this week, as traders weigh the recent pullback in U.S. Treasury yields and renewed expectations of a dovish Federal Reserve tone.
Markets are now positioning ahead of key U.S. housing and manufacturing data, which could shape short-term sentiment for both the dollar and real yields.
• Softer economic numbers may reinforce the case for policy easing in early 2026, supporting gold’s safe-haven appeal.
• Conversely, stronger data could momentarily pressure XAUUSD, yet the broader uptrend remains intact amid central-bank accumulation and geopolitical tension.
Expect a liquidity-driven environment, with price potentially sweeping lower before reclaiming bullish momentum.
🔎 Technical Analysis (1H / SMC Style)
• Structure: Overall bias remains bullish following consecutive Breaks of Structure (BOS) and a confirmed Change of Character (ChoCH) indicating corrective retracement.
• Discount Zone: The $4,270–$4,272 demand area sits within the discount zone of the recent range (swing low to 4454 high), ideal for re-accumulation.
• Liquidity Sweep: Recent wicks near $4,300 suggest liquidity has been collected, potentially setting up for another bullish push.
• Premium Zone: Upside liquidity clusters near $4,454–$4,452, aligning with a premium supply area where short-term selling may appear.
🔴 Sell Setup
• Entry: 4454 – 4452
• Stop-Loss: 4463
• Take-Profit Targets: 4400 → 4330
🟢 Buy Setup
• Entry: 4270 – 4272
• Stop-Loss: 4260
• Take-Profit Targets: 4340 → 4380 → 4450 +
⚠️ Risk Management Notes
• Wait for M15 BOS/ChoCH confirmation before triggering entries.
• Avoid entries during high-volatility windows around U.S. data releases.
• Secure partial profits near intermediate liquidity zones, trail stops after BOS confirmation.
✅ Summary
Gold maintains a bullish re-accumulation structure following a healthy correction.
A retest into the discount zone around $4,270 offers potential long entries targeting the premium zone near $4,450+.
Only a decisive break below $4,260 would invalidate the intraday bullish scenario.
FOLLOW RYAN_TITANTRADER for more SMC trading insights ⚡

THE KOG REPORT - UpdateEnd of day update from us here at KOG:
Yesterday we shared the hot spots together with the levels which as you can see worked well paired with the red box holding price down to play the range.
Now, with buyers starting to lose faith and start hedging longs from above, we need some more confidence in the up move in our opinion. For that reason, we will say that the baseline here sits are 4030 and above that level we may be looking at the 4070-74 level initially. We need to form a swing here to at least meet the voids.
Price: 4089
RED BOXES:
Break above 4095 for 4110, 4125 and 4140 in extension of the move
Break below 4082 for 4064✅, 4050✅ and 4020✅ in extension of the move
As always, trade safe.
KOG

XAU/USD Completing Wave Y: Final Dip Before RallyGold has completed its major 5-wave rise and is now finishing a corrective W-X-Y pattern. The recent drop looks like the final leg of this correction, meaning sellers are getting weaker. Price may show a small bounce up and then one last dip to complete the correction. After that final drop, a strong new uptrend is expected to start again. In short: correction ending soon, last dip big bullish move ahead.
Stay tuned!
@Money_Dictators
Thank you :)

XAUUSD: Final Dip Before RallyGold has completed its major 5-wave rise and is now finishing a corrective W-X-Y pattern. The recent drop looks like the final leg of this correction, meaning sellers are getting weaker. Price may show a small bounce up and then one last dip to complete the correction. After that final drop, a strong new uptrend is expected to start again. In short: correction ending soon, last dip big bullish move ahead.

Gold is Targeting #5,100.80 benchmark / Medium-termGold's Short-term: Gold reached my personal maximum (regarding Short-term of course) of almost invalidating #4,400.80 benchmark / both Short and Medium-term Buyers / investors started taking Profits and as Naturally, asset cannot only Trade in one direction, Gold dipped creating aggressive Descending Channel and is now testing the Lower Low’s pressure point. However, #4,000.80 is very strong Support zone for the fractal which won't be invalidated without serious cause and even with Short-term development (due current decline) Investors drawing capital from Gold to more riskier assets - I doubt Gold has more potential to go Lower below my Support zones on the chart regarding Short-term. The current Selling accumulation pattern on Hourly 4 chart is now on total Neutrality but attempting to break towards last week’s Lower Low's. Current Fed loan climate is Gold friendly as Gold often demonstrates resilience during early phases of Fed tightening cycles before investment flows adjust to Higher Rates. If Rates go down more aggressively, Gold will soar more (another reason why I am Bullish on Gold).
#MA50 and #MA200 observation: Keep both lines on your Weekly (#1W) chart, as they are pointers for Long-term. As Long as Gold is Trading above them, Bullish Long-term stance remains and Gold will Target upper levels.
Fundamental commentary: Gold was Trading on #1,800.80 on mid-October #2023 Year, and currently tested #4,400.80 benchmark which records one of the most aggressive rises of Gold in history. It was up almost (# +65.00%) lately / when confidence in financial system is on a decline (which is the case in current and last few Years), Gold is soaring as hedge. U.S. Dollar just had one of its weakest first halves in #50 Years, down more than (# -10.00%) against other major currencies. Massive debt (# 315 trillion globally), rising government spending and tariff regulation and impact on the markets have shaken confidence in the system world-wide. When U.S. Dollar weakens, Investors are in search of asset that feels more stable to store their money / it is always one and almost only option - Gold. In addition, Central banks have been Buying Gold in bulk / over #1,000 tons annually for the past #3-Year fractal, most since #1,967 Year which is not surprise or weird / something is going on. Part of that started with Middle East conflict escalation #2,023 Year, U.S. freezing #300 million Russian reserves in #2,022 Year, showcasing other countries that their Dollars can be shut off as political leverage.
Recapitulation: Segment which makes the almost (# +65.00%) increase on Gold unusual is that both Gold and Stock markets are both hitting record Highs at the same time. Institutions are still sitting on trillions in cash. Many are still not deciding to go "all in" on Stocks at these levels. Also on the contrary, they also don't want to lose to Inflation sitting on the sidelines / so they're parking most of the money in Gold as a temporary middle ground and that demand is helping push Gold Higher from big institutions, and also independent Investors world-wide. Even with all the questions and uncertainty right now, keep this in mind: Gold is used to protect wealth, not grow it. Gold usually spikes when confidence in the financial system drops, but it can dip just as fast once confidence returns. In #1,980 Year, Gold hit a record of #850.80 per ounce then dropped (# -50.00%) by #1,982 Year. After peaking at #1,920.80 in #2,011 Year, it took nearly a decade to recover and if full confidence returns, Gold may fall fast as mention above, however confidence for financial system is far from delivered or happening.
My personal thoughts: All Traders are well aware that I am well known Seller of the market however what made me triple my account, is switching to being a Bull in recent times as Trading against the trend is disastrous for a Trader. I do believe that even if Gold dips, near Lower Low's is maximum as illustrated on my chart and #5,100.80 benchmark is my next point of interest and my next Medium to Long-term Target. #6,100.80 - #6,200.80 represents Ultimate Top's for now and stabilization zone where another aggressive dip is possible, fuel only for Gold to soar further. I do believe Financial system is about to collapse even more and with ever-growing Inflation world-wide, Gold will skyrocket and I am here to Buy it / Trade it even more than ever, expecting my Targets to be met. Remember, trend is your friend and hope all of Sellers which got liquidated accounts, sending me many messages will turn their Technicals and finally start Buying Gold. Yours, goldenBear88

Gold key Levels (3800-4100)These are the Gold key levels which I’ll be using for trading.
Here’s how I trade these levels:
- Close above a level → Buy setup
When a candle closes clearly above a level, it confirms bullish momentum and I look to enter long immediately after the close.
- Close below a level → Sell setup
A confirmed candle close below support signals bearish strength, and I enter short right after the close.
- Rejection from a level → Opposite trade
If price shows a strong rejection from a level, I trade in the opposite direction - rejection from resistance = sell setup, rejection from support = buy setup.
These levels works well for both day trading (using 1H candles) and scalping (using 15M or lower timeframes). It keeps trading simple, just reactions to market behaviour.

GOLD DAILY CHART ROUTE MAP UPDATEHey everyone,
Check out our updated Daily Chart Route Map, now featuring updated levels for tracking Golds movement.
We’ve refined our proprietary Goldturn Channel, our unique method for constructing ascending channels. Price action recently broke out above the channel, with a body close above 4325, leaving a long-term gap open near 4444.
Currently, we’re observing rejection at 4325, and our channel top is now acting as support. The market is range-bound between 4325 (resistance) and 4183 (channel top as support). A decisive break above or below either of these levels will help define the next directional move, keeping in mind the open gap overhead at 4444.
On the downside, 3961 remains the pivotal swing zone, aligning with the channel midline, should we see a confirmed break below 4183.
As always, we will keep you all updated with regular updates throughout the week and how we manage the active ideas and setups. Thank you all for your likes, comments and follows, we really appreciate it!
Mr Gold
GoldViewFX

Gold weekly chart with both buy and sell entriesLast week both buy and sell levels hit for over 1000 pips each.
This will probably be my last chart for awhile as i dont think theres much intrest in this
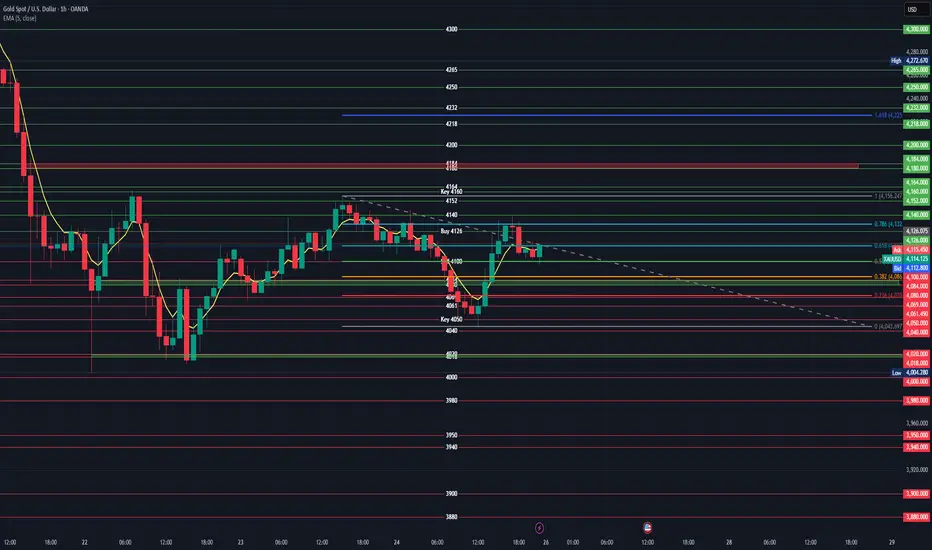
### XAUUSD 4-Hour Chart Analysis
#### **Key Levels Identified**
The chart shows critical **support/resistance zones** based on Fibonacci retracements, historical price action, and labeled key levels. Below is a breakdown of actionable buy/sell levels:
---
### **1. Buy Levels (Long Entry)**
These levels represent potential support where price may reverse upward:
- **Primary Buy Zone**: `4,126` (labeled "Buy 4126" on the chart)
- **Why?** This level aligns with the **0.236 Fibonacci retracement** of the recent swing high (4,164) to swing low (4,004). Historically, price has bounced here.
- **Entry Trigger**: Wait for bullish reversal signals (e.g., bullish engulfing candle, RSI divergence, or price closing above the 5-period EMA).
- **Stop Loss**: `4,095` (below the "Sell 4100" resistance level).
- **Take Profit**: Target `4,160` (Key 4160 resistance), then `4,180` and `4,184`.
- **Secondary Buy Zone**: `4,110–4,115` (near the 0.618 Fibonacci retracement at `4,113.253`)
- **Why?** The price is consolidating here after a dip. A hold above `4,100` (Sell 4100 level) suggests bullish momentum.
- **Stop Loss**: `4,095` (as above).
- **Take Profit**: Same as primary zone (`4,160` and beyond).
---
### **2. Sell Levels (Short Entry)**
These levels represent potential resistance where price may reverse downward:
- **Primary Sell Zone**: `4,132` (0.786 Fibonacci retracement of the swing high/low)
- **Why?** This level is a strong resistance zone where the price often reverses after a rally.
- **Entry Trigger**: Wait for bearish reversal signals (e.g., bearish pin bar, RSI divergence, or price rejecting the level).
- **Stop Loss**: `4,135` (above the resistance level).
- **Take Profit**: Target `4,099` (0.5 Fib), then `4,086` (0.382 Fib), and `4,050` (Key 4050 support).
- **Secondary Sell Zone**: `4,160` (labeled "Key 4160")
- **Why?** This is the **major swing high** (4,164) and a key psychological resistance level. A rejection here confirms a bearish trend.
- **Entry Trigger**: Price must break above `4,160` and then fail to hold (e.g., a bearish candlestick pattern at the level).
- **Stop Loss**: `4,165` (above the resistance level).
- **Take Profit**: Same as primary sell zone (`4,099` and below).
---
### **Critical Context**
- **Current Price**: `4,111.797` (EMA 5 close). This is **above support (`4,100`)** and **below resistance (`4,132`)**.
- **Trend**: Short-term downward momentum after the 4,164 high, but price is recovering from a low. Wait for confirmation of reversal.
- **Fibonacci Retracement**:
- `0.786` (4,132) and `0.618` (4,113) act as key resistance/support.
- `0.5` (4,099) and `0.382` (4,086) are stronger support levels.
- **Risk Management**:
- Always use a stop loss to limit downside risk.
- Target levels should align with the broader trend (e.g., if the trend is bearish, prioritize sell setups).
---
### **Summary of Actionable Levels**
| **Trade Type** | **Entry Level** | **Stop Loss** | **Take Profit** | **Confirmation Signal** |
|----------------|-----------------|---------------|-----------------|-------------------------|
| **Buy** | 4,126 (primary)4,110–4,115 (secondary) | 4,095 | 4,160 → 4,180 → 4,184 | Bullish reversal candle, RSI divergence |
| **Sell** | 4,132 (primary)4,160 (secondary) | 4,135 → 4,165 | 4,099 → 4,086 → 4,050 | Bearish reversal candle, RSI divergence |
> **Note**: Always validate entries with additional indicators (e.g., RSI, volume) and avoid trading during low-volume periods. The 4-hour timeframe favors medium-term trades (1–3 days), so patience is key.
Gold Hesitates Ahead of U.S. CPI — Watching the 4000 ZoneGold Hesitates Ahead of U.S. CPI — Watching the 4000 Zone
From the analysis I shared yesterday, gold reached the first target near 4152 before pulling back.
The market is currently hesitating to move further, mainly due to uncertainty around the upcoming U.S. CPI data. I’m not interpreting the data this time, as its impact on gold can be unpredictable — gold often moves independently of fundamentals.
I believe gold may rise once more toward the 4000–4060 zone, as shown on the chart. However, traders should remain cautious since the news could bring significant volatility.
Targets remain unchanged.
Keep in mind that a break below 4000 could confirm a bearish wave, potentially followed by an aggressive rebound — a classic false sell-off scenario.
You may find more details in the chart!
Thank you and Good Luck!
❤️PS: Please support with a like or comment if you find this analysis useful for your trading day❤️

gold can back to 3700 areagold can back to 3700 area then start new + wave
now i put sellstop in last low( trend line break mean can go downer) with tp= fibo 60% and sl=last high on H4
waite time= 1 week
Alert= break high is new buy signal can push gold near 5000
wish you win
