Interest Rate Decision Imminent!Key Events:
Federal Reserve Meeting: The Fed will announce its interest rate decision, with the market widely expecting a 25 basis point cut. A dovish signal from the Fed (such as hinting at further rate cuts) could boost gold prices; a cautious stance could put downward pressure on prices.
US-China Trade Situation: High-level officials from both countries have reached an agreement on a framework for a trade deal, and Trump will meet with Chinese officials today. Easing trade tensions have reduced safe-haven demand for gold, leading to a recent decline in prices.
Market Sentiment Shift: Risk appetite has increased, with major global stock indices (such as the S&P 500 and Nasdaq) hitting record highs, causing funds to flow from safe-haven assets like gold to risk assets.
Economic Data and Background:
US Economic Indicators: ADP weekly employment data showed modest growth in private sector employment (14,000 new jobs per week), but the consumer confidence index (94.6) slightly exceeded expectations. These data eased concerns about a recession, further suppressing gold prices.
Fund Flows: Gold ETF holdings decreased (e.g., SPDR holdings remained flat, iShares silver holdings declined significantly), indicating that speculative funds continued to reduce their long positions in gold, suggesting strong short-term bearish sentiment.
Long-Term Supporting Factors: Global central bank gold purchasing trends, geopolitical risks, and the Fed's interest rate cut cycle continue to support gold in the medium to long term. The London Bullion Market Association (LBMA) predicts that gold prices may rise to $4,980 in the next 12 months.
I. Price Movement Review:
Gold prices fell for three consecutive days, reaching a low of $3,886.51 on October 28, breaking below the key psychological level of $4,000, with a cumulative drop of over 10%. Technical selling and long position liquidation were the main reasons.
II. Key Technical Levels:
Support Levels:
Short-term: 3920-3900 (tested in Asian trading).
Strong Support: 3885-3880 (yesterday's low coincides with the 60-day moving average; a break below this level could lead to a test of $3,819). Resistance Levels:
Short-term: 3970-4000 (a break above could lead to 4030 USD).
Strong Resistance: 4086 (Second resistance level on the 4-hour chart).
III. Optimal Trading Strategy
Trend Judgment:
Short-term: Gold prices are suppressed by fundamentals (trade optimism + risk appetite), but the Fed decision may trigger a rebound. If gold prices stabilize above 4000, the trend will turn bullish; if they remain below 4000, a short-term top will form.
Medium-to-Long-Term: Pullbacks are considered healthy technical corrections, and central bank gold purchases and interest rate cuts support the long-term bullish logic.
Specific Trading Recommendations:
Long Strategy:
Entry Point: Light long position at 3950-3957 USD, or add to the position on dips at 3920-3900 USD.
Stop Loss: 3945 USD (if broken) or 3880 USD (below key support).
Target: 4000 USD (hold until 4030 USD if it breaks through).
Short Selling Strategy:
Entry Point: Sell short on a rebound to the $3970-$4000 range.
Stop Loss: Above $4005.
Target: $3920-$3900.
If the Fed is more dovish than expected, consider going long with a target of $4030; if hawkish, target $3880.
Risk Warning: Fed Chair Powell's speech and the outcome of the US-China meeting may trigger significant volatility. Avoid being heavily invested and affected by the volatility!
Trade ideas

Gold Intraday Trading Plan 11/3/2025As explained in my weekly post, I am bullish on gold right now. For today's setup, I will look for buying opportunities from 3965-3972. If the line in the chart holds, gold will form a bullish wedge, which is a sign of upward continuation. My target for today is 4128.

GOLD | Bearish Momentum Holds Below Pivot Zone GOLD | Bearish Momentum Holds Below Pivot Zone
Gold remains under bearish pressure as it trades below the pivot zone at 4,034–4,053, signaling continued weakness amid cautious sentiment ahead of upcoming U.S. data.
🕯 Momentum remains negative, but a breakout above the pivot zone could quickly shift the tone back to bullish.
Key Levels
Pivot Zone: 4,034 – 4,053
Resistance: 4,082 · 4,105 · 4,189
Support: 4,004 · 3,982 · 3,921
Trading Plan:
Sell Setup: Shorts valid below 4,038, targeting 4,004 / 3,982 / 3,921.
Buy Setup: Longs valid only above 4,053, targeting 4,105 / 4,152.
Premium Takeaway
Gold remains in bearish control below 4,053, with potential to drop toward 3,982–3,921.
A confirmed 1H close above 4,053 would shift bias to bullish, opening the path toward 4,105–4,189 in the short term.

Gold price recovers - resistance zone 4000⭐️GOLDEN INFORMATION:
Gold (XAU/USD) bounces from an Asian session low near $3,916, edging away from a three-week trough hit on Monday. The metal’s pullback from record highs appears to pause, though gains remain limited as traders await the Fed’s policy decision, with a rate cut widely expected on Wednesday.
⭐️Personal comments NOVA:
Gold prices are recovering, as the market is looking forward to today's FED interest rate cut, regaining the 4000 mark.
⭐️SET UP GOLD PRICE:
🔥SELL GOLD zone: 4050 - 4052 SL 4057
TP1: $4040
TP2: $4030
TP3: $4020
🔥BUY GOLD zone: 3886 - 3884 SL 3879
TP1: $3900
TP2: $3910
TP3: $3925
⭐️Technical analysis:
Based on technical indicators EMA 34, EMA89 and support resistance areas to set up a reasonable BUY order.
⭐️NOTE:
Note: Nova wishes traders to manage their capital well
- take the number of lots that match your capital
- Takeprofit equal to 4-6% of capital account
- Stoplose equal to 2-3% of capital account


XAUUSD BEARISH REVERSAL SETUP FROM SUPPLY ZONE🔍 Key Observations:
1. Market Structure Shift:
A Change of Character (CHoCH) has occurred near the upper boundary of the ascending channel.
This indicates a potential shift from bullish to bearish momentum.
2. Liquidity & Supply Zone:
The red zone near $4,044 – $4,018 acts as a supply zone or bearish order block.
Price has reacted from this level, rejecting higher prices.
3. Entry & Targets:
Entry: Around $4,011 – $4,018 (current zone)
Stop Loss: Above the recent high near $4,044
First Target (TP1): $3,977 – local liquidity zone
Second Target (TP2): $3,930 – $3,915 major demand area / imbalance fill zone
4. Channel Breakdown Potential:
If the price closes below the lower trendline of the ascending channel, a strong bearish continuation toward the lower targets is expected.
5. Smart Money Concept (SMC) View:
The chart aligns with liquidity grab above highs, followed by CHoCH, suggesting smart money selling pressure.
A retracement to premium zones has already happened, and distribution is likely underway.
📉 Bearish Outlook Summary:
Bias: Bearish
Entry Zone: 4,011 – 4,018
Stop Loss: 4,044
Target 1: 3,977
Target 2: 3,930 – 3,915
Invalidation: Break and close above 4,045 would negate bearish setup.

Gold is Ready For Bull From SupportHello Traders
In This Chart GOLD HOURLY Forex Forecast By FOREX PLANET
today Gold analysis 👆
🟢This Chart includes_ (GOLD market update)
🟢What is The Next Opportunity on GOLD Market
🟢how to Enter to the Valid Entry With Assurance Profit
This CHART is For Trader's that Want to Improve Their Technical Analysis Skills and Their Trading By Understanding How To Analyze The Market Using Multiple Timeframes and Understanding The Bigger Picture on the Charts

Gold will likely rocket to over $10,000...Gold will likely rocket to over $10,000...
Once it can breakout versus the US stock markets.

Gold Pullback Could Be the Next Buying OpportunityHello, traders, I want share with you my opinion about Gold. The market for Gold has been trading within a clear bullish structure, forming an ascending channel since breaking out from the earlier range near the 4,050–4,100 zone. The breakout from that consolidation led to strong upward momentum, with price making consistent higher highs and higher lows. Recently, the market faced strong selling pressure from the Seller Zone near 4,366, which aligns with the Resistance Level. After a retest of this supply area, price rejected and started a correction within the channel. The price is approaching the Buyer Zone around 4,205, which also coincides with the lower boundary of the ascending channel and the previous support level. This confluence makes the area significant for potential bullish reactions. I expect Gold to retest the Buyer Zone (4,205) and, if buyers show strength, a bounce toward 4,320–4,366 could follow. This would represent the continuation of the uptrend within the ascending channel. However, if price breaks below 4,205, it would signal a possible shift in structure and open the door for a deeper correction toward the 4,100 area. Please share this idea with your friends and click Boost 🚀

GOLD MARKET ANALYSIS AND COMMENTARY - [Nov 03 - Nov 07]This week, global OANDA:XAUUSD prices recorded their second consecutive weekly decline. Spot gold started the week at $4,104/oz, dropped to $3,886/oz at one point, and then recovered to around $4,000/oz.
In the coming week, gold prices may move sideways with no clear trend, requiring more time for accumulation.
If the price trades above the 4,045 resistance level, it may recover to 4,150, and a break above this level could push it toward 4,250.
However, if the price falls below 3,900, there is a risk of a sell-off, potentially dragging it down to around 3,750.
Notable technical levels are listed below.
Support: 3,750 – 3,900 USD
Resistance: 4,045 – 4,150 – 4,250 USD
SELL XAUUSD PRICE 4151 - 4149⚡️
↠↠ Stop Loss 4155
BUY XAUUSD PRICE 3899 - 3901⚡️
↠↠ Stop Loss 3895

GOLD | Gains Capped by Trade Uncertainty and Fed ExpectationsGOLD – MARKET OUTLOOK | Gains Capped by Trade Uncertainty and Fed Expectations
Gold futures rose slightly but gains remain limited as investors assess the U.S.–China trade deal and potential Fed rate cuts.
Market sentiment stays cautious, with traders awaiting key U.S. data for direction.
Below 4,025: Bearish bias toward 3,982 → 3,960 → 3,921.
Above 4,025: Bullish recovery toward 4,053 → 4,104.
Pivot: 4,025
Support: 3,982 · 3,960 · 3,921
Resistance: 4,053 · 4,080 · 4,104
Gold remains bearish below 4,025, but a confirmed break above 4,053 could shift sentiment to bullish in the near term.
PREVIOUS IDEA:

XAUUSD Daily Outlook – Bearish Trend Still IntactGold (XAUUSD) has been moving in a clear bearish trend for the last two weeks, showing consistent lower highs and lower lows. Despite short-term pullbacks, the market continues to respect the downward structure as sellers remain in control.
The 4000/4020 level is acting as a strong resistance zone, and price rejection from this area confirms continuation toward 3895. Momentum and volume both support further downside movement.
KEY POINTS:
CURRENT PRICE: 3980
TARGET: LEVEL : 3935
TARGET LEVEL : 3895
RESISTANCE : 4000/ 4020

GOLD | Daily Analysis #1 - 29 October 2025Hello and welcome back to DP
Today we’re excited to launch our Gold daily analysis series. We hope this new addition provides useful and practical insights for your trading decisions. Please support us with your follows and reactions — it really helps us grow!
Market Review:
After a strong bullish run over the past 2–3 weeks, gold finally started to correct from October 20, 2025, continuing its decline up until yesterday.
On the daily timeframe, we’ve identified:
• Support: 3,897
• Resistance: 4,155
Today’s trading session is particularly important as the Federal Reserve’s interest rate decision is due.
According to CME FedWatch, there’s about a 95% probability that the Fed will cut rates by 25 basis points.
Until the announcement, we may see choppy and sideways movement, but once the decision is released, expect a surge in volume and sharp “kangaroo” moves in both directions as traders react to the news.
1H–4H Technical Analysis:
As seen on the chart, 3,897 and 4,155 remain our key daily support and resistance zones.
• If price breaks above 4,012 and confirms the breakout, gold may extend higher toward 4,083 as the first upside target.
• On the other hand, if price drops below 3,974, it may continue falling toward the 3,897 support zone.
With the Fed’s rate decision approaching, expect increased volatility.
Whichever direction price confirms after the announcement could set the tone for gold’s next major move.
Trade cautiously, keep your stop-loss tight, and avoid chasing price during the initial volatility spike.
Disclaimer:
This content is for informational purposes only and does not constitute financial or investment advice. © DIBAPRISM
Amir D.Kohn

XAUUSD Bear Cycle has started and this is why according to VIX.Gold (XAUUSD) closed 2 straight red weeks, which last did on June 23. Despite this pull-back, it remains within a Channel Up since the October 31 2022 Low, which was essentially when the Bear Cycle ended and the new Bull Cycle (Channel Up) started.
The previous Bull Cycle topped around 4.5 months after the Volatility Index (VIX) shown in blue, peaked during the March 2020 COVID flash crash.
We are now on a similar situation as VIX topped on the week of March 31 2025 during the Trade War and has since started to decline aggressively. Gold's current top was 6.5 months after VIX's top. Even the 1W RSI sequences between the two Bull Cycles are similar, further raising the degree of their high symmetry.
According to this correlation, Gold may has already formed its Bull Cycle Top 3 weeks ago and could be starting a new +2 year Bear Cycle.
As far as a Target and Bottom is concerned, the previous Bear Cycle almost hit its 0.382 Fibonacci retracement level three times throughout the Cycle, until it broke below it marginally for its September - October 2022 bottom.
As a result, we are looking for the 0.382 Fib yet again as our focal point which is currently around $3000.
-------------------------------------------------------------------------------
** Please LIKE 👍, FOLLOW ✅, SHARE 🙌 and COMMENT ✍ if you enjoy this idea! Also share your ideas and charts in the comments section below! This is best way to keep it relevant, support us, keep the content here free and allow the idea to reach as many people as possible. **
-------------------------------------------------------------------------------
💸💸💸💸💸💸
👇 👇 👇 👇 👇 👇

gold on sell reverse#XAUUSD price have breakout the 4000 price on retracement. Now we await for 2 times breakout below 4013 before selling.
Below 4013 sell on 2 times breakout, target 3986-3959, stop loss 4027.
Buying can be valid if the Fed rates gives something good.

XAUUSD: How Will Gold Prices Move Next?Fundamental approach:
- Trade Talks and Gold Sentiment:
Gold experienced a sharp correction after reaching record highs, primarily due to improving risk sentiment as optimism grew around US-China trade negotiations. Reports indicate that both nations have reached a preliminary framework agreement on export controls and tariffs, which is expected to ease geopolitical tensions and reduce demand for safe-haven assets, such as gold.
- Other Pressures: Fed Policy and the US Dollar:
The gold market is also reacting to expectations of a Fed rate cut. While a rate cut typically supports gold, the move is largely priced into the market. Recent steadiness in the US dollar, as well as the possibility of a less dovish stance from the Fed, has added further pressure. With traders focusing on upcoming policy signals and macroeconomic data, a "cut and pause" approach from the Fed could prompt continued profit-taking in gold.
- Outlook:
As long as US-China relations remain stable and central banks, especially the Fed, avoid surprising markets with additional dovish measures, XAUUSD may remain under pressure.
Technical approach:
- XAUUSD significantly declined to the support area of 3890-3950. The price is between both EMAs, indicating a shift to sideways movement.
- If XAUUSD breaches the support area, the price may decline to the next support level at 3720, which is confluenced with the 61.8% Fibonacci Extension.
- Conversely, remaining above the support area may prompt a retest of the next resistance at 4054.
Analysis by: Dat Tong, Senior Financial Markets Strategist at Exness

Gold is heading towards my Targets / #5,100.80 mark aheadTechnical analysis: As I announced that correction is over on Gold (Fed or not), Price-action has recovered half of the post Fed losses on the E.U. session opening as DX was taking big Daily candle hit. However the rise is still not proportional as DX and global futures are still on Higher levels. This leads me to believe that on the Short-term, there is a stronger connection of Gold to DX, rather than Bond Yields, so I will keep an eye for pressure zones on DX as I did for past few fractals. Technically the Hourly 4 chart was isolated within invalidated / former Descending Channel on it’s Higher Low’s, as Resistance currently has to give away since last couple occasions it provided rejection twice (#4,027.80). I am expecting strong Bullish move to take place throughout next week. Despite the Bearish Fundamental outcome on announcements this week (Fed Rate cut was Bullish however hawkish stance from Powell had much more after-effect on Gold), Gold continues to Trade near the #2-Week High’s. This indicates that this and last week's aggressive Buy-off on DX was largely a pre-pricing of those Fed Rate numbers. What's obvious, as the current week is coming to a close, is that the consolidation since yesterday’s session is just above the Daily chart’s Support Zone (#3,975.80 - #3,988.80) which lifts the probabilities for an aggressive Buying sequence ahead, especially all lesser charts turning Bullish now. Interestingly, the Weekly candle percentage will be flat almost on zero percent if Gold continues to soar. I remain fully Bullish on the Short and Medium-term, in addition my Technicals are showcasing Bullish signs as I expect Gold to continue rising (Buying every dip) on Buying pressure from DX on expected spiral downtrend, Bond Yields as well struggling to make Bullish comeback).
My position: I have been monitoring Gold from sidelines as mentioned throughout yesterday's session Highly satisfied with my Profit, as I spotted that #3,988.80 is showcasing strong durability, I have started Buying Gold with aggressive Scalps from #3,988.80 - #3,992.80 many times with at least #15ish orders delivering excellent Profits. I do believe Gold will continue soaring as long as Support zone is intact with #4,052.80 mark as my next Short-term Target.

GOLD $4091 | a Short Position basic rule is when one sees a parabolic move
it's time to sell on the way up instead of aping in
difficult to contain fomo however
just have to pull t he trigger after a week of confirmation or red candle
the bounce should be opportunity to size up
and STOPS ha s to be higher
as you can get wicked ouot
Gold: Tests key $4K levelThe most important news during the previous week was related to the Fed cut of reference interest rates by 25 basis points. Although the market was previously expecting another rate cut in December, Fed Chair Powell commented that such a course of action is currently questionable for Fed members. At the same time, other risks which previously pushed the price of gold to ATH have eased, so the price of gold remained in a quest to find a new equilibrium level. Analysts from Morgan Stanley stated on Friday that they are still estimating potential gains for gold, driven by interest rate cuts, ETF inflows, central bank buying, and persistent economic uncertainty. The bank projects gold will average $4,300 during the first half of 2026.
As expected, gold dropped during the previous week to the lowest weekly level at $3.888. The price reversed a bit for the rest of the week, closing it at $4.002. The level of $4K currently represents a significant level for gold. The RSI is still moving above the level of 50, however, it is on a course to reach the oversold market side in the coming period. On the other hand, moving averages of 50 and 200 days continue to move without a change from the previous period, as two parallel lines with an uptrend.
Charts are suggesting that the level of $4K will be the level to watch for another week in a row. The week ahead will start by testing this level. In case that it is not breached, there is a probability that the gold will revert back, where $4,1K could be a short term target. In case that selling orders prevail in the week ahead, then $3,9K will be a target of gold for one more time.

Gold/Copper Signaling Recession & Market Super bubble!We're continuing to see extreme signals from Gold, and that should raise concerns.
Earlier, I highlighted the Gold/Oil ratio — now, I want to draw your attention to the Gold/Copper ratio:
🔗
Historically, such extreme readings in the Gold/Copper ratio have consistently preceded recessions. The only exception? A period of economic stagnation and sideways markets — not exactly a bullish outcome. See the chart from 2014 to 2016
🔗 www.tradingview.com
Quick recap:
Gold = Fear + Inflation hedge
Copper = Economic strength + Inflation signal
Oil = Similar to Copper; reflects growth and inflation expectations
These divergences aren't random — they’re warning signs of a recession & market Super Bubble that's about to POP!
These are not random fluctuations of prices. You can choose to view them as such. I get it. But from a macroeconomic perspective, this is bad JUJU!
Capitalism without failure is like religion without hell! Remember that!
Click boost, like, and subscribe! Let's get to 5,000 followers! ))

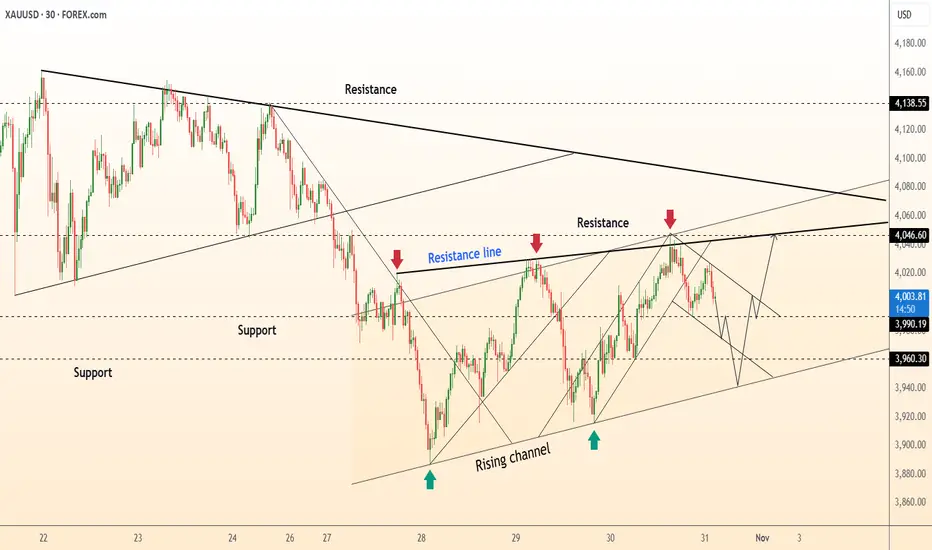
DeGRAM | GOLD seeks to decline📊 Technical Analysis
● Price trends inside a descending channel, posting lower highs after rejections at ~4045; latest pullback broke intraday base and points toward mid-channel.
● Bearish structure with failed bounce at prior support (~3950) keeps momentum down; next magnet sits near 3855 (channel/HTF support confluence).
💡 Fundamental Analysis
● Short-term bearish: stronger USD and improved risk appetite recently weighed on gold after the retest of record highs, triggering corrective pressure.
✨ Summary
● Bias: short toward 3950 → 3855, invalidation above 4045. Key levels: 4045 (res), 3950/3855 (supports).
-------------------
Share your opinion in the comments and support the idea with a like. Thanks for your support!

DeGRAM | GOLD is forming a new local ascending structure📊 Technical Analysis
● XAU/USD is forming a rising channel, holding firm above 3,960 support after rejecting from the resistance near 4,046.
● The pattern suggests a continuation of the uptrend as long as price sustains above the channel base, with potential breakout targets toward 4,138.
💡 Fundamental Analysis
● Gold remains supported by a softer dollar and cautious market sentiment ahead of key U.S. employment data, which could further boost safe-haven demand.
✨ Summary
● Long bias above 3,960; targets 4,046–4,138. Rising structure and weaker dollar fundamentals reinforce short-term bullish momentum.
-------------------
Share your opinion in the comments and support the idea with a like. Thanks for your support!
Gold Extends Decline Below $4,000 as Risk Appetite Returns🔍 Market Context
Gold continues to struggle amid renewed optimism around US–China trade talks.
The shift in sentiment has reduced safe-haven demand, while softer expectations of further Fed rate cuts keep the US Dollar capped — offering limited downside support for XAUUSD.
However, the technical landscape remains clearly bearish.
The break below the $4,000 handle confirms continuation of the downtrend first outlined in early-week plans.
📊 Technical Analysis
Structure: Gold maintains a clean bearish channel on the H1–H4 frame.
Immediate resistance: $3,985 – $4,000 (former support, now supply zone).
Target zones:
• Short-term liquidity area near $3,925–$3,930
• Extended target sits around $3,880–$3,860, aligning with Fibo 1.618.
Invalidation: Only a sustained break and hold above $4,020–$4,030 would neutralize this short-term bearish bias.
🎯 Trading Outlook
If gold retests the broken $4,000 zone and fails to regain it,
expect sellers to extend control toward $3,920 or lower ahead of the FOMC meeting.
That event may later define the next recovery point — but for now, momentum remains firmly on the downside.
⚜️ Summary
Gold’s recent slide isn’t random — it’s structural.
The market is rebalancing after excessive bullish sentiment,
and liquidity below $3,900 is likely to attract attention before any significant rebound.
Watch the reaction near $3,920–$3,880 —
that’s where the next meaningful decision for gold may emerge.
📊 MMFLOW TRADING Insight:
“Smart money doesn’t chase candles — it waits for liquidity to shift.”
