GOLD XAUUSD THE NEW MONEYGOLD ,the price action shows that gold could get to 5000k so easily ,
layer by layer dont rush.
sell roof 4372-4385 sell zone
4306-4300-4298 sell roof
goodluck.
#xauusd #gold
Trade ideas

GOLD LONG TERM Target Hello everyone, I hope you are well
In this idea, I will share with you some of the expectations I see on the price of gold in the long term
I expect that the price has approached the target and will be in the rectangle shown in the idea
Which is between $4200 and $5000
After that, the price will enter a downward trend that may last for years
Remember this is not investment advice. You are responsible for the buying and selling decision
Beware of using leverage. The reason is that this is not an accurate recommendation
Good Luck

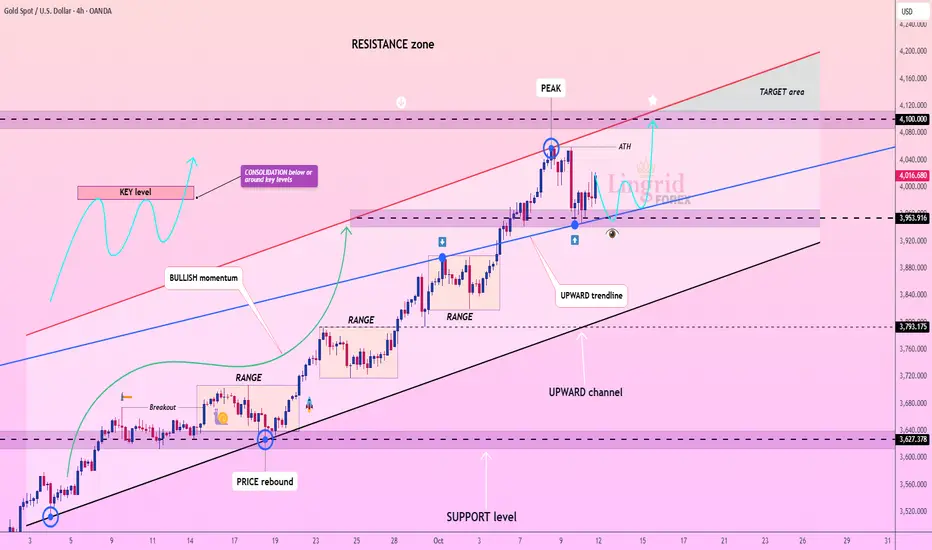
Lingrid | GOLD Retracement Entry Trend Continuation SetupThe price perfectly fulfilled my previous idea . OANDA:XAUUSD remains within its strong upward channel, rebounding each time from its dynamic trendline to form higher lows. The structure displays clear bullish momentum supported by consecutive range breakouts and sustained trend continuation. A stable hold above 4,050 could trigger a renewed rally toward 4,200 and possibly 4,250 resistance. The broader market structure confirms steady accumulation, keeping buyers in control of the short-term trend.
⚠️ Risks:
A break below 4,060 could weaken bullish pressure and lead to a deeper correction.
Rising U.S. yields or hawkish Fed Chair Powell commentary may limit upside momentum.
Unexpected macro data or geopolitical developments could cause short-term volatility.
If this idea resonates with you or you have your own opinion, traders, hit the comments. I’m excited to read your thoughts!

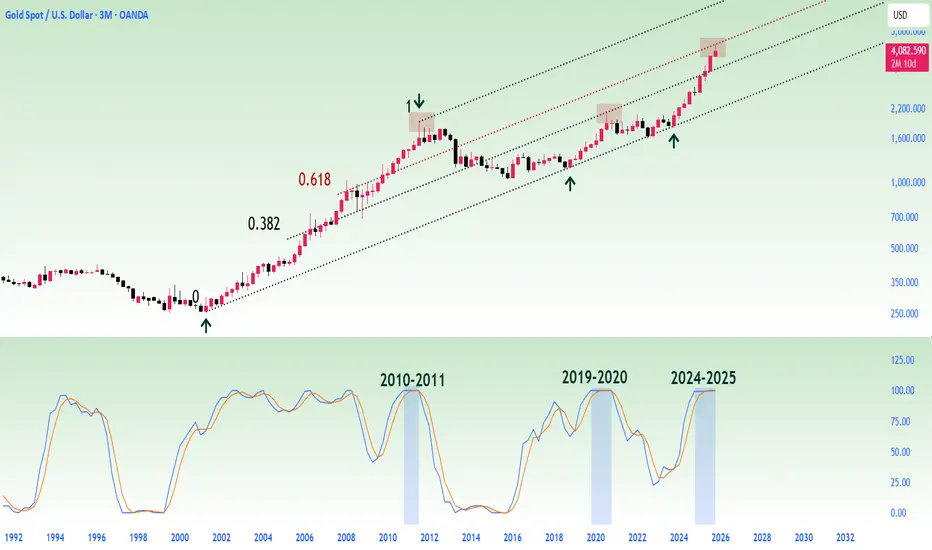
Gold has reached its peak and is about to undergo a reversal?Gold has been rejected at the 0.618 level of the Fibonacci channel on the 3M chart.
The Stoch RSI demonstrates a striking similarity to past cycles:
The bullish structure, which continued in the overbought region in October 2010, peaked 273 days later in July 2011.
Momentum, which continued in the overbought region again in October 2019, reached its peak 365 days later in October 2020.
Today, history paints a similar picture once again.
The bullish structure, which began in the overbought region in October 2024, may have reached its peak approximately one year later, in October 2025, just as in previous cycles.
Gold appears to be completing its historical rhythm once again.
Gold Bull Markets Long Term Overview and 2025 Market UpdateGold Bull Markets Long Term Overview and 2025 Market Update
________________________________________
• This cycle is different: record central-bank buying + renewed ETF inflows + lower real rates = powerful tailwind.
• Price: Gold notched fresh ATHs this month (up to $3,790.82). 2025 is shaping up as the strongest year since the late 1970s.
• Relative: Gold is crushing equities YTD (≈+40% vs S&P 500 ≈+13% total return).
• Setup: A 13-year “cup-and-handle” breakout in 2024 kick-started the move.
• Outlook: Base case from the Street: $3,700 by end-’25 and ~$4,000 by mid-’26; upside to $4,500 if flows accelerate.
________________________________________
🏆 Historic Gold Bull Markets — Timeline & Stats
1) 1968–1980 “Super Bull”
• Start/End: ~$35 → $850 (Jan 1980)
• Gain: ~2,330%
• Drivers: End of Bretton Woods, oil shocks, double-digit inflation, geopolitical stress.
• Drawdown: ~–45% (1974–1976) before the final blow-off run.
2) 1999–2011/12
• Start/Peak: ~$252 (1999) → ~$1,920 (2011–12)
• Gain: ~650%
• Drivers: Commodities supercycle, EM demand, USD weakness, GFC safe-haven bid.
3) 2016/2018–Present (The “CB-Led” Cycle)
• Start Zone: $1,050–$1,200 → New ATH $3,790 (Sep 2025)
• Gain: ~215–260% (depending on 2016 vs 2018 anchor)
• Drivers: Record central-bank accumulation, sticky inflation/low real rates, geopolitics; 2024 13-yr base breakout.
________________________________________
📊 At-A-Glance Comparison (Updated 2025)
Metric 1968–80 Super Bull 1999–2012 2016/18–2025 Current
🚀 Total Gain ~2,330% ~650% ~215–260% (so far)
⏲️ Duration 12 yrs 13 yrs 7–9 yrs (ongoing)
💔 Max Drawdown ~–45% (’74–’76) ~–30% (’08) ~–20% (2022)
🏦 Main Buyer Retail/Europe Funds/EM Central Banks (dominant)
🏛️ Pattern Secular parabolic Cyclical ramps 13-yr base → breakout (’24)
Notes: current cycle characteristics validated by WGC demand trends & technical breakout in Mar 2024.
________________________________________
📈 Top 10 Stats of the Current Bull (2025)
1. Price & ATHs: Spot $3,75–$3,79k; fresh ATH $3,790.82 on Sep 23, 2025.
2. 2025 YTD: Roughly +40–43% YTD (best since the late ’70s).
3. Central Banks: 1,045 t added in 2024 (3rd straight 1k+ year). H1’25 ≈ 415 t (still elevated).
4. ETF Flows: Strongest half-year inflows since 2020, aiding the surge.
5. Gold vs Equities: Gold ≈+40% vs S&P 500 ≈+13% total return YTD.
6. Jewelry Demand: Price strength is crimping tonnage (2024 down ~11%; Q2’25 –14% y/y), even as value hits records.
7. Gold–Silver Ratio: Now around ~85–88 (silver catching up as it pushes $43–$44).
8. Macro Link: Strong safe-haven bid + rate-cut hopes supporting new highs.
9. Technical: Confirmed cup-and-handle breakout (Mar ’24) underpinning trend.
10. Street Forecasts: DB lifts 2026 to $4,000; GS baseline $4,000 by mid-’26, upside $4,500 with bigger private-investor rotation.
________________________________________
🔄 What Makes This Bull Different (2025 Edition)
• 🏦 Central-Bank Dominance — Official sector is the anchor buyer (3rd straight 1k+ tonne year in 2024; 2025 tracking strong despite Q2 deceleration).
• ⚡ Faster Recoveries — Pullbacks have been shallower and shorter vs the 1970s analog.
• 📈 Coexisting With Risk Assets — Rare combo: gold ATHs with equities up YTD suggests a macro hedge bid alongside optimism in select risk assets.
• 📐 Structural Breakout — The 13-year base cleared in 2024 set multi-year targets.
________________________________________
🎯 Strategy Ideas (2025 & Beyond)
Core
• Buy/Hold on Dips: Stagger entries (DCA) into physical (allocated), ETFs (e.g., GLD/IAU), and quality miners/royalties.
• Prefer Physical/Allocated where counterparty risk matters; use ETFs for liquidity.
Satellite/Leverage
• Silver & GSR Mean-Reversion: With the GSR ~85–88, silver historically offers torque in up-legs. Pair with high-quality silver miners.
• Factor Tilt in Miners: Focus on low AISC, strong balance sheets, growing reserves, and jurisdictions with rule-of-law.
Risk-Management
• Define max drawdown tolerance per sleeve; pre-plan trims near parabolic extensions or if macro invalidates (e.g., real-yield spike).
________________________________________
🧪 Reality Check: What Could Invalidate the Bull?
• Real yields + USD rip higher (sustained), dampening non-yielding assets.
• Sharp halt in official-sector buying (e.g., policy shifts).
• Rapid growth re-acceleration reducing safe-haven & rate-cut expectations.
________________________________________
🧭 Quick Reference Tables
🧾 Summary: Historic vs Current
Feature 1968–80 1999–2012 2016/18–2025
Total Gain ~2,330% ~650% ~215–260%
Duration 12 yrs 13 yrs 7–9 yrs (ongoing)
Correction ~–45% ~–30% ~–20% (’22)
Main Buyer Retail/Europe Funds/EM Central Banks
Pattern Parabolic Cyclical Cup & Handle → Secular
🧩 “If-This-Then-That” Playbook
• If real yields fall & CB buying persists → Ride trend / add on consolidations.
• If USD + real yields jump → Trim beta, keep core hedge.
• If GSR stays >80 with silver momentum → Overweight silver sleeve for torque.
________________________________________
🧠 Outside-the-Box Adds
💼 Role in a Portfolio (example frameworks)
• Resilience sleeve (5–10%): Physical + broad ETF.
• Offense sleeve (2–5%): Quality miners/royalties; optional silver tilt.
• Tactical (0–3%): Trend-following overlay (breakouts/consolidations).
🧭 Decision Checkpoints (quarterly)
• Central-bank net purchases (WGC).
• ETF flows (Western markets).
• Real yields (10y TIPS), USD trend, and GSR.
________________________________________
🔚 Key Takeaways (Updated)
• Relentless official-sector demand + technical breakout are the twin pillars of this cycle.
• Macro mix (policy easing expectations, geopolitics, diversification from USD reserves) supports an extended run.
• Base case: Street sees $3.7k by end-’25 and ~$4k by mid-’26, with upside to $4.5k if private capital rotation accelerates. Manage risk; embrace volatility.

Gold sales plan!!Trading Setup:
A Trading Signal is seen in the Gold XAUUSD (1h)
Traders can open their Sell Trades NOW
Sell now or sell on 4104.0
SL @ 4196.0
TP1@ 3946.0
TP2@ 3861.0
TP3@ 3761.0

Lingrid | GOLD Weekly Outlook: Dip-Buying Dominance ContinuesThe price perfectly fulfilled my previous weekly idea . OANDA:XAUUSD market delivered another impressive performance this week, decisively pushing through the psychologically significant $4,000 threshold. While this round number naturally attracts considerable market attention, seasoned traders recognize it as simply another milestone in gold's broader trajectory rather than a definitive ceiling.
What's particularly noteworthy is the dramatic increase in market volatility. Recent weeks have demonstrated a pattern where pullbacks averaging around 2% are consistently followed by rallies exceeding 4.5%. This asymmetric price action—where advances substantially outpace corrections—reveals strong underlying bullish momentum and aggressive buying on dips. The market may easily absorb a 2.8% pullback before staging another robust recovery, reinforcing this established rhythm.
Price action shows gold trading within a well-defined upward channel, with price respecting both the lower trendline support near $3,950 and approaching the upper resistance zone around $4,100. The all-time high formation near $4,060 marked a crucial peak, and current consolidation below this level suggests the market is building energy for the next directional move.
Key support remains anchored around $3,950, while the upward channel structure indicates potential targets extending into the $4,100-$4,200 range. The combination of persistent bullish momentum, widening volatility swings, and successful defense of higher lows points to a market that's far from exhausted. We should watch for either a breakout above $4,060 toward the target area or a retest of channel support before the next advance materializes.
If this idea resonates with you or you have your own opinion, traders, hit the comments. I’m excited to read your thoughts!
XAU LONGSLast post moving fast here….
$4236 flat and 34 entries!!!
Going with stops at $4200 flat, ZERO Allowance!!!
Refer to previous posts for handles and currently working with $4281 into 85 for breach.
Let’s see! 🏦

XAUUSD short ??Price has rejected the intraday resistance near 4368– 4370, showing exhaustion and forming a lower-high structure. Liquidity above the previous swing has been taken, this shows potential shift from accumulation to distribution.
selling below 4356 .
safe book @4339
if the level breaks below 4337 then trailing to 4300 - 4295
FXOPEN:XAUUSD

My Gold Observation We have seen a rapid Bullish move on Gold recently and the Bearish phase has just resumed.
From my professional view, i see Gold retracing to around $2600+ (mid term).
I stand to be corrected.
See you @ the TOP

Market Analysis: Gold Dips From HighsMarket Analysis: Gold Dips From Highs
Gold price started a downside correction from $4,380.
Important Takeaways for Gold Price Analysis Today
- Gold price climbed higher toward the $4,380 zone before there was a sharp decline against the US Dollar.
- It traded below a bullish trend line with support at $4,300 on the hourly chart of gold.
Gold Price Technical Analysis
On the hourly chart of Gold, the price climbed above $4,200. The price even spiked above $4,300 before the bears appeared.
A high was formed near $4,380 before there was a fresh decline below a bullish trend line with support at $4,300. There was a move below the $4,200 pivot level. The bears even pushed the price below $4,120 and the 50-hour simple moving average.
It tested the $4,000 zone. A low is formed near $4,002 and the price is now correcting losses. There was a minor move above the 23.6% Fib retracement level of the downward move from the $4,381 swing high to the $4,002 low.
Immediate resistance on the upside is near $4,190 and the 50% Fib retracement. The first major hurdle for the bulls could be $4,235 and the 50-hour simple moving average.
The main barrier for the bulls could be near the $4,380 level, above which the price could test the $4,500 zone. Any more gains might call for a move toward $4,650.
An upside break above $4,650 could send Gold price toward $5,000. Initial support on the downside is near $4,090 level. The next key level is $4,000. If there is a downside break below $4,000, the price might decline further. In the stated case, the price might drop toward $3,800.
This article represents the opinion of the Companies operating under the FXOpen brand only. It is not to be construed as an offer, solicitation, or recommendation with respect to products and services provided by the Companies operating under the FXOpen brand, nor is it to be considered financial advice.

Global economic data faces disruptionThe trading week from October 11 to 17 is expected to be highly volatile as the U.S. government shutdown could delay the release of key economic data such as CPI and Nonfarm Payrolls (NFP), making it difficult for the Federal Reserve to assess inflation trends ahead of its upcoming policy meeting. Throughout the week, investors will focus on major events including the IMF and World Bank Annual Meetings, the NATO Defense Summit, and the G20 press conference.
Central banks like the Fed, ECB, and RBA will continue to shape market sentiment through speeches and meeting minutes, while China, OPEC, and the Eurozone will release crucial data on trade, inflation, and energy—potentially triggering short-term volatility across global markets.
Three key risks will dominate this week: escalating geopolitical tensions in Ukraine and the Middle East, central bank communications that could shift interest rate expectations, and the potential resurgence of trade wars dampening global risk appetite. In this environment, safe-haven assets such as gold, the U.S. dollar, and Treasury bonds are likely to attract capital inflows, while equities and commodities may face downward pressure.
Technical Outlook Analysis OANDA:XAUUSD
Trend Overview
• After a short-term correction to around $3,950/oz, gold prices rebounded and closed above $4,000 – confirming the recovery momentum in the main uptrend.
• The main trend remains strong, supported by:
o The MA20 is clearly sloping up.
o RSI remains above 60, not yet giving an overbought signal.
o The uptrend channel is still maintained, the daily candle closed near the top – showing overwhelming buying power.
Key Technical Zones
• Nearest Resistance: $4,059 – this is the short-term top that needs to be overcome to extend the upside.
• Next Resistance:
o Fibonacci level 0.382 at $4,232,
o Level 0.5 at $4,320,
o And the 0.618 extension at $4,408 – potential targets if gold maintains the current momentum.
• Short-term Support:
o $4,000 (strong psychological zone – now turned from resistance to support).
o Deeper support at $3,896 – $3,871, coinciding with the confluence of MA20 + previous correction bottom.
Summary
• Gold is basically in an uptrend (Wave 3) with strong momentum and no RSI divergence signal yet.
• As long as the price holds above $3,950, the uptrend remains dominant.
• If there is a decisive breakout above $4,059, the next target will be the $4,230 – $4,320 zone in the short term.
SELL XAUUSD PRICE 4076 - 4074⚡️
↠↠ Stop Loss 4080
→Take Profit 1 4068
↨
→Take Profit 2 4062
BUY XAUUSD PRICE 4000 - 4002⚡️
↠↠ Stop Loss 3996
→Take Profit 1 4008
↨
→Take Profit 2 4014

GOLD Resistance? what's next??#GOLD.. perfect move as per our last idea regarding gold cut n reverse area.
now market just broke his supporting region and if market hold that region than it will convert to resistance area.
that is around 4281-892 to 4287-88
keep close and holding or that region means we can expect a further dip .
NOTE: we will go for cut n reverse above that region on confirmation.
good luck
trade wisely

GOLD- Resistance Often Acts as a SupportPrice took resistance near previous highs and moved rapidly down back to a key level zone near 4268.270, which may now act as support as this was previously a resistance.
Remember? Previous resistance often acts as support.
The price is still swinging in a wide range so no clear directional bias for the short term.
However, a small scalping opportunity and it could be a done trade with 1% gain or 0.5% loss.
A buy setup at this level could give a nice 1:2 trade.
Assumption behind this idea is that the large bearish candle near support was just a shakeout and the price may proceed in the direction of the main trend, which is up.
What do you do at this point?
Do you sell because of short term selling pressure or buy because overall trend is up.
#This is not a buy sell recommendation..just for educational purpose.

XAUUSDThe double-top pattern is interpreted by traders and analysts as a bearish indicator. It implies that the upward trend has slowed down and that a price decrease is more likely. The break of the neckline, a horizontal line formed between the lows of the troughs, is frequently used by traders to confirm the pattern

GOLD BEARISH CORRECTION TOWARDS SUPPORT ZONEChart Overview:
Timeframe: 15-minute
Price Range: 4,170 – 4,360 USD (visual scale)
Current Price: 4,240 USD
Trend Channel: Uptrend channel (yellow) with a recent breakdown from the midline.
🧠 Technical Analysis:
1. Previous Move:
Gold experienced a strong bullish run within an ascending channel, reaching the resistance zone near 4,360.
The momentum formed a rounded top pattern, signaling potential exhaustion of buyers.
2. Pattern Development:
A head-and-shoulders–like formation is visible at the top of the structure.
Price broke below the neckline and tested lower support near 4,215 before rebounding slightly.
3. Current Structure:
Price is retesting the broken support (now resistance) area near 4,260.
The black curve projection shows a potential lower high forming — a bearish continuation setup.

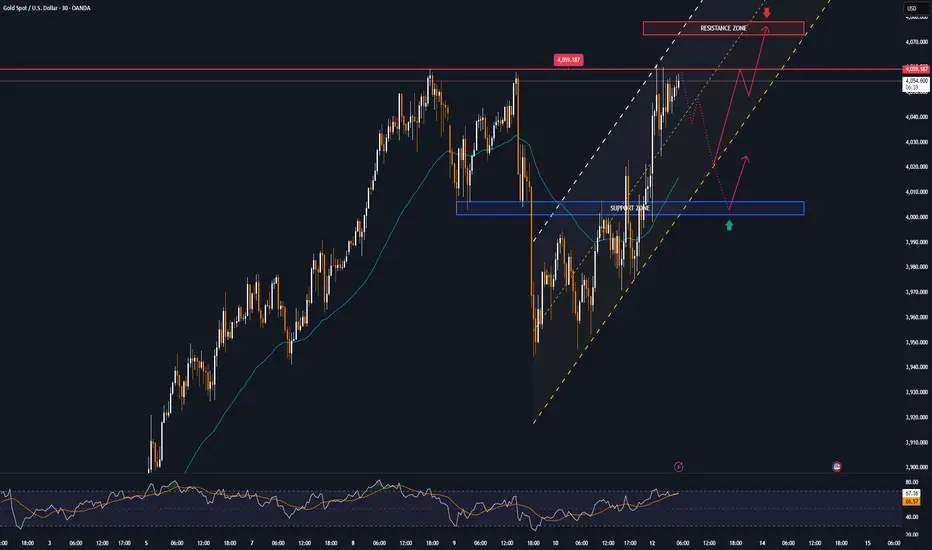
4300 is just the beginning, it is expected to reach 4500Affected by the continued impact of the US government shutdown, gold in the US market rose strongly. After hitting a high of 4292, it quickly fell back and rebounded, setting a new historical high of 4298. But judging from the current trend, this is obviously not the peak of gold prices. If the short-term rise continues, it is expected to test the pressure of the 4,300 integer mark.
As the short-term trend line is broken, the previous resistance is gradually transformed into support. Pay attention to the short-term support range of 4275-4260 below. If this range can be held, gold will set a new high.
OANDA:XAUUSD

GOLD Sellers In Panic! BUY!
My dear followers,
This is my opinion on the GOLD next move:
The asset is approaching an important pivot point 4265.9
Bias - Bullish
Safe Stop Loss - 4248.0
Technical Indicators: Supper Trend generates a clear long signal while Pivot Point HL is currently determining the overall Bullish trend of the market.
Goal - 4300.3
About Used Indicators:
For more efficient signals, super-trend is used in combination with other indicators like Pivot Points.
Disclosure: I am part of Trade Nation's Influencer program and receive a monthly fee for using their TradingView charts in my analysis.
———————————
WISH YOU ALL LUCK

Oct 17, 2025 - XAUUSD GOLD Analysis and Potential Opportunity🔍 Key Levels to Watch:
• 4390 – Bullish target
• 4381 – Resistance
• 4372 – Resistance
• 4360 – Resistance
• 4354 – Resistance
• 4342 – Key resistance
• 4330 – Support
• 4325 – Support
• 4318 – Support
• 4312 – Support
📈 Scalping Strategy:
BUY: If price holds above 4342 → target 4345, with further upside toward 4350, 4354, 4358
SELL: If price breaks below 4330 → target 4325, with further downside toward 4318, 4312, 4300

Up or down ?!Given the slope and momentum of the last wave and other evidence such as analysis and the number of last microwaves, it seems that it will reach $400 very soon and then $3,850.

SMART MONEY CONCEPT (SMC)📊 Bullish Analysis XAU/USD (15M)
The market showed a clear Change of Character (CHoCH) to the downside, triggering a sell-off that swept Sell-Side Liquidity and tapped into the 1H Order Block (OB). From this level, price reacted with strength.
After the sweep, we observed a Break of Structure (BOS) to the upside, signaling possible institutional absorption. The Fake Out highlights how retail traders get trapped while institutions prepare to reposition.
🔑 Projected Scenario
• Entry zone at 4,211 (support/rejection area).
• Stop Loss at 4,156 → R/R 1:2.
• Target (TP) at 4,322.
• Expect a Rejection → Distribution → Continuation before price reaches the target.
📌 Key Takeaways
• Institutions often manipulate liquidity before continuation.
• The setup is aligned with Smart Money Concepts: liquidity sweep → rejection → bullish continuation.
• Patience is key to wait for confirmation candles at the entry zone.
✨ Motivational Note
Trading is not about chasing moves, but about preparing for the right moment. Patience and discipline separate professionals from amateurs. 🚀 GOOD LUCK TRADERS ;)

GOLD short4286-4311 are key levels that I'll be expecting gold to retrace to before going short again, respecting the double top...
