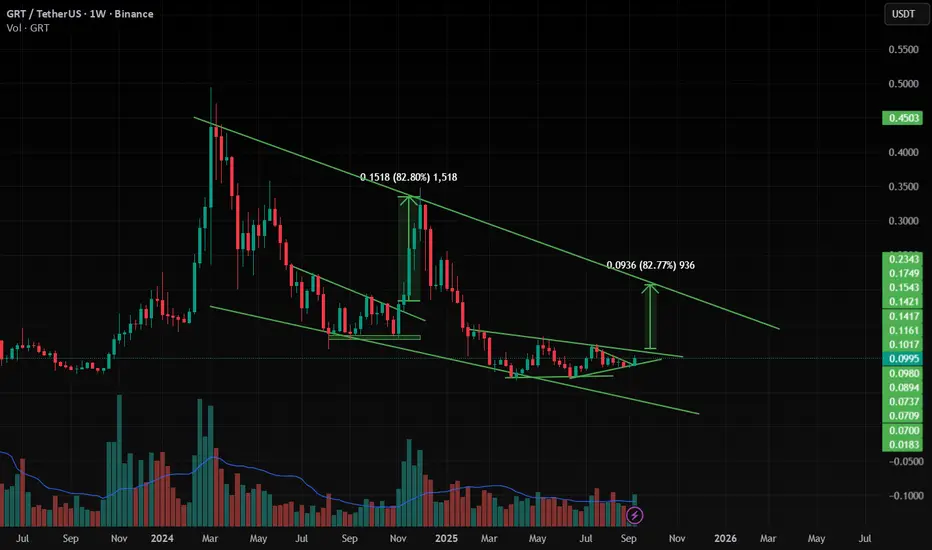
$grtGETTEX:GRT currently in & out of the $1 handle…
Crucial, low end watch $0.89, same thing across the board! Allow some dips for q4 to set.
If we can reclaim the $1 handle we should push on into $2 easily.
Long term projection is to take back $8-$9.

GRT Targets $0.11 as Market Structure ShiftsAfter a corrective phase, GRT has shown signs of recovery. Price swept liquidity at the value area high and reacted strongly off the point of control, which aligned with the golden Fibonacci level. This bounce indicates that demand is re-entering the market.
Key Technical Points
- Support Cluster:
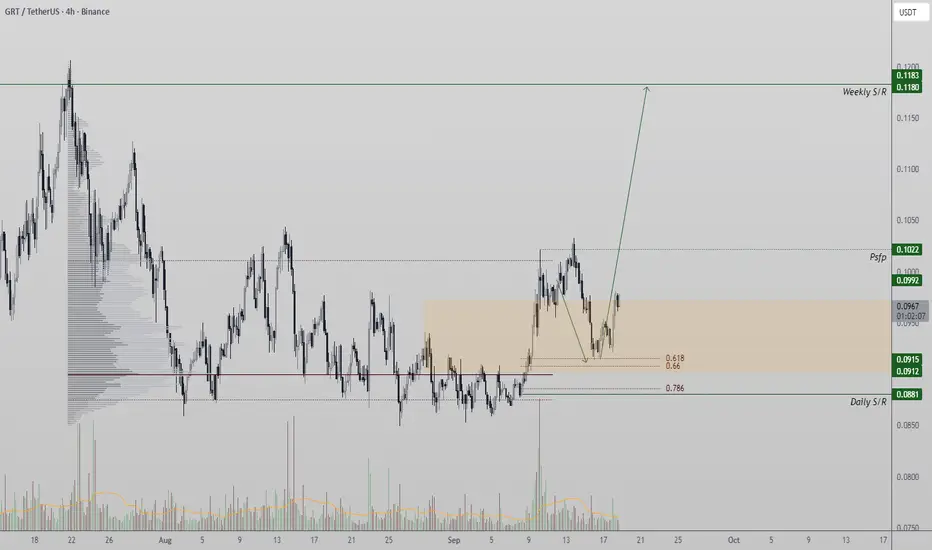
GRT is ready to move 80% Up GRT is moving inside the Triangle or Flag or wedge , and when it is breaking from pattern at support giving good move .
and at the same time Bitcoin dominance is decreasing and altcoins dominance is started increasing , so look on all the altcoins.
and follow proper risk management , it has very g
GRT. USDTThe Graph(GRT) is a Web 3 project that is used to search data from other platforms, such as Ethereum.
Similarly, AI (Artificial intelligence) developers can use it to promote their services.
And it has been in a neutral trend for a long time after a sharp correction.
Therefore, the probability of pr

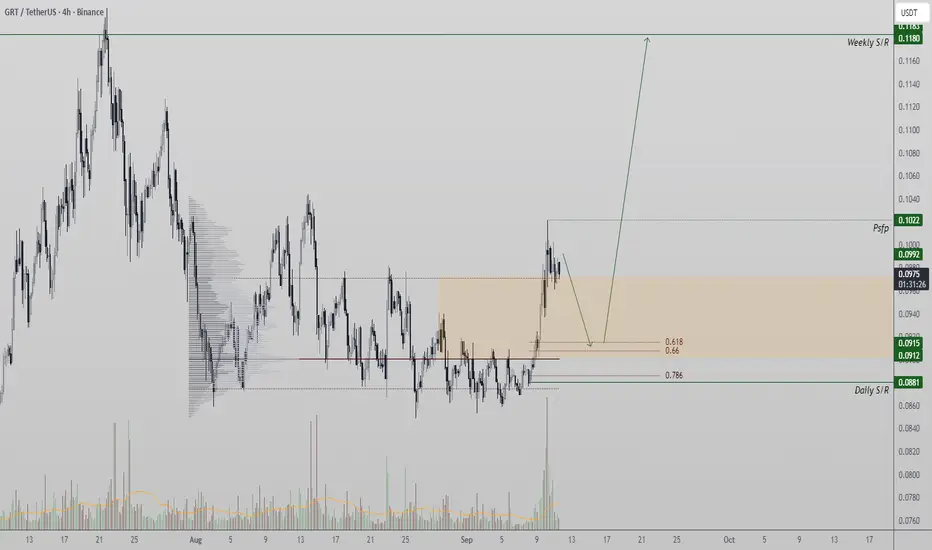
GRT Consolidates for a Potential Rally Toward $0.11After reclaiming its point of control, GRT has entered a healthy consolidation phase. This pause in momentum sets the stage for a potential continuation of the uptrend if buyers defend current levels.
Key Technical Points:
- Reclaimed point of control following impulsive move.
- Consolidation nea
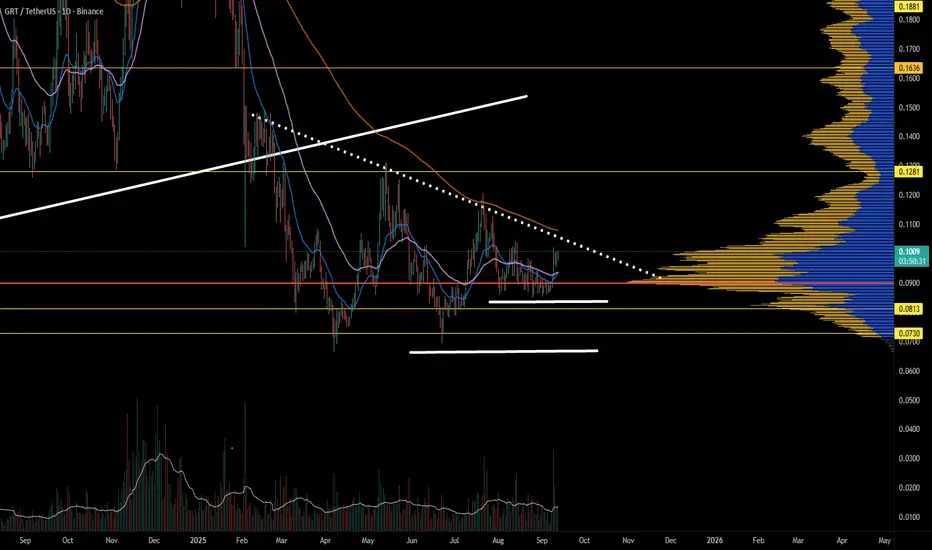
GRTUSDT 1D#GRT is moving within a symmetrical triangle on the daily chart. A retest of the daily SMA100 is possible before the next bullish wave. If it breaks out above the triangle, the potential targets are:
🎯 $0.1157
🎯 $0.1376
🎯 $0.1587
🎯 $0.1797
🎯 $0.2098
⚠️ Always remember to use a tight stop-loss and

GRTUSDT UPDATE#GRT
UPDATE
GRT Technical Setup
Pattern : Bullish Falling Wedge pattern
Current Price: $0.0978
Target Price: $0.155
Target % Gain: 54.87%
Technical Analysis: GRT is breaking out from a bullish falling wedge on the 1D chart. The breakout above resistance shows strong upside potential with room to

The Graph is finding its bottomGRT is slowly building a structure close enough to all-time lows. These are the scenarios that make for great risk-to-reward ratios. The current structure will confirm a reversal once an HH is produced; until then, we are in a range holding above invalidation.
GRT primed for breakoutThe Graph (GRT) Token Market Status
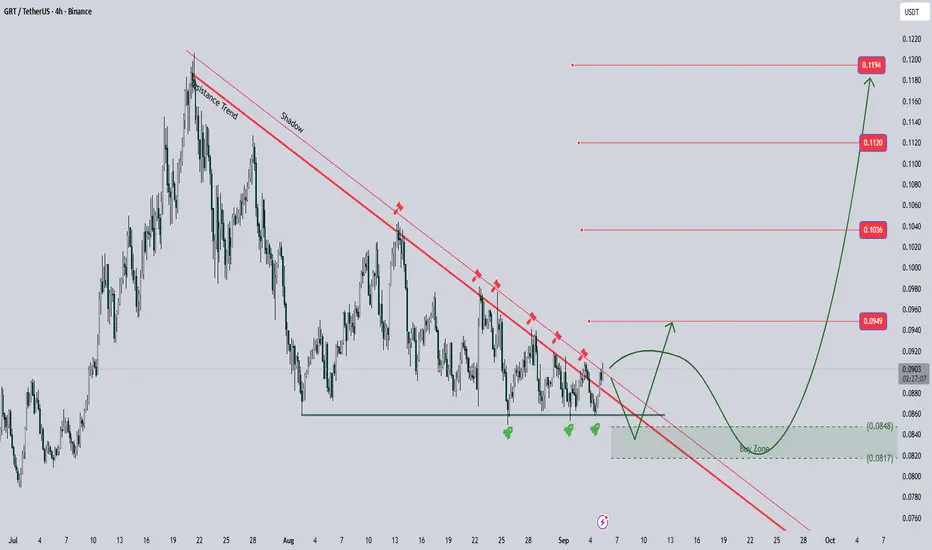
BINANCE:GRTUSDT is in a downtrend that has been weakening over the past few days. It has found strong support in the price range of $0.0850 - $0.0860. Each time this support holds, it leads to an upward movement toward the downtrend line, where we've seen sev
GRT Price Squeezes Toward Expansion as $0.11 Level HoldsGRT is consolidating in a weekly equilibrium above key Fibonacci support, with tightening Bollinger Bands signaling a likely volatility expansion. Bulls are watching the $0.11 level as the launchpad for a move toward $0.24.
The Graph (GRT) is showing signs of strength within its current trading ran

See all ideas
Summarizing what the indicators are suggesting.
Oscillators
Neutral
SellBuy
Strong sellStrong buy
Strong sellSellNeutralBuyStrong buy
Oscillators
Neutral
SellBuy
Strong sellStrong buy
Strong sellSellNeutralBuyStrong buy
Summary
Neutral
SellBuy
Strong sellStrong buy
Strong sellSellNeutralBuyStrong buy
Summary
Neutral
SellBuy
Strong sellStrong buy
Strong sellSellNeutralBuyStrong buy
Summary
Neutral
SellBuy
Strong sellStrong buy
Strong sellSellNeutralBuyStrong buy
Moving Averages
Neutral
SellBuy
Strong sellStrong buy
Strong sellSellNeutralBuyStrong buy
Moving Averages
Neutral
SellBuy
Strong sellStrong buy
Strong sellSellNeutralBuyStrong buy
Displays a symbol's price movements over previous years to identify recurring trends.