Tesla vs. BYD: The Market’s Greatest IllusionIntroduction: The Tale of Two Companies
You don’t need to be an economist to see it. Just compare Tesla and BYD.
BYD: Founded in 1995, Chinese, over $107 billion in revenue.
Tesla: Founded in 2003, American, with less revenue—but a market cap six times bigger.
The reason? Because one sells cars, and the other sells dreams. And Wall Street loves a good dream.
The Illusion Economy: When Hype Outweighs Reality
Tesla’s valuation isn’t tied to assets, production, or profits. It’s a ritual of collective belief—a performance act where branding replaces substance, and expectation outweighs reality.
It’s the same logic behind a $1,000 jacket that costs $100 to make. Put a fancy logo on it, and suddenly, it’s not overpriced—it’s "premium." You're not just buying a product; you're investing in a lifestyle. Sure. Keep telling yourself that.
Tesla is the $1,000 jacket. BYD is the actual tailor shop.
Tesla vs. BYD: The Numbers Tell the Story
Tesla’s market cap is over $1 trillion, while BYD’s is under $200 billion. Yet, BYD outsells Tesla globally, especially in China, where it dominates the EV market. Tesla’s valuation is built on brand perception, future promises, and speculative optimism, while BYD’s is grounded in actual production and revenue.
Financial Storytelling Over Business Reality
Tesla isn’t just a car company—it’s a financial illusion. Markets rise not on performance, but on promise. Stock prices reflect not what a company is, but what a hedge fund feels it might become. It’s not a business model—it’s mood swings with decimal points.
BYD’s Competitive Edge
Production Power: BYD manufactures more EVs than Tesla annually.
Battery Innovation: BYD’s Blade Battery is safer, lasts longer, and is cheaper than Tesla’s.
Affordability: BYD’s EVs are significantly cheaper, making them more accessible to global consumers.
Market Reach: BYD dominates China, the world’s largest EV market, while Tesla struggles with pricing and competition.
The Consequences of Buying the Dream
Tesla’s valuation isn’t creating better cars. It’s just creating dumber investors.
Investors who think they’re visionaries because they bought into the hype.
Consumers who think they’re elite because they bought the label.
Boards who think they’re gods because someone inflated their stock ticker.
But every illusion has an expiration date. Every bubble has its needle. And when dreams are sold on credit, reality always comes to collect.
Reality Always Comes to Collect
This isn’t growth. It’s speculative theater funded by your retirement account.
Real value doesn’t need hype. It appears in supply chains, production lines, tangible goods, and on profit sheets that make sense even without a TED Talk.
So next time you see Tesla’s trillion-dollar valuation, ask yourself: Are you investing in a business? Or are you just buying the dream—before it bursts?
TL0 trade ideas

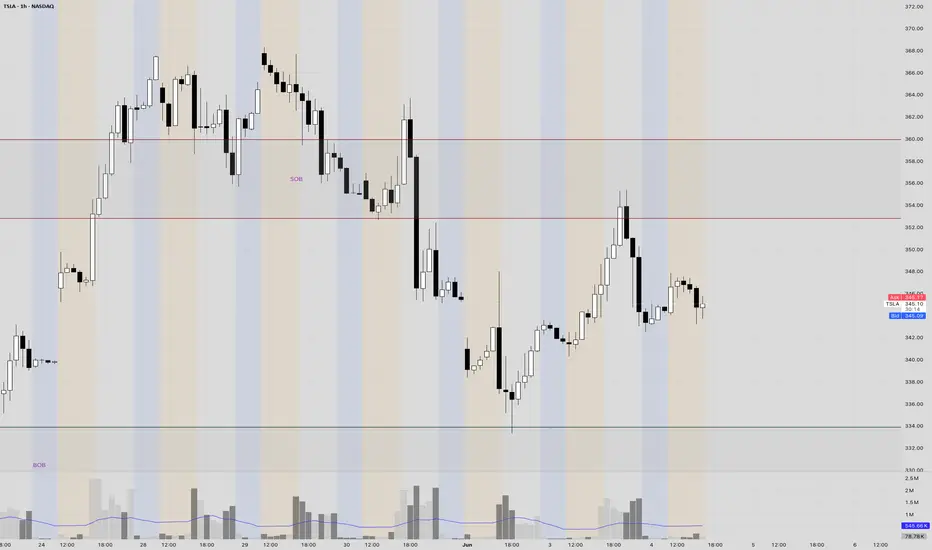
INTRADAY TSLA. SHORT @ 352. LONG @ 333. Overview -
TSLA is showing declining sales and low vehicle registration in the many countries. Although, that hasn't deterred the stock holder into panic selling, we aren't bullish on TSLA but we aren't necessarily bearish either. The market trend is going to determine the immediate direction today. We will go with a slightly bearish approach on TSLA, mainly because it was rejected from the 365 area despite trying to hold it.
The important levels in the premarket are 343 and 348.
INTRADAY TRADE PLAN -
1. If the stock opens at 345 and plummets to 343, where it confirms strength. We LONG till 348. Take a partial out at 343 and put a trailing stop.
2. If the stock opens at 345 and rallies to 348, where it confirms weakness. We SHORT till 343. Take a partial out at 343 and put a trailing stop.
3. If the stock goes till 343 and consolidates. We observe the volume footprint and side with the sellers if they are dominant. If the buyers show strength instead, then we do nothing and wait for the price to drop lower.
4. If the stock goes till 348 and consolidates. We observe the volume footprint and side with the sellers if they are dominant. We stay back if buyers are showing strength. We wait for the price to drop a little and verify if the buyer strength hold even stronger at the lower levels. Once we confirm it, we go LONG at 345 or 343.
5. If the stock goes straight to 352-355 area. We wait for even the slightest sellers aggression and we go SHORT until 345 area (or any other area where we see buying presence).
6. If the stock goes straight to 333-336 area. We wait for the buyers to step up with a little aggression and we go LONG until 348 area (or any other area where we see selling presence).
TSLA ready to go down if you want to sell your sharesBased on My geometry trading strategy
I believe tesla will drop down to break the low in Feb.
so lets see id this will be true

TSLA Weekly Options Outlook — June 3, 2025📉 TSLA Weekly Options Outlook — June 3, 2025
🚨 AI Model Consensus: Moderately Bearish into June 6 Expiry
🧠 Model Breakdown
🔹 Grok (xAI)
Bias: Bullish (Contrarian)
Setup: 5-min RSI oversold (~23.5); daily momentum weakening.
Trade: Buy $372.50C @ $0.88 → Bounce play
Confidence: 65%
🔹 Claude (Anthropic)
Bias: Bearish
Setup: Daily/M5 MACD bearish; RSI oversold; max pain magnet at $340
Trade: Buy $340P @ ~$5.55
Confidence: 75%
🔹 Llama (Meta)
Bias: Bearish
Setup: Below EMAs; RSI oversold; mixed longer-term read
Trade: Buy $342.50P @ $6.65
Confidence: 70%
🔹 Gemini (Google)
Bias: Bearish
Setup: Daily MACD bearish crossover; oversold short-term
Trade: Buy $320P @ $1.06
Confidence: 65%
🔹 DeepSeek
Bias: Bearish
Setup: MACD and EMAs confirm bearish setup; near max pain
Trade: Buy $340P @ $5.60
Confidence: 75%
✅ Consensus Summary
📉 4 of 5 models favor puts on TSLA
🧲 Max Pain at $340 is the dominant magnet
📉 Bearish MACD across timeframes; under EMAs
🔄 Short-term RSI is oversold — bounce risk acknowledged
📰 Mixed Tesla headlines & falling VIX offer minor support
🎯 Recommended Trade
💡 Strategy: Bearish Naked Weekly Put
🔘 Ticker: TSLA
📉 Direction: PUT
🎯 Strike: $340
💵 Entry: $5.60
🎯 Profit Target: $8.40 (+50%)
🛑 Stop Loss: $4.48 (−20%)
📏 Size: 1 contract
📅 Expiry: 2025-06-06
⏰ Entry Timing: Market Open
📈 Confidence: 73%
⚠️ Key Risks to Watch
🔄 Bounce Risk: RSI oversold — snapback could occur
📰 Tesla news (Powerwall, China) could surprise to upside
🧲 Max pain at $340 may anchor price near entry
⌛ Weekly theta decay means early move is essential

TSLA weekly cup and handleNASDAQ:TSLA
Last week, the daily chart on TSLA showed a cup and handle formation. Price attempted to break up but rejected overhead supply in the 360s. Price action is starting to show the formation of a handle on the weekly chart that may present a stronger move in the coming weeks to break through the 360 resistance level and overhead supply. June tends to be a strong month for TSLA historically, so the move could happen by the end of the month. Strong break of 360 and a close over to confirm a projected movement to $400 as a first price target, with $420.69 as a secondary PT.

TSLA LONG 🚨 NASDAQ:TSLA Play – June Catalyst Incoming 🚨
Seeing bullish divergence on the RSI – momentum’s shifting even as price consolidates. Classic setup for a breakout.
Pair that with the RoboTaxi event dropping June 12, and this becomes more than just a technical bounce – we’ve got a real catalyst on deck that could reshape the narrative.
Loaded up here. Risk/reward looks 🔥 ahead of the event.
Tesla Bearish Daily Reversal Harmonic Butterfly patternWaiting for the Formation of LHs and LLs
Divergence before the D point confirms Potential Reversal Zone
Hypothetical Calculation of Potential Target Points
A bit of Rare Pattern Bearish Butterfly

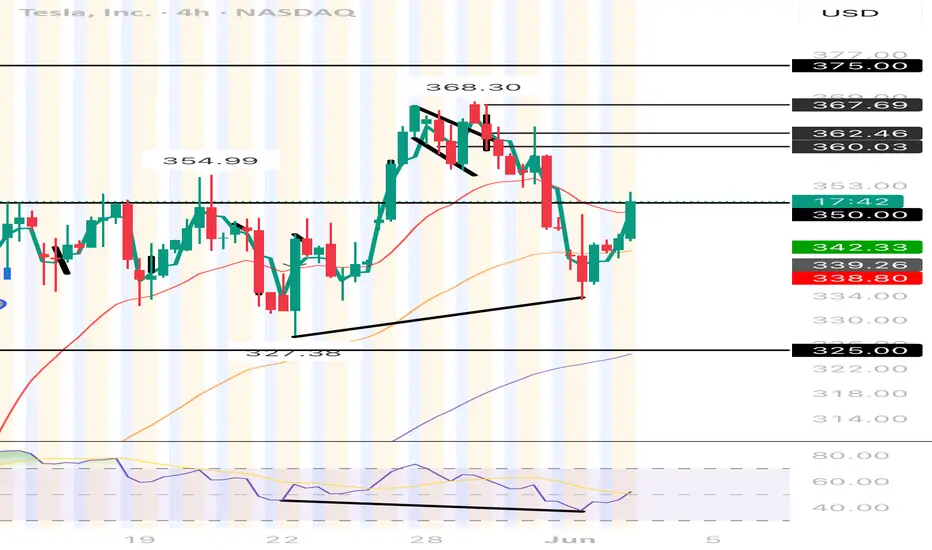
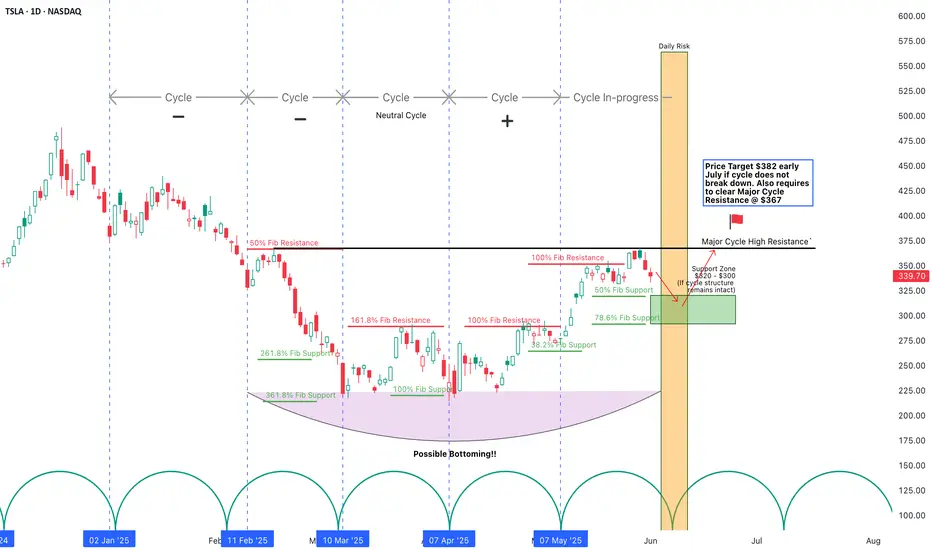
Potential to breakout to $380+Price Target $382 early July if cycle does not break down. Also requires to clear Major Cycle Resistance @ $367. There is a clear bottoming on the Daily. However $367 remains key resistance. Need to breakout and successfully retest the level.
TSLA - In BIG TroubleBearish times ahead with bounces along the way 🪓.
40 minutes spent on this chart, so if you like the effort then hit the BOOST and leave a comment if you like 👍.
Not advice.

TSLATesla is in a correction phase, the price has a chance to test the support zone 246-218. If the price can stay above 218, it is expected that the price will have a chance to rebound. Consider buying the red zone.
🔥Trading futures, forex, CFDs and stocks carries a risk of loss.
Please consider carefully whether such trading is suitable for you.
>>GooD Luck 😊
❤️ Like and subscribe to never miss a new idea!

TSLA – Something Big Is Brewing🚀Tesla just keeps pushing. Now trading around $346, it's not just riding market momentum — it's building it. And with the robotaxi launch in Austin coming June 12, the narrative might be shifting from “just EVs” to mobility revolution.📍 Levels I’m Watching
Possible entries:
• $335–$325 – Looks like it’s consolidating here
• $315–$290 – Clean retest zone if we dip
• $265 – Would love a deeper pullback but not counting on it
Targets?
• $370 – Short-term test
• $395 – Momentum breakout zone
• $420+ – If the hype around robotaxis takes hold
⚠️ Disclaimer: This isn’t financial advice. Just sharing how I see things. Do your own research and trade safe.
💬 If this helped, drop a like and follow. I post trades that actually make sense not just moonshots.
Let’s grow smart. 📈🧠

TSLA PRICE ACTION 1ST JUNE 2025This is the updated price action of Tesla. I have explained why I exited long positions. If you have any doubts, then feel free to leave a comment below.
NOTE: STAY AWAY FROM TSLA LONGS

Trade of the week: $TSLA (Short)Trade of the week: NASDAQ:TSLA (Short)
Current price: $346
Entry Trigger:$339
Stoploss: $353
Call option: NASDAQ:TSLA $300 put expiry 06/20 at $4.45(*1 Contract only)
Thesis: NASDAQ:TSLA is in daily uprising channel aka building a wedge. NASDAQ:TSLA last week made a doji candle on weekly often that leads to reversal. You may take this trade at entry trigger point or You may find a cheaper entry or wait for trigger point (or me) to get into the trade. Contract price might vary depending on entry. Targeting sub $310 in upcoming weeks. Respect stoploss.

TSLA UptrendTesla has regained an uptrend in a motive wave.
In my primary count, we are currently close to finishing green III of blue 3.
Pullbacks into support zones are buying opportunities.
TESLA: Short Trade with Entry/SL/TP
TESLA
- Classic bearish formation
- Our team expects pullback
SUGGESTED TRADE:
Swing Trade
Short TESLA
Entry - 345.78
Sl - 360.55
Tp - 309.96
Our Risk - 1%
Start protection of your profits from lower levels
Disclosure: I am part of Trade Nation's Influencer program and receive a monthly fee for using their TradingView charts in my analysis.
❤️ Please, support our work with like & comment! ❤️

TSLA (Daily) Elliot Wave 3 UnderwayTSLA appears to still be printing a motif wave 3 after finding a bottom at the $208 high volume support node. Fib extension targets suggest we have much higher to go including a new all time high.
Upside resistance target sits just below $413 in the HVN.
Downside targets may test the previous swing high $284
Safe trading

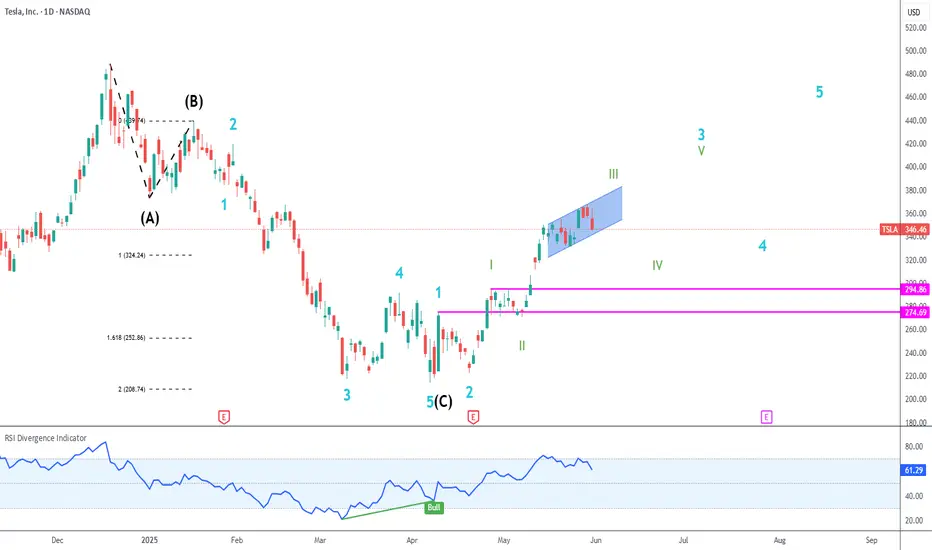
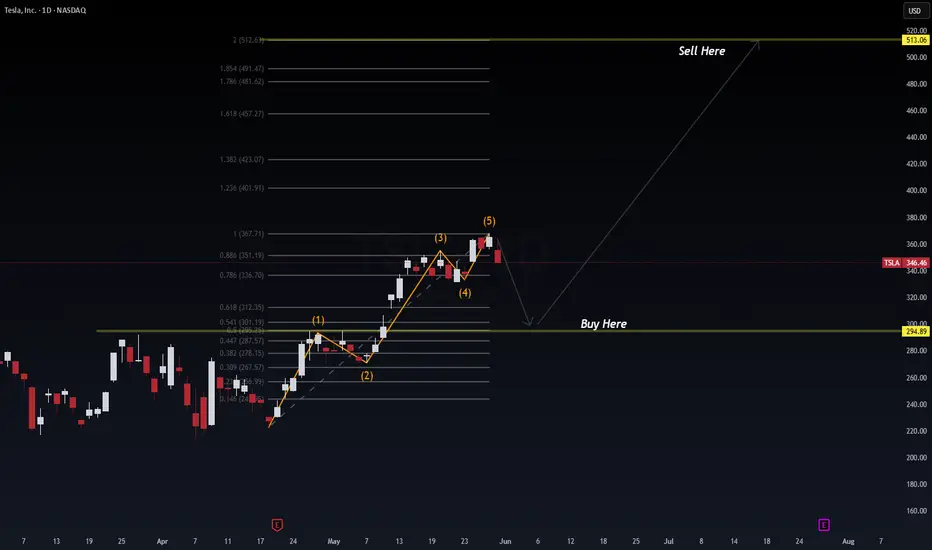
TSLA (Tesla) – Elliott Wave Impulse Ending + Fibonacci CorrectioTesla completed a textbook 5-wave Elliott impulse to the upside, topping out near the 1.0 Fibonacci extension ($367.71). We're now seeing signs of a corrective wave likely targeting the golden zone near $294.89 — aligning with SPY/NVDA retracements.
🔍 Elliott Wave Count:
Wave (1): Impulse from breakout
Wave (2): Shallow pullback
Wave (3): Extended rally
Wave (4): Minor correction
Wave (5): Final push – now failing
📉 Fibonacci Zones:
Current Price: $346.46
Wave 5 Completion: ~$367
Retracement Target: $294.89 (0.5–0.618 confluence)
Extension Target: $513.06 (2.0 extension from wave base)
📊 Probabilistic Outlook
🔻 Correction to $294.89 = 70% probability (based on wave structure + Fib retracement logic)
🔼 Rally to $513+ = 60% probability if support holds and market conditions remain risk-on
🌐 Macro Alignment (May 31, 2025)
🔄 Market rotation into value → temporary tech cooldown
📉 NVDA false breakout and SPY retracement suggest broader pullback
🧠 Tesla is a beta-multiplier to NASDAQ; expect correlation
🧭 Trade Plan:
Buy Zone: $294.89 (watch for confirmation + volume spike)
Sell Target: $513.06 (Fib 2.0 extension)
Stop: Below $278 (structure invalidation)
🧠 Pro Insight:
This is a Wave 2/4 retracement zone where institutions often reload. The broader macro pullback may present one of the last deep dips before a Q3 breakout.
#TSLA #ElliottWave #FibLevels #TechStocks #SmartMoney #SwingTrade #NASDAQ #WaverVanir #TradingView
TslaFirst off.. that weekly candle was horrendous
Rising wedge here.. you can see it on the rsi as well
The target of this rising wedge is 300 or daily 200sma..
Lets see how wed get there..
We would need to break below 330.00.
351-355 will be strong resistance if you see a test up in that area I would open a short for 330... cover at 330 and wait for the break below to short for 300
The sector tsla trades under is XLY..
I was saying for the last few days that tsla will have trouble unless XLY could clear 218.. now XLY has finished with a similar weekly reversal candle

Pullback time?As it seems, the pullback might be here. I'm looking at one interesting level, if the price doesn't drop to that level, it's super bullish. GAP and Ma 200 area 300-310 ish

Tesla Sell Signals- 05/30/25Tesla Inc. has several bearish signals.
On 05/29/25 it peaked close to 02/19/25 top.
RSI on 05/29/25 had a bearish divergence vs. its 05/14/25 reading. Also, the reading on 05/30/25 was below the reading made at 05/21/25, predicting price could go down to the where it was on 05/21/25.
Stochastic has a bearish line cross in the overbought zone above 80.00.
On 05/30/25 the price went below the low of the big up bar made on 05/27/25.
First support is in the 285 to 270 area.
Price could ultimately go much lower.

Tesla: Completed!TSLA has moved somewhat closer to the resistance at $373.04 since our last update, but these gains have now been tempered. We now consider the turquoise wave 4 as finished and anticipate imminent sell-offs during wave 5. These should eventually complete the magenta wave (3) of a larger downward impulse below the support at $215.01. However, due to recent upward momentum, we have increased the relevance of our alternative scenario. We now consider it 38% likely that the stock has already completed the large correction of the blue wave alt.(II) with the last significant low and will continue to rise directly during wave alt.(III). In this case, the price would next not only rise above the nearby resistance at $373.04 but also overcome the higher levels at $405.54 and $488.50.
📈 Over 190 precise analyses, clear entry points, and defined Target Zones - that's what we do.

Is This the Perfect Moment to Execute the Tesla Heist?💰 Tesla Stock Market Heist Blueprint 🚀
🌟 Hi! Hola! Ola! Bonjour! Hallo! Marhaba! 🌟
Dear Money Makers & Robbers, 🤑💰💸✈️
Here’s our grand plan: a 🔥Thief Trading Style heist🔥 targeting the TESLA stock! Let’s break in with this cunning strategy — chart-ready and primed for action!
🎯 Entry:
The vault’s open! Grab the bullish loot at any price — the heist is live!
Tip: For precision, use a buy limit order on 15m/30m swing highs or lows — that’s your perfect pullback entry!
🛑 Stop Loss:
Thief SL is stashed at the nearest swing low (or just below the MA on the daily chart ~300.00 for swing trades).
Tailor SL to your trade risk, lot size, and your thieving gang’s order plan.
🏴☠️ Target:
460.00 — or vanish before hitting the target to avoid the traps of the overbought zone!
💎 The Setup:
We’re seeing bullishness fueled by key factors: macro moves, fundamentals, sentiment, intermarket trends… it’s all in play! 📈🔗🌏
Check the macro, COT report, sentiment outlook, and future trend targets to stay ahead of the game!
⚠️ Trading Alert:
News releases can flip the game fast.
Avoid fresh trades during major news.
Use trailing stops to lock in those juicy profits and protect your loot.
❤️🔥 Support the Heist Crew!
💥Hit the Boost Button💥 — fuel our robbery plans and let’s keep cashing in every day!
The Thief Trading Style: slick, powerful, and ready for the next heist.
See you soon with another plan, fellow robbers! 🤑🐱👤🤩

Musk Steps Away from Politics: What Does It Mean for Tesla?Musk Steps Away from Politics: What Does It Mean for Tesla (TSLA) Stock?
Yesterday, it was announced that Elon Musk will be stepping down from the Trump administration as his term as head of DOGE—where he focused on reducing government spending—has come to an end.
This decision follows his statement at the economic forum in Qatar, where Musk said he plans to focus less on politics, as he feels he has already done enough in that realm.
What Does This Mean for Tesla (TSLA) Stock?
Musk’s move away from politics is likely a positive signal for investors. Here's why:
→ The company’s CEO can now devote more time to addressing issues such as declining vehicle sales in Europe;
→ Musk’s role at DOGE will no longer pose reputational risks for Tesla..
During yesterday’s main trading session, TSLA stock surged to $367—its highest level since mid-February.
Technical Analysis of TSLA Stock Chart
The price continues to hover near the upper boundary of an ascending channel (marked in blue), which could pose a challenge for further upward movement.
Additionally, the price has entered the $355–$375 range—a zone that previously triggered significant reversals (as indicated by arrows). Notably, there was a sharp decline from this zone between February 21–26. From a bearish standpoint, this area could act as resistance, and the candle’s close near its low yesterday supports this view.
From a bullish perspective, the fundamental outlook may still provide upward momentum:
→ A joint press conference with Trump and Musk is scheduled for today;
→ In early June, Tesla is expected to begin testing its autonomous taxis.
So, while a continued uptrend is possible, a short-term correction would seem reasonable after TSLA’s nearly 27% surge throughout May.
This article represents the opinion of the Companies operating under the FXOpen brand only. It is not to be construed as an offer, solicitation, or recommendation with respect to products and services provided by the Companies operating under the FXOpen brand, nor is it to be considered financial advice.
