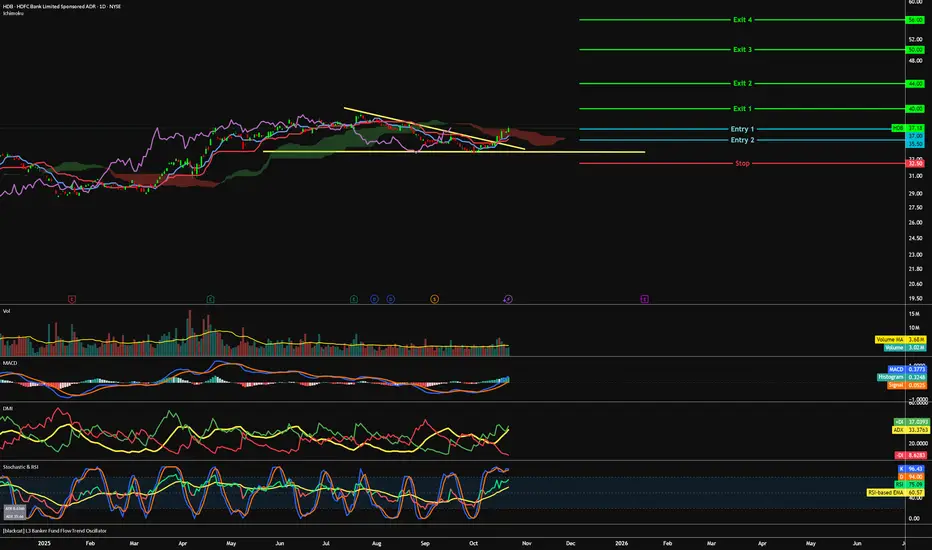
HDFCBANK - RISING WEDGE PATTERN BREAKOUT [ SELL SIDE ]I am not a SEBI-registered investment advisor. The information provided here is for educational and informational purposes only and should not be construed as financial or investment advice. Please do your own research or consult with a SEBI-registered financial advisor before making any investment
Next report date
—
Report period
—
EPS estimate
—
Revenue estimate
—
47.25 INR
707.92 B INR
4.75 T INR
15.35 B
About HDFC Bank Limited
Sector
Industry
CEO
Kapila Deshapriya
Website
Headquarters
Mumbai
Founded
1994
ISIN
INE040A01034
FIGI
BBG000F8XD00
HDFC Bank Ltd. engages in the provision of banking and financial services, including commercial banking and treasury operations. The firm also provides financial services to upper and middle income individuals and corporations in India. It operates through the following segments: Treasury, Retail Banking, Wholesale Banking and Other Banking Operations. The Treasury segment consists of bank's investment portfolio, money market borrowing and lending, investment operations and trading in foreign exchange and derivative contracts. The Retail Banking segment provides loans and other services to customers through a branch network and other delivery channels. The Wholesale Banking segment provides loans, non-fund facilities and transaction services to large corporates, emerging corporates, public sector units, government bodies, financial institutions, and medium scale enterprises. The Other Banking Business segment includes income from para banking activities such as credit cards, debit cards, third party product distribution, primary dealership business, and the associated costs. The company was founded by Aditya Tapishwar Puri in August 1994 and is headquartered in Mumbai, India.
Related stocks

BANKNIFTY WEIGHTAGE STOCKS INDEX..Support and Resistance Levels: In technical analysis, support and resistance levels are significant price levels where buying or selling interest tends to be strong. They are identified based on previous price levels where the price has shown a tendency to reverse or find support.

NIFTY WEIGHTAGE STOCKS INDEX..Support and Resistance Levels: In technical analysis, support and resistance levels are significant price levels where buying or selling interest tends to be strong. They are identified based on previous price levels where the price has shown a tendency to reverse or find support.

HDB - Banking on uptrend continuation=======
Volume
=======
- slight increase
==========
Price Action
==========
- Broken out of latest downtrend
- Supported at $34
=================
Technical Indicators
=================
- Ichimoku
>>> price above cloud
>>> Green Kumo Budding
>>> Tenken - Within clouds & piercing up
>>> Kijun
HDFC Bank: Major Red Band Resistance LevelHDFC Bank: Major Red Band Resistance Level.
( Not a Buy / Sell Recommendation
Do your own due diligence ,Market is subject to risks, This is my own view and for learning only .)

HDFC Bank Ltd for 6th Oct #HDFCBANK HDFC Bank Ltd for 6th Oct #HDFCBANK
Resistance 970 Watching above 971 for upside momentum.
Support area 960 Below 960 gnoring upside momentum for intraday
Watching below 957 for downside movement...
Above 970 ignoring downside move for intraday
Charts for Educational purposes only.
Please follow

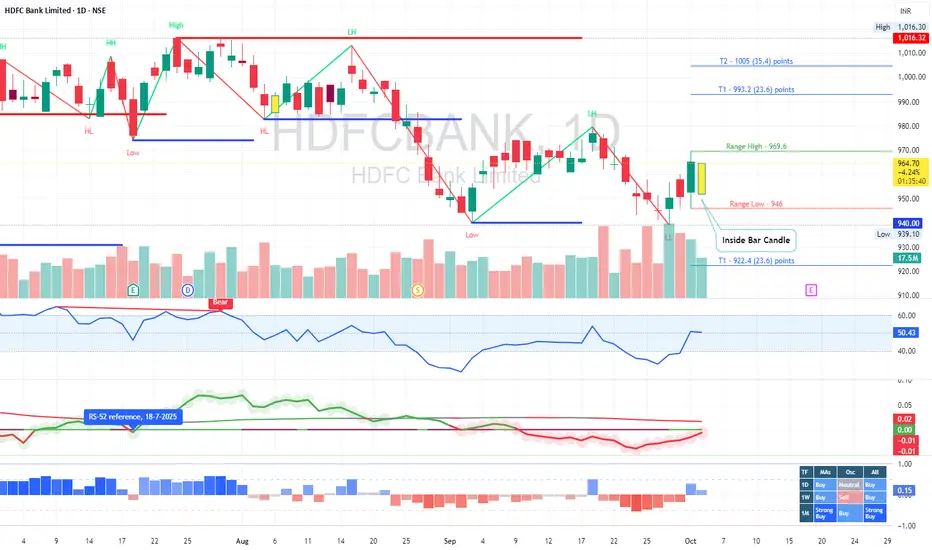
HDFC BankHDFC Bank forming Inside Bar Candle
Means BNF will bullish if Resistance has been crossed
this is before closed market level after we need to check level
Resistance 965
support 952
Expected level 979 / 983 / 993 / 1005

HDFCBANK, 1D, Support, LongHDFCBANK has taken a good support at this level. If it closes above 360 then it may go upto 370 and 390.
Entry : 960
Target1: 970
Target2: 990

New High is Coming In HDFCbank ??Hdfcbank taken support and pushing upside. Seem like new high is coming in few days

See all ideas
Summarizing what the indicators are suggesting.
Neutral
SellBuy
Strong sellStrong buy
Strong sellSellNeutralBuyStrong buy
Neutral
SellBuy
Strong sellStrong buy
Strong sellSellNeutralBuyStrong buy
Neutral
SellBuy
Strong sellStrong buy
Strong sellSellNeutralBuyStrong buy
An aggregate view of professional's ratings.
Neutral
SellBuy
Strong sellStrong buy
Strong sellSellNeutralBuyStrong buy
Neutral
SellBuy
Strong sellStrong buy
Strong sellSellNeutralBuyStrong buy
Neutral
SellBuy
Strong sellStrong buy
Strong sellSellNeutralBuyStrong buy
Displays a symbol's price movements over previous years to identify recurring trends.
H
815HEGI33A
HDFC ERGO General Insurance Company Limited 8.15% 20-FEB-2033Yield to maturity
—
Maturity date
Feb 20, 2033
See all HDFCBANK bonds
Curated watchlists where HDFCBANK is featured.

Indian stocks: Racing ahead
46 No. of Symbols
See all sparks
Frequently Asked Questions
The current price of HDFCBANK is 982.30 INR — it has decreased by −0.06% in the past 24 hours. Watch HDFC Bank Limited stock price performance more closely on the chart.
Depending on the exchange, the stock ticker may vary. For instance, on NSE exchange HDFC Bank Limited stocks are traded under the ticker HDFCBANK.
HDFCBANK stock has fallen by −1.54% compared to the previous week, the month change is a 1.09% rise, over the last year HDFC Bank Limited has showed a 12.63% increase.
We've gathered analysts' opinions on HDFC Bank Limited future price: according to them, HDFCBANK price has a max estimate of 1,390.00 INR and a min estimate of 1,046.00 INR. Watch HDFCBANK chart and read a more detailed HDFC Bank Limited stock forecast: see what analysts think of HDFC Bank Limited and suggest that you do with its stocks.
HDFCBANK reached its all-time high on Oct 23, 2025 with the price of 1,020.50 INR, and its all-time low was 1.20 INR and was reached on Jan 29, 1996. View more price dynamics on HDFCBANK chart.
See other stocks reaching their highest and lowest prices.
See other stocks reaching their highest and lowest prices.
HDFCBANK stock is 1.04% volatile and has beta coefficient of 0.94. Track HDFC Bank Limited stock price on the chart and check out the list of the most volatile stocks — is HDFC Bank Limited there?
Today HDFC Bank Limited has the market capitalization of 15.14 T, it has increased by 2.87% over the last week.
Yes, you can track HDFC Bank Limited financials in yearly and quarterly reports right on TradingView.
HDFC Bank Limited is going to release the next earnings report on Jan 19, 2026. Keep track of upcoming events with our Earnings Calendar.
HDFCBANK earnings for the last quarter are 12.10 INR per share, whereas the estimation was 11.29 INR resulting in a 7.17% surprise. The estimated earnings for the next quarter are 11.51 INR per share. See more details about HDFC Bank Limited earnings.
HDFC Bank Limited revenue for the last quarter amounts to 459.01 B INR, despite the estimated figure of 437.41 B INR. In the next quarter, revenue is expected to reach 460.44 B INR.
HDFCBANK net income for the last quarter is 196.11 B INR, while the quarter before that showed 162.58 B INR of net income which accounts for 20.62% change. Track more HDFC Bank Limited financial stats to get the full picture.
HDFC Bank Limited dividend yield was 1.20% in 2024, and payout ratio reached 23.70%. The year before the numbers were 1.35% and 21.57% correspondingly. See high-dividend stocks and find more opportunities for your portfolio.
As of Nov 7, 2025, the company has 214.55 K employees. See our rating of the largest employees — is HDFC Bank Limited on this list?
Like other stocks, HDFCBANK shares are traded on stock exchanges, e.g. Nasdaq, Nyse, Euronext, and the easiest way to buy them is through an online stock broker. To do this, you need to open an account and follow a broker's procedures, then start trading. You can trade HDFC Bank Limited stock right from TradingView charts — choose your broker and connect to your account.
Investing in stocks requires a comprehensive research: you should carefully study all the available data, e.g. company's financials, related news, and its technical analysis. So HDFC Bank Limited technincal analysis shows the sell today, and its 1 week rating is buy. Since market conditions are prone to changes, it's worth looking a bit further into the future — according to the 1 month rating HDFC Bank Limited stock shows the strong buy signal. See more of HDFC Bank Limited technicals for a more comprehensive analysis.
If you're still not sure, try looking for inspiration in our curated watchlists.
If you're still not sure, try looking for inspiration in our curated watchlists.