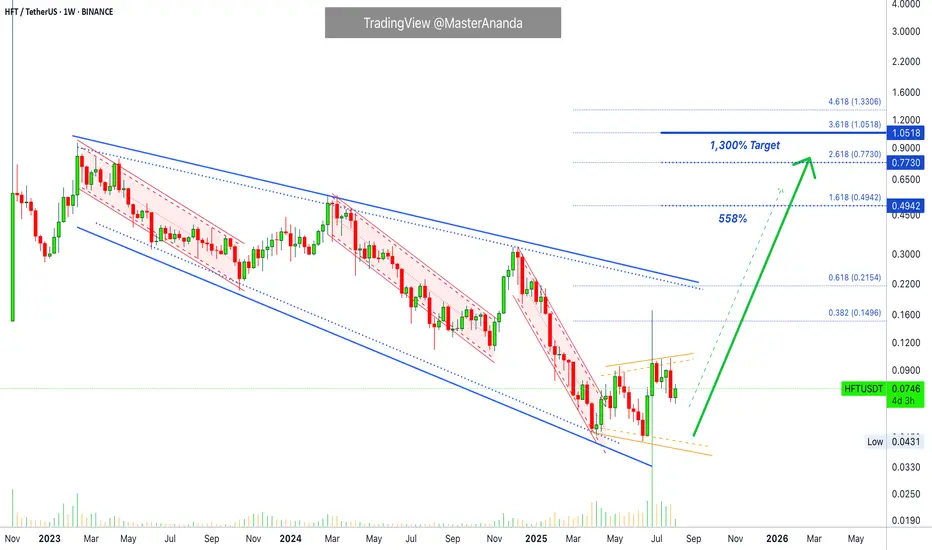
HFT/USDT — Will Bears Continue, or Will Bulls Take Control?Overview:
HFT has been trapped in a long-term downtrend since 2022, defined by the descending yellow trendline. Price is now consolidating at a critical zone, holding above strong support around 0.0431 (Low) while testing the descending trendline near 0.0969.
This is a make-or-break moment: will it

HFTUSDT UPDATE#HFT
UPDATE
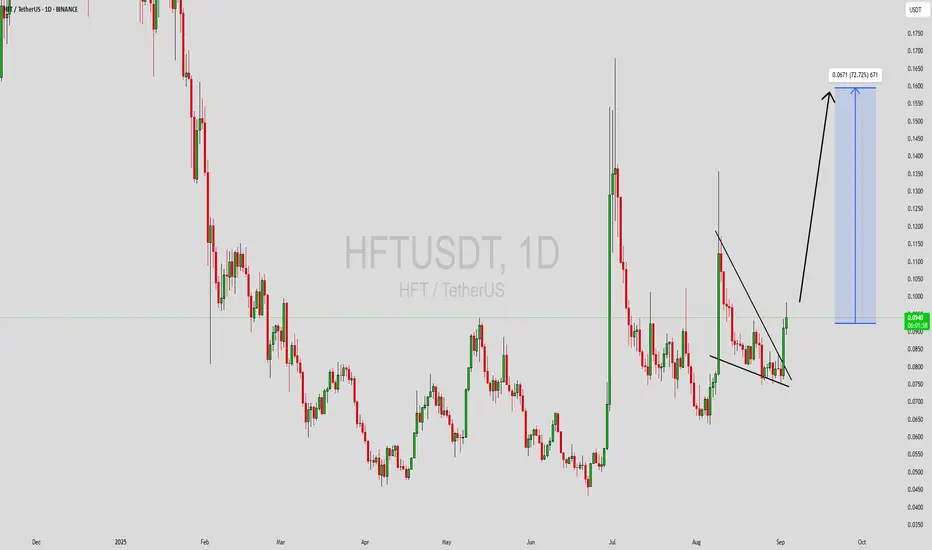
HFT Technical Setup
Pattern : Bullish Pennant Pattern
Current Price: $0.0937
Target Price: $0.158
Target % Gain: 72.25%
Technical Analysis: HFT is forming a bullish pennant on the 1D chart with a breakout attempt supported by recent volume. If the price sustains above the $0.09 break

HFTUSDT Forming Falling WedgeHFTUSDT is showing a promising setup as it forms a falling wedge pattern, a bullish reversal structure that often signals an upcoming breakout. This pattern develops when price action trends lower while narrowing its range, indicating selling pressure is weakening and buyers are preparing to take co
HFTUSDT | Bullish Momentum Gaining Strength!🚀 Trade Setup Details:
🕯 #HFT/USDT 🔼 Buy | Long 🔼
⌛️ Timeframe: 4H
--------------------
🛡 Risk Management:
🛡 If Your Account Balance: $1000
🛡 If Your Loss-Limit: 1%
🛡 Then Your Signal Margin: $42.64
--------------------
☄️ En1: 0.0928 (Amount: $4.26)
☄️ En2: 0.0848 (Amount: $14.92)
☄️ En3: 0.0796

HFT: One Last Pump Before the Dumpster?🚨 COINBASE:HFTUSD BINANCE:HFTUSDT — Quick Breakdown 🚨
📉 Structure
Clear bearish trend: lower lows, lower highs. Every time momentum hits overbought, we get another dump. Altseason? Highly unlikely to save this shitcoin.
📊 Price Action
June brought a bounce, but July almost completel

HFT - 100m gem primed for launch?I've been watching HFT for the last week. It's been getting solid bounces off the white descending support following a recent run.
It faked out the support during the recent dip but was able to form a channel below and has now made the first new high on the 12h as the MACD turns positive.
A test o

HFT Buy/Long Setup (1D)After the downward trendline break and the formation of the main CH (Change of Character), we can look for buy/long positions around the key support zones.
A healthy time correction has also formed on the chart, and with price approaching the demand zone, we expect a strong reaction.
The support z

Hashflow Already Hit Bottom, I Can Prove It · 1,300% PPThe bottom is in. I can prove it and you will agree.
Good afternoon my fellow Cryptocurrency trader, how are you feeling in this wonderful day?
Hashflow (HFT) has been dropping since February 2023, a major decline but there is good news, just recently market conditions and price action dynamics st
HFTUSDT UPDATE
Pattern: Falling Wedge Breakout
Current Price: \$0.0940
Target Price: \$0.1630
Target % Gain: 85.33%
Technical Analysis: HFT has broken out of a falling wedge on the 8H chart with strong bullish candles. Volume confirms the breakout, and the move above resistance suggests a potential rally toward

$HFTUSDT Trade Setup 6H.TSX:HFT Trade Setup (6H)
• Entry: CMP
• Stop Loss: $0.0709
• Targets:
T1: $0.0929
T2: $0.1251
Bullish breakout with clean retest.
The setup looks strong if support holds.
DYOR, NFA

See all ideas
Summarizing what the indicators are suggesting.
Oscillators
Neutral
SellBuy
Strong sellStrong buy
Strong sellSellNeutralBuyStrong buy
Oscillators
Neutral
SellBuy
Strong sellStrong buy
Strong sellSellNeutralBuyStrong buy
Summary
Neutral
SellBuy
Strong sellStrong buy
Strong sellSellNeutralBuyStrong buy
Summary
Neutral
SellBuy
Strong sellStrong buy
Strong sellSellNeutralBuyStrong buy
Summary
Neutral
SellBuy
Strong sellStrong buy
Strong sellSellNeutralBuyStrong buy
Moving Averages
Neutral
SellBuy
Strong sellStrong buy
Strong sellSellNeutralBuyStrong buy
Moving Averages
Neutral
SellBuy
Strong sellStrong buy
Strong sellSellNeutralBuyStrong buy
Displays a symbol's price movements over previous years to identify recurring trends.