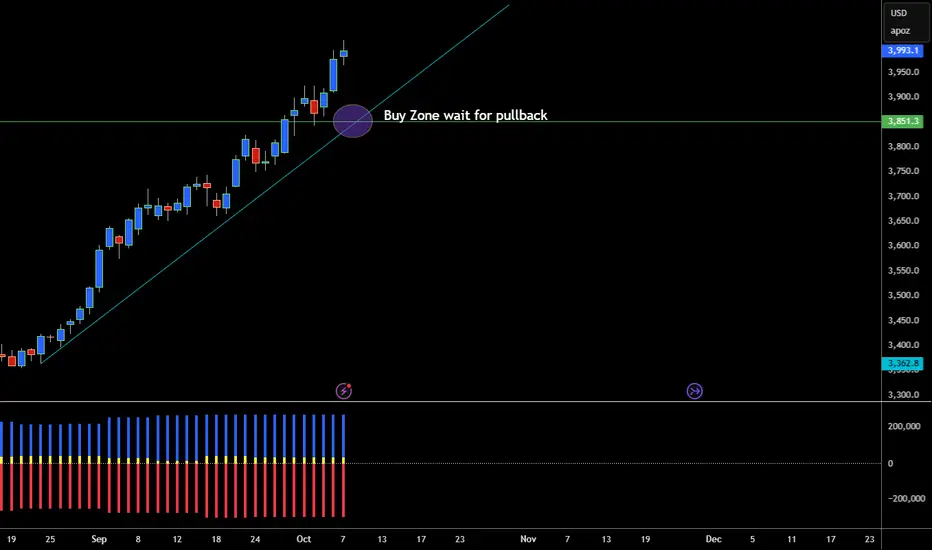
Gold strong bullish momentumHere we can see my channel projection lines and how the bullish momentum just keep on getting stronger and stronger. Now here is the question. Will the bulls pick up more momentum pushing the price even higher to the projected channel line?
Love to hear your opinion, leave a reply.
#Gold
Trade ideas

Gold silver dxyThe date is 10 1825 I'm concerned about the DXY and what it might mean and yet the market is very bullish for gold and silver and I would be thinking of reducing a position or getting out of a pattern that looks like gold or silver because I think they're overbought and that's an invitation for smart money to short the market to take out the breakout traders moving to new highs.

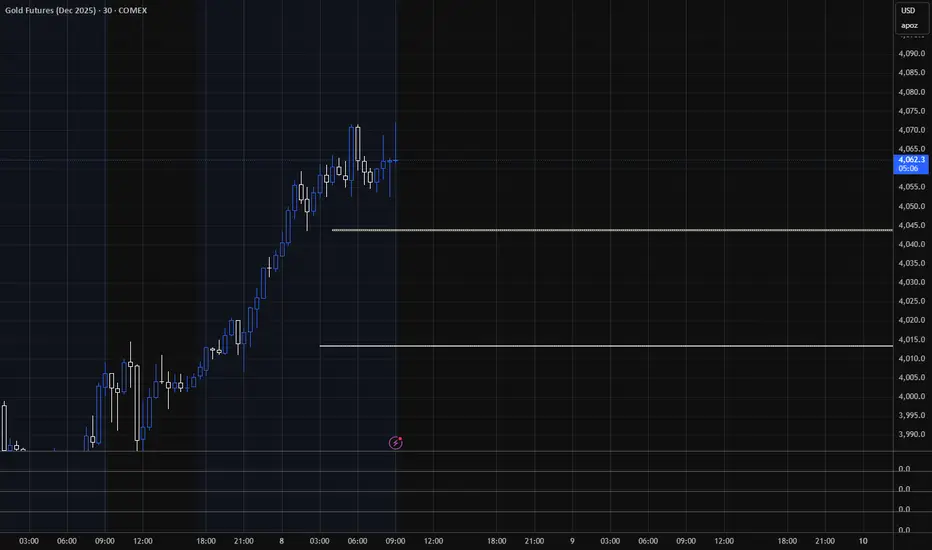
Target areas - GC price for Market open.10/8/25 - These are the target areas - GC price for Market open depending if price moves up or down. Will look for trades into these areas.
Gold!! Support and ResiistanceGold breaks above $4k an oz. It’s just simple support and resistance now

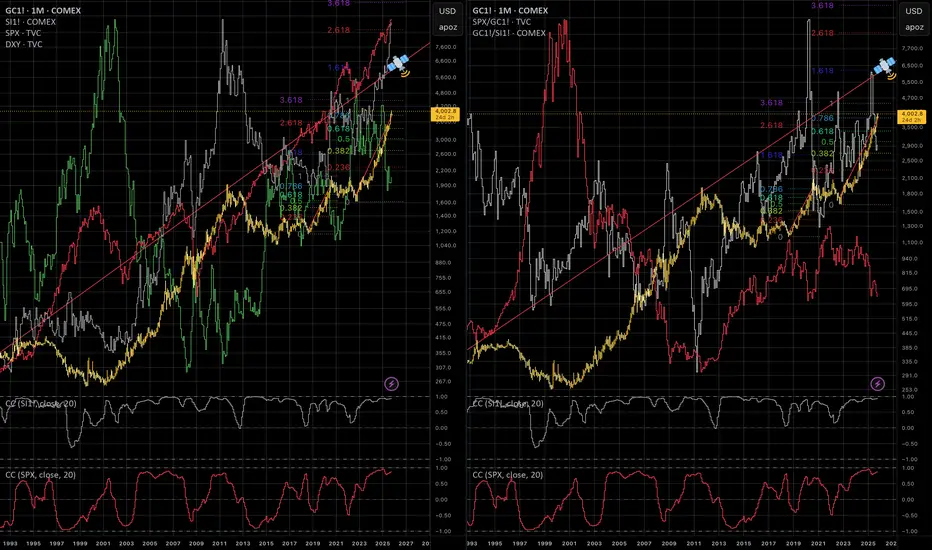
Has Gold Reached Its Fullest Potential?Has gold reached its fullest potential? It depends on the US dollar.
As we can see when dollar declines, gold went up.
i) From 2001 to 2011, when dollar was down, gold went up.
ii) From 2017 to 2020, when dollar was down, gold went up.
iii) And from 2022 to current, when dollar is down, gold is up.
With de-dollarization, this also means gold may have more upside potential.
Mirco Gold Futures and Options
Ticker: MGC
Minimum fluctuation:
0.10 per troy ounce = $1.00
Disclaimer:
• What presented here is not a recommendation, please consult your licensed broker.
• Our mission is to create lateral thinking skills for every investor and trader, knowing when to take a calculated risk with market uncertainty and a bolder risk when opportunity arises.
CME Real-time Market Data help identify trading set-ups in real-time and express my market views. If you have futures in your trading portfolio, you can check out on CME Group data plans available that suit your trading needs www.tradingview.com

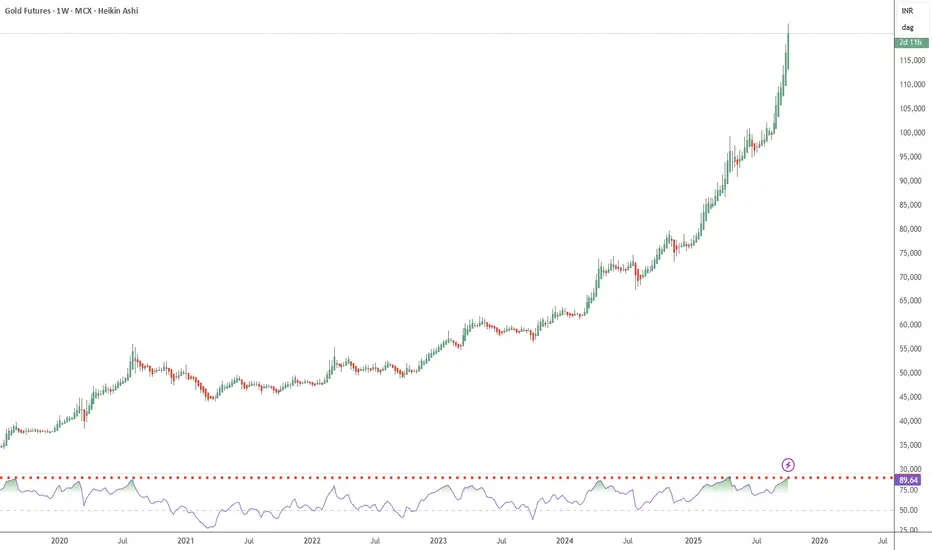
Gold - weekly RSI now in topping zoneWeekly RSI now at zone (and higher) from where major bull moves have topped out
Try contrarian shorts here via puts
Gold...Officially hit my $4k target, though I'm already out of it.
Looks like a 3 drive pattern, equal length with each starting when MFI gets oversold on my 3 hr chart. If it is, it "should" drop back to $3800 level. I don't recommend shorting it though, gold never seems to drop, it just goes sideways instead.
If it does pull back, I'm going back in for the blow off top, lol.

Gold Cant stop...Wont Stop....Price continues pressing into new highs with no meaningful pullback, showing strong safe-haven momentum amid rising geopolitical tension.
Watching for signs of exhaustion near current highs — ideally a liquidity sweep above the Daily High (DH) before any structural shift confirms.
No rush to fade strength. Waiting for:
A clean displacement break below intraday structure.
Retest of an unmitigated FVG or imbalance for potential short.
Until then, bullish continuation remains in control.
Bias: Neutral → Bullish (waiting for confirmation)
Setup on Watch: Liquidity Sweep + SSB (Shift in Structure Break)

Can it happen?Disclaimer
This content is for informational and educational purposes only and should not be construed as financial or investment advice. The author is not a registered financial advisor. Trading and investing in financial markets involve substantial risk of loss and is not suitable for every investor. Past performance is not indicative of future results. Always conduct your own research and consult with a qualified professional before making any investment decisions.
Gold Approaching the $4,000 Target: A Campaign Five Years in theGold continues to advance toward a key target level that was first identified in 2019. The metal is now just seven points away from $4,000, marking significant progress in a multi-year campaign.
In 2019, a position was opened in GLD (the gold ETF) based on Point and Figure (PNF) chart counts that revealed two major price targets. The first target was above $2,000, which gold reached before entering a very prolonged trading range. The second projection pointed to levels above $4,000—the target now within reach.
That original GLD position remains open, as the price action continues to align with the projections from the Point and Figure analysis.
Gold currently sits just seven points from the $4,000 mark. The expectation for gold to move above $4,000 has been in place for quite some time, and the market is now positioned at this critical juncture.
There are specific levels that need to be overcome for gold to successfully breach the $4,000 threshold. The current market structure includes what appears to be a last speculative move up.
The most recent triangular reaction in gold's price structure is notable for being the largest one in the current campaign. This larger consolidation pattern indicates that supply is now influencing price more significantly, particularly after an opposing force has entered the market.
When an opposing force comes into the market in this manner, the swing structure pattern suggests a specific sequence: a reaction followed by a climactic run. The question now is whether this pattern could carry gold above the $4,000 target.
So far, gold remains on the trajectory toward exceeding $4,000. The combination of the Point and Figure count projections from 2019 and the current swing structure dynamics support the view that gold is positioned for this move.
The coming price action at and around the $4,000 level will determine whether this campaign, which began over five years ago, can achieve its second major target.
GOLD MARKET FLYING HIGH BUT LOOKING OVERBOUGHT?Hey Traders another week in the life of trading so today we are looking at Gold. Talk about a rally this thing has some serious momentum!
Gold has officially launched from it's rocket ship🚀
So where are we now?
I mean imo I think we are really overbought and at least due for some time of correction. It's kind of hard to make $$$$ buying at the high.
However the trend is our friend and we are definetly in an uptrend so best way to trade the trend is buy when market pulls back to the trendline.
Scenarios today are:
Bullish- I would say 3850-3900 looks like a good place where the market could pull back before getting back onboard the rocketship. Looks like good area to buy with risk stop below support around 3800 or lower.
Bearish- Would not consider shorting at this time unless market forms some type of top formation or at least breaks below really significant support like 3800.
Commitment of Traders- The Funds are long Gold with 267,000 long positions once they get to 300,000 last time history shows they start closing out some of those longs before they buy back in this can cause market to fall. But overall they are still extremely bullish but soon they are going to become imo overcrowded bullish and thats when the market can sell off dramatically. There is no report friday because of govnment shutdown so we will have to wait until report resumes to see the Funds Next Move.
Good Luck & Always use Risk Management!
(Just in we are wrong in our analysis most experts recommend never to risk more than 2% of your account equity on any given trade.)
Hope This Helps Your Trading 😃
Clifford
RISK DISCLOSURE
TRADING IN THE FUTURES AND FOREX MARKET INVOLVES SIGNIFICANT RISK. ALWAYS CONSULT A FINANCIAL ADVISOR AS HIGH RISK ASSET CLASSES MAY NOT BE SUITABLE FOR ALL INVESTORS. THIS IS NOT A RECOMMENDATION TO BUY OR SELL ANY ASSETS. ALL IDEAS ARE MADE FOR EDUCATIONAL PURPOSES. PAST PERFORMANCE DOES NOT GUARANTEE FUTURE RESULTS.
CFTC RULE 4.41 – HYPOTHETICAL OR SIMULATED PERFORMANCE RESULTS HAVE CERTAIN LIMITATIONS. UNLIKE AN ACTUAL PERFORMANCE RECORD, SIMULATED RESULTS DO NOT REPRESENT ACTUAL TRADING.
3700This channel is not providing individualized trading or investment advice, nor is it a banking service, brokerage service, trading service, investment service or money management service

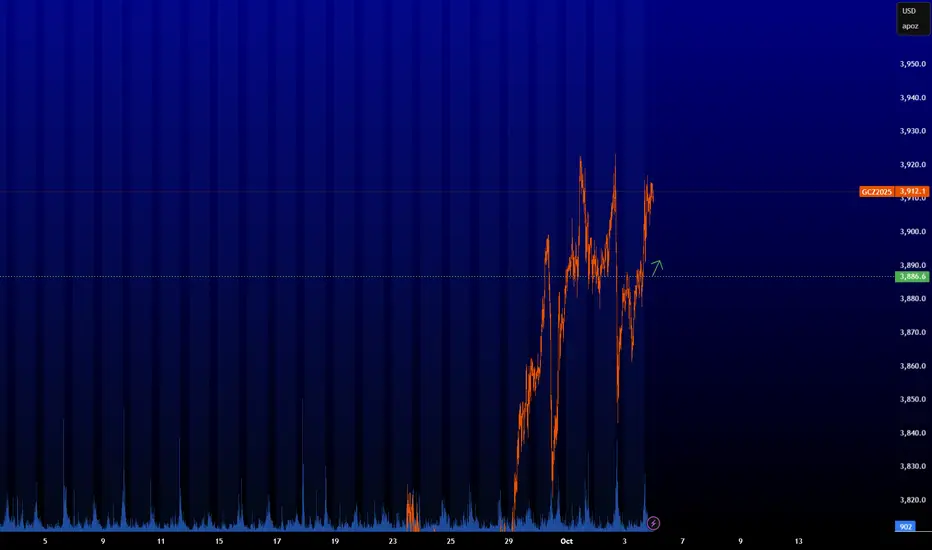
Will Gold (Spot) Test $4,000/oz or Gold is Becoming UnsFall DownGold is Becoming Unstoppable
Made a New Record High of +3976.5
- But Will It Rise Further? Will it Test $4000 per oz?
or
- Will Fall Down From Here (The New ATHs) ?????
Taking reference from the Gold Futures Market
- Gold futures already & officially hit $4,000/oz for the first time in history.
- Generally, it is expected that the spot price & the futures prices converge as the contract expiration date approaches
- That means at expiry, gold spot & future must attain the same level
That means the spot might rise to 4000, or the future price might fall from 4000
The attached Gold mini future chart says that gold prices might fall from current levels

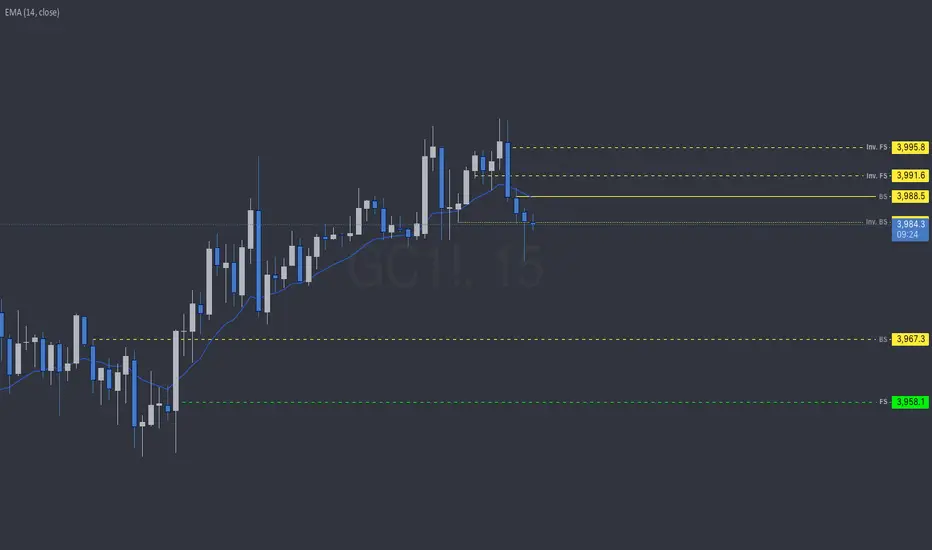
GC - Hourly ideaJust marked the hourly resistance levels as Inv.FS and the solid line BS
support is below price BS dashed line is the hourly level and the green dashed line is the 5min timeframe FS
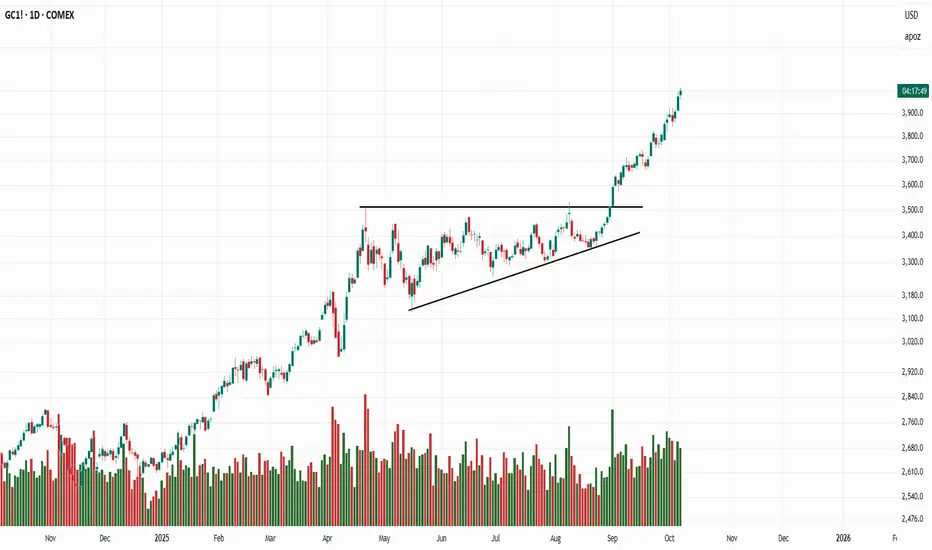
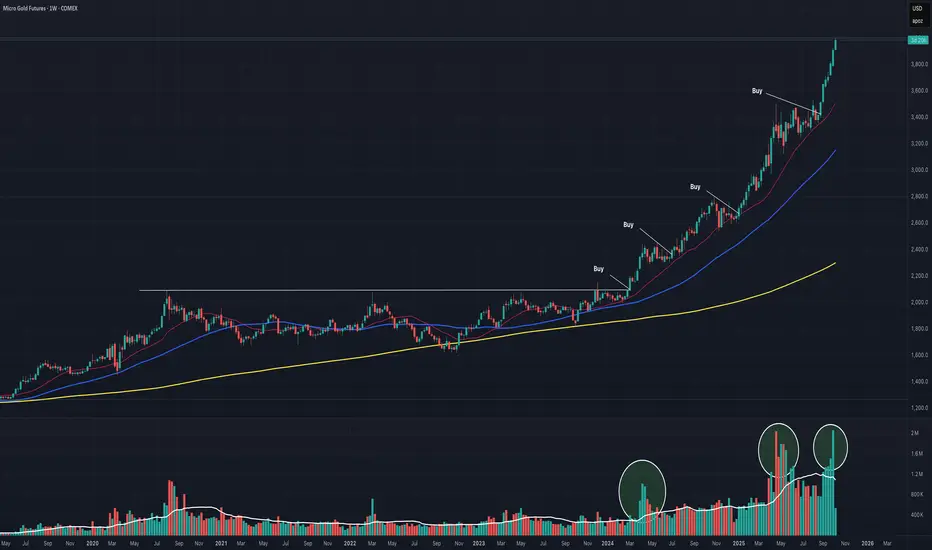
Gold’s Epic Breakout | Parabolic Curve with Flag & Pennant SetupWhat a run for Gold (GC1!) — a powerful move years in the making.
After a long, flat base from Sept 2020 to March 2024, gold finally broke out and has been trending with incredible momentum ever since. If you missed the initial breakout, there were multiple clean reentry setups along the way — offering low-risk, high-reward opportunities.
Each pullback to the 10- or 20-week line formed classic bull flags and pennants, providing continuation entries within a larger parabolic curve structure.
The overall pattern shows acceleration — each base gets shorter, steeper, and accompanied by expanding volume, the hallmark of a strong parabolic trend.
So while the macro trend is parabolic, the buy points were tactical — small, high-probability continuation setups that allowed traders to compound gains without chasing.
Gold Futures (MGC) – No Pullback, Just Pure StrengthPrice never offered a clean pullback yesterday — just an aggressive continuation straight through prior structure. That type of behavior usually signals either institutional repricing or momentum fueled by broader uncertainty (like the ongoing U.S. government shutdown risk).
🔹 Bias: Bullish until a clear break of intraday structure
🔹 Current Levels:
‣ W-H: 3922.8
‣ M-H: 3899.5
‣ D-L: 3909.0
💡 Notes:
Price is extremely extended, but until we see evidence of rejection or a 1H BOS (break of structure), the path of least resistance remains up. I’m watching closely for a controlled pullback into demand — ideally near 3920–3900 — to join the next wave higher.
Still keeping an eye on news risk tonight; if the shutdown proceeds, volatility could spike and disrupt the structure.
#GoldFutures #MGC #FuturesTrading #SmartMoney #DayTrading #PriceAction #NOFOMO

MCX Gold Futures – Intraday Analysis for 7th Oct 2025MCX:GOLD2!
Gold is trading at 121,603, consolidating just above the zero line (121,583), after a breakout above resistance, followed by mild profit-taking. This is a key inflection zone for either a momentum extension or a retracement.
Bullish Scenario
Long Entry (121,321):
Initiate fresh longs above 121,321, confirming buyers supporting every dip at trend breakout levels.
Additional exposure can be taken at 121,145 (add-long area) if minor dips are absorbed, marking higher lows.
Upside Targets:
122,504 (Target 1): First mapped supply zone and profit booking area.
123,073 (Target 2): Extended bullish target if strong momentum continues.
Stop Loss:
Place below 120,969 (short entry) or progressively trail as price moves up.
Bearish Scenario
Short Entry (120,969):
Shorts trigger below 120,969, marking breakdown of support and handed control back to sellers.
Downside Targets:
120,662 (Target 1): Demand zone and first logical bounce/support area.
120,093 (Target 2): Next extension target for aggressive move.
Stop Loss:
Cover shorts if price retakes 121,321 to avoid losses on failed breakdowns.
Range/Neutral Logic
Zero Line (121,583):
Price at zero line marks market balance; sustained action above encourages further momentum, while repeated rejection here raises risk of short-term pullback to lower supports.
Avoid new trades around zero line unless breakout/breakdown conviction emerges.

Long trade
30min TF overview
Trade 4 – Active Trade Idea
Direction: Buyside trade
Date: Fri 3rd Oct 2025, 9.00 am
Entry: 3900.8
Profit Level (TP): 3967.3 (+1.70%)
Stop Level (SL): 3837.0 (−1.33%)
RR: 5.16
Narrative:
Setup aligns with sweep/trigger/entry model.
Market respected the prior demand zone and left a clean FVG + liquidity pool below.
EMA/WMA structure is turning bullish.
Fibonacci extension targets 1.618 – 2.618 zones (3921–3967).
5min TF overview
Summary
Gold continues to display a buy-side bias following accumulation and successful retests of the demand zone. Multiple trades have been logged, and the current narrative favours further upside towards the 3960–3970 range, provided the 3837 support level holds. In addition, the potential U.S. government shutdown may prompt investors to seek safer havens such as Gold, which could further support this continuation trajectory.

Gold Futures (MGC) – Pushing Into New HighsPrice continues to climb into all-new highs with very little pullback, showing clear bullish momentum. However, structure is getting thin, and momentum could begin to exhaust soon.
🔹 Current Bias: Bullish — until 4H structure breaks.
🔹 Key Levels:
‣ W-H: 3928
‣ D-H: 3916
‣ D-L: 3861
‣ Daily FVG: 3820–3720
💡 Notes:
Price has yet to rebalance the large Daily FVG below. If we sweep external liquidity above 3928–3935 and fail to close strong, that could set up a pullback or even a deeper correction into the Daily FVG zone.
Volume profile shows thin structure between 3860–3820 — if momentum fades, that area could act as a magnet for price.
For now, the bullish pressure remains intact — but I’m watching closely for exhaustion signs or a liquidity grab setup at the highs.
#GoldFutures #MGC #FuturesTrading #ICT #PriceAction #SmartMoney #DayTrading #NOFOMO

GC : Long levelThe level has been activated, so you can buy it. I have slightly edited it since last time. It is best to scalp or pip it; I cannot promise any significant movement. Be careful when trading on news or at market close/open.
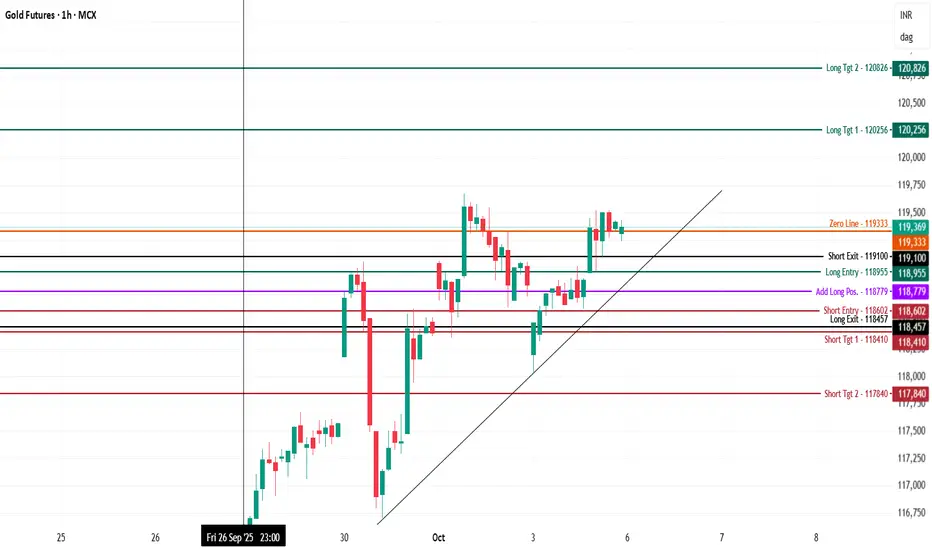
Gold Dec. Futures (MCX) – Intraday Analysis 6th Oct., 2025MCX:GOLD1!
Gold is consolidating at 119,369 after a strong bounce, with price action pressing against a pivotal resistance area (zero line) and testing higher-low support in a sideways-to-bullish formation.
Bullish (Long) Setup
Long Entry (118,955):
Fresh longs are actionable above 118,955 with price holding above recent swing support, confirming buyers’ intent for further upside.
Adds can be managed at 118,779 if dips hold with rising volume and higher lows.
Upside Targets:
120,256 (Target 1): First mapped supply zone and likely profit-booking area.
120,826 (Target 2): Higher bullish extension and next major resistance.
Stop Loss:
Keep stops below 118,602 (short entry area) or 118,457 (long exit) to reduce risk in case of reversal.
Bearish (Short) Setup
Short Entry (118,602):
Shorts activate below 118,602, confirming breakdown of support and shifting momentum to sellers.
Downside Targets:
118,410 (Target 1): Bounce/support area for first profit booking.
117,840 (Target 2): Deeper extension and next major demand zone.
Stop Loss:
Exit shorts if price retakes 118,955 to avoid losses on failed breakdown.
Range/Neutral Logic
Zero Line (119,333):
Current action near the zero line marks the market balance; a sustained close above 119,333 supports bullish momentum, while repeated rejection turns bias sideways or soft bearish.
Wait for a breakout from the zero line for high-conviction trades.
New ATHs for Gold?It seems like every single week, gold has been making new ATHs. With the overall bullish sentiment of the market plus the government shutdown, I don't see price slowing down any time soon.
As long as price is trading above the VWAP on lower time frames (4H, 1H, 15min), we could continue to see ATHs up to $4,000.
Me personally, I've been very cautious trading in these ATH markets. The reason is because price doesn't have much structure to follow. There's no clear vision of the target when entering longs and you're kind of just trading into no-mans-land.
We'll see what price decides to do early in the beginning of the trading week.

gold this week is reaching a critical point. ( 15 minute chart )look for a retest of this level its the 4th time it touches it are the sellers going to hold it or will it break through this time creating new highs..........
pennant flag pattern
