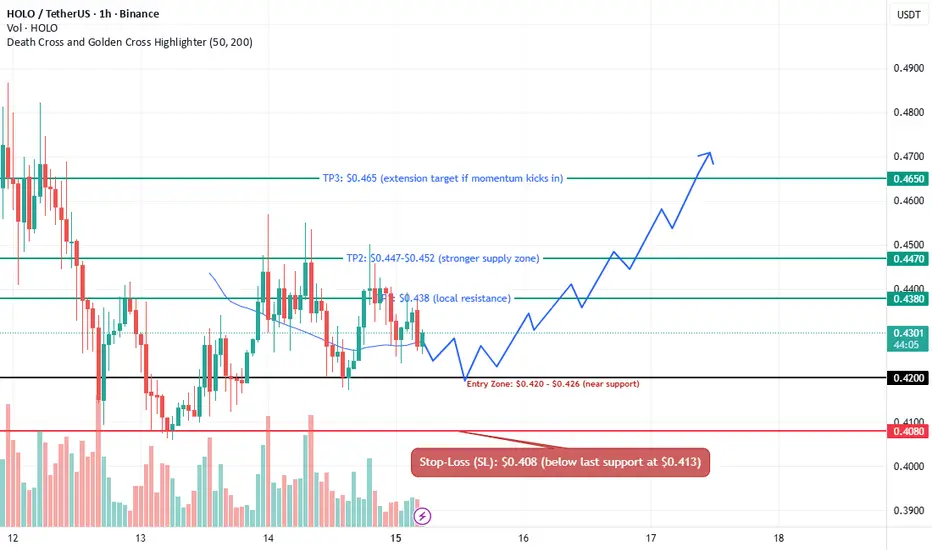
HOLO/USDT – Key Levels & Trade Plan🟢 HOLO/USDT – Key Levels & Trade Plan
Bias: Mildly Bullish (as long as $0.413 holds)
Technical Outlook
Price recently tested support at $0.413–$0.420 and showed signs of a rebound.
Indicators:
RSI approaching recovery from oversold region.
MACD showing bullish divergence.
Bollinger Bands
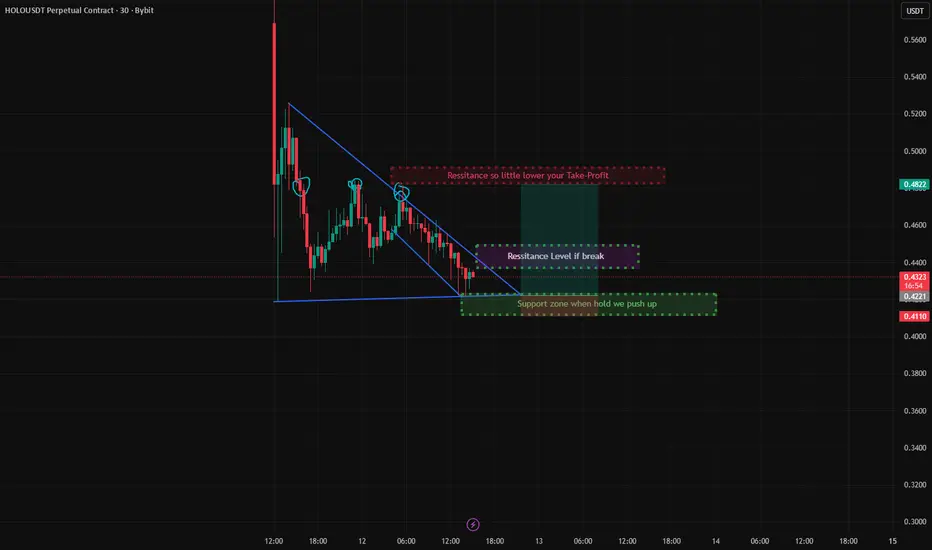
HOLO/USDT🔍 Key Technical Zones:
🔽 Descending Resistance Trendline: Price has touched and respected this level multiple times. A breakout above this trendline could signal a bullish move.
✅ Support Zone (Green Box):
Around $0.42 – price has held this level multiple times, forming the base of the wedge. A st
See all ideas
Summarizing what the indicators are suggesting.
Oscillators
Neutral
SellBuy
Strong sellStrong buy
Strong sellSellNeutralBuyStrong buy
Oscillators
Neutral
SellBuy
Strong sellStrong buy
Strong sellSellNeutralBuyStrong buy
Summary
Neutral
SellBuy
Strong sellStrong buy
Strong sellSellNeutralBuyStrong buy
Summary
Neutral
SellBuy
Strong sellStrong buy
Strong sellSellNeutralBuyStrong buy
Summary
Neutral
SellBuy
Strong sellStrong buy
Strong sellSellNeutralBuyStrong buy
Moving Averages
Neutral
SellBuy
Strong sellStrong buy
Strong sellSellNeutralBuyStrong buy
Moving Averages
Neutral
SellBuy
Strong sellStrong buy
Strong sellSellNeutralBuyStrong buy