HOLO/USDT – Key Levels & Trade Plan🟢 HOLO/USDT – Key Levels & Trade Plan
Bias: Mildly Bullish (as long as $0.413 holds)
Technical Outlook
Price recently tested support at $0.413–$0.420 and showed signs of a rebound.
Indicators:
RSI approaching recovery from oversold region.
MACD showing bullish divergence.
Bollinger Bands contracting → potential volatility squeeze.
Overhead resistance at $0.438–$0.447 has capped recent rallies.
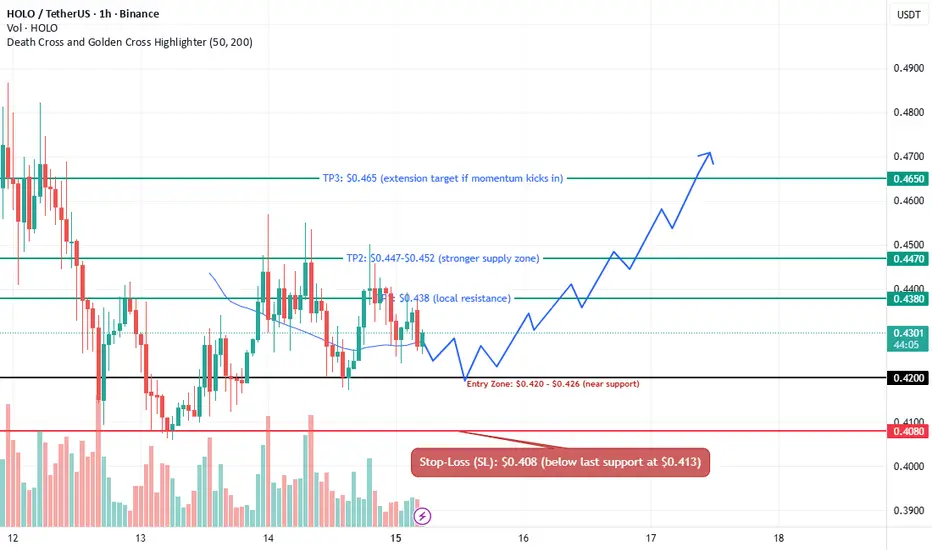
Trade Plan
Long Setup
Entry: $0.420 – $0.426
Stop-Loss: $0.408 (below support)
Targets:
TP1: $0.438
TP2: $0.447 – $0.452
TP3: $0.465
Short Setup (only if breakdown occurs)
Trigger: Close below $0.413 with strong volume
Stop-Loss: $0.422
Targets:
TP1: $0.398
TP2: $0.386
TP3: $0.372
I’m mildly bullish while $0.413 holds. If buyers sustain momentum, a move toward $0.447–0.465 is on the table.
But a clean breakdown under $0.413 invalidates longs and opens downside targets.
👉 Always manage risk—levels above are for educational purposes, not financial advice.
HOLOUSDT.P trade ideas
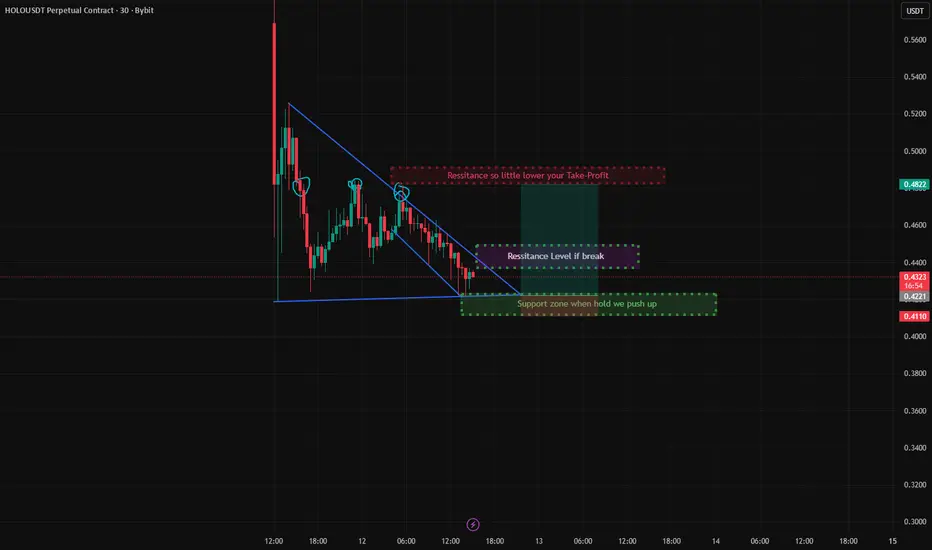
HOLO/USDT🔍 Key Technical Zones:
🔽 Descending Resistance Trendline: Price has touched and respected this level multiple times. A breakout above this trendline could signal a bullish move.
✅ Support Zone (Green Box):
Around $0.42 – price has held this level multiple times, forming the base of the wedge. A strong bounce from here increases bullish probability.
🔼 Immediate Resistance (Purple Box):
Around $0.45 – if the wedge breaks, this is the first resistance zone to watch.
🎯 Take-Profit Zone (Red Box):
Near $0.48 – a conservative TP area just below the major resistance zone to ensure filled orders.
🧠 Strategy Suggestion:
Entry idea: Consider long position on breakout above the descending wedge resistance with volume confirmation.
Stop-loss: Below the support zone ($0.42 or slightly lower).
Target: $0.45 to $0.48 area depending on risk appetite.
⚠️ Note:
Watch for false breakouts or wicks through trendlines.
Always manage risk — this is not financial advice.