#HOT/USDT Ready to go up#HOT
The price is moving within a descending channel on the hourly timeframe. It has reached the lower boundary and is heading towards a breakout, with a retest of the upper boundary expected.
The Relative Strength Index (RSI) is showing a downward trend, approaching the lower boundary, and an upw
Related pairs

HOT Near Lower Channel Support, Liquidity Zone in FocusHOT continues to trade inside a clear descending channel on the higher time frame and is currently positioned near the lower boundary of the structure.
Price action suggests the market may revisit the previous wick around 0.000314, which sits inside a known liquidity zone. A move into this area cou

hot coin looking good after long bearish wavePrice is continuing to squeeze and compress, indicating building pressure. A strong upside breakout is possible from this zone.
A good volume candle closing above the descending trendline can trigger a solid move in the coming days. If the breakout holds successfully with a daily or 2-day candle clo

#HOT/USDT Ready to go up#HOT
The price is moving within a descending channel on the hourly timeframe. It has reached the lower boundary and is heading towards a breakout, with a retest of the upper boundary expected.
The Relative Strength Index (RSI) is showing a downward trend, approaching the lower boundary, and an upw

HOT/USDT – Descending Trendline, Breakdown or Reversal Ahead?The HOT/USDT pair on the 2D timeframe remains in a long-term downtrend since the late-2024 peak. Price continues to form lower highs and lower lows, confirming strong seller dominance. Currently, price is consolidating after a sharp decline, positioned just below the major descending trendline.
--

#HOT/USDT is about to blast off! Study internet bubble stocks.#HOT
The price is moving in a descending channel on the 1-hour timeframe. It has reached the upper limit and is heading towards breaking downwards, with a retest of the upper limit expected.
We have an upward trend on the RSI indicator, which has reached near the upper limit, and a downward revers

#HOT/USDT Ready to go up#HOT
The price is moving in a descending channel on the 1-hour timeframe. It has reached the lower boundary and is heading towards a breakout, with a retest of the upper boundary expected.
We are seeing a bearish trend in the Relative Strength Index (RSI), which has reached near the lower boundary

#HOT/USDT — Testing Demand Zone: Major Accumulation or Breakdo#HOT
The price is moving in a descending channel on the 1-hour timeframe. It has reached the lower boundary and is heading towards breaking above it, with a retest of the upper boundary expected.
We have a downtrend on the RSI indicator, which has reached near the lower boundary, and an upward reb

#HOT/USDT — Testing Demand Zone: Major Accumulation or Breakdo#HOT
The price is moving in a descending channel on the 1-hour timeframe and is expected to break out and continue upwards.
We have a trend to stabilize above the 100-period moving average again.
We have a downtrend on the RSI indicator, which supports an upward move if it breaks above it.
We ha

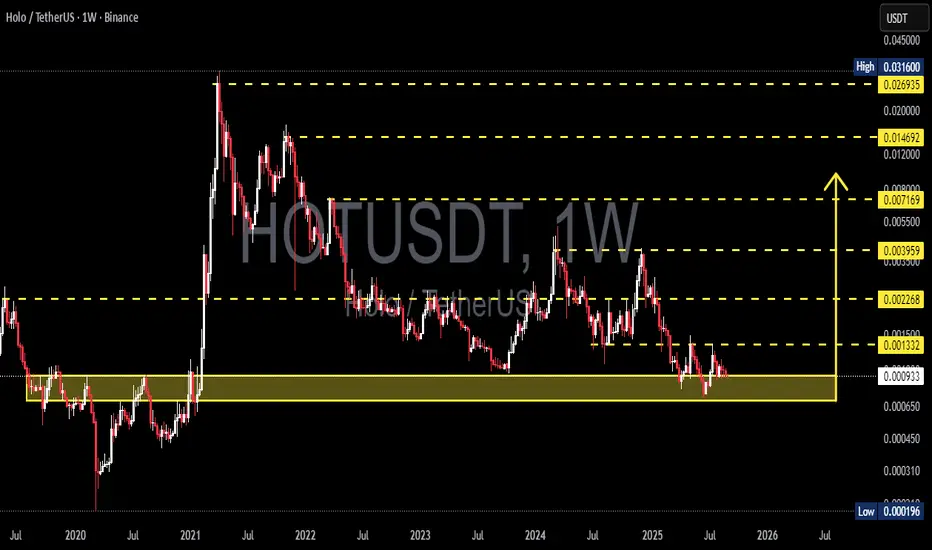
HOT/USDT — Testing Demand Zone: Major Accumulation or Breakdown?📊 Overview
HOT (Holochain) is now trading at a multi-year demand zone that has been significant since 2019–2020. This zone is critical because:
1. It served as the launchpad for the massive 2021 rally.
2. It has been retested multiple times during extreme market downturns.
3. Price has returne
See all ideas
Summarizing what the indicators are suggesting.
Oscillators
Neutral
SellBuy
Strong sellStrong buy
Strong sellSellNeutralBuyStrong buy
Oscillators
Neutral
SellBuy
Strong sellStrong buy
Strong sellSellNeutralBuyStrong buy
Summary
Neutral
SellBuy
Strong sellStrong buy
Strong sellSellNeutralBuyStrong buy
Summary
Neutral
SellBuy
Strong sellStrong buy
Strong sellSellNeutralBuyStrong buy
Summary
Neutral
SellBuy
Strong sellStrong buy
Strong sellSellNeutralBuyStrong buy
Moving Averages
Neutral
SellBuy
Strong sellStrong buy
Strong sellSellNeutralBuyStrong buy
Moving Averages
Neutral
SellBuy
Strong sellStrong buy
Strong sellSellNeutralBuyStrong buy
Displays a symbol's price movements over previous years to identify recurring trends.
Frequently Asked Questions
The current price of Holo / TetherUS (HOT) is 0.000370 USDT — it has risen 0.54% in the past 24 hours. Try placing this info into the context by checking out what coins are also gaining and losing at the moment and seeing HOT price chart.
Holo / TetherUS price has fallen by −9.95% over the last week, its month performance shows a −27.25% decrease, and as for the last year, Holo / TetherUS has decreased by −77.92%. See more dynamics on HOT price chart.
Keep track of coins' changes with our Crypto Coins Heatmap.
Keep track of coins' changes with our Crypto Coins Heatmap.
Holo / TetherUS (HOT) reached its highest price on Apr 5, 2021 — it amounted to 0.031600 USDT. Find more insights on the HOT price chart.
See the list of crypto gainers and choose what best fits your strategy.
See the list of crypto gainers and choose what best fits your strategy.
Holo / TetherUS (HOT) reached the lowest price of 0.000196 USDT on Mar 13, 2020. View more Holo / TetherUS dynamics on the price chart.
See the list of crypto losers to find unexpected opportunities.
See the list of crypto losers to find unexpected opportunities.
The safest choice when buying HOT is to go to a well-known crypto exchange. Some of the popular names are Binance, Coinbase, Kraken. But you'll have to find a reliable broker and create an account first. You can trade HOT right from TradingView charts — just choose a broker and connect to your account.
Crypto markets are famous for their volatility, so one should study all the available stats before adding crypto assets to their portfolio. Very often it's technical analysis that comes in handy. We prepared technical ratings for Holo / TetherUS (HOT): today its technical analysis shows the strong sell signal, and according to the 1 week rating HOT shows the sell signal. And you'd better dig deeper and study 1 month rating too — it's sell. Find inspiration in Holo / TetherUS trading ideas and keep track of what's moving crypto markets with our crypto news feed.
Holo / TetherUS (HOT) is just as reliable as any other crypto asset — this corner of the world market is highly volatile. Today, for instance, Holo / TetherUS is estimated as 5.43% volatile. The only thing it means is that you must prepare and examine all available information before making a decision. And if you're not sure about Holo / TetherUS, you can find more inspiration in our curated watchlists.
You can discuss Holo / TetherUS (HOT) with other users in our public chats, Minds or in the comments to Ideas.